. 2022 Mar 8;7(5):e156522.
doi: 10.1172/jci.insight.156522.

Leukocytes mediate disease pathogenesis in the Ndufs4(KO) mouse model of Leigh syndrome

Affiliations

Leukocytes mediate disease pathogenesis in the Ndufs4(KO) mouse model of Leigh syndrome

Julia C Stokes et al. JCI Insight. .

Abstract

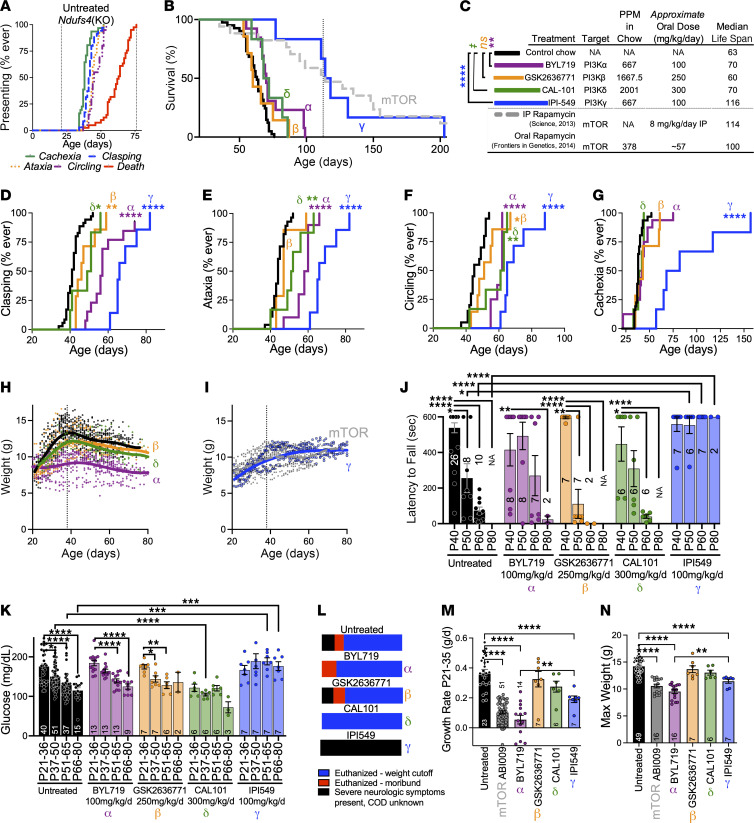
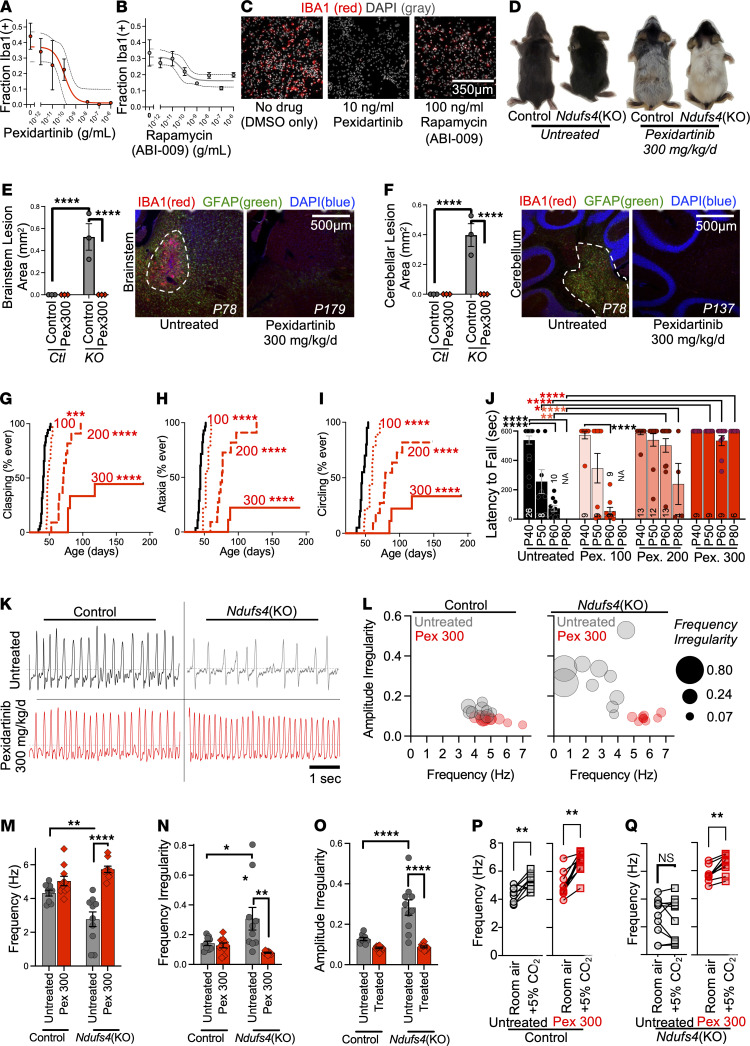
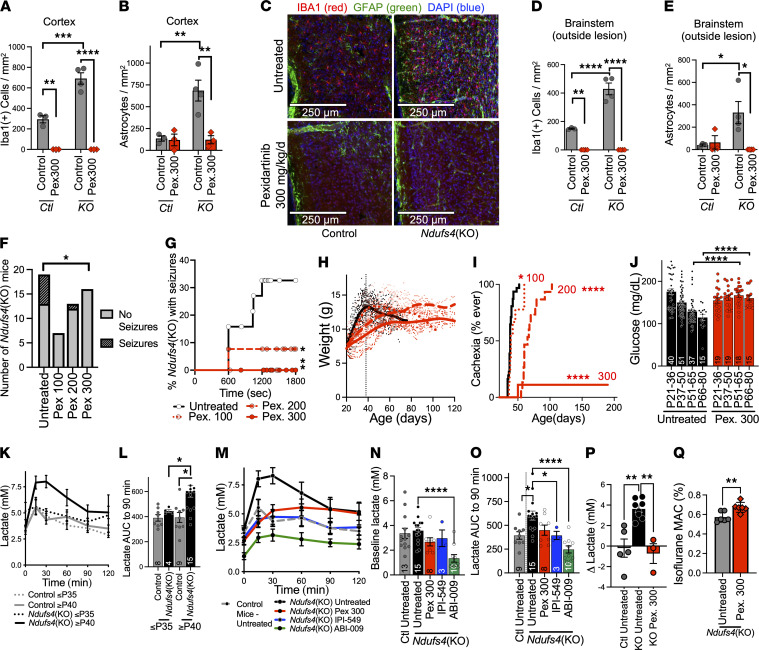
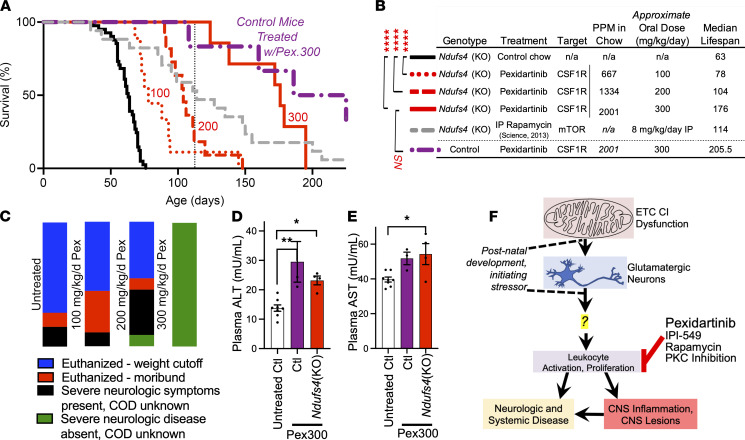
Symmetric, progressive, necrotizing lesions in the brainstem are a defining feature of Leigh syndrome (LS). A mechanistic understanding of the pathogenesis of these lesions has been elusive. Here, we report that leukocyte proliferation is causally involved in the pathogenesis of LS. Depleting leukocytes with a colony-stimulating factor 1 receptor inhibitor disrupted disease progression, including suppression of CNS lesion formation and a substantial extension of survival. Leukocyte depletion rescued diverse symptoms, including seizures, respiratory center function, hyperlactemia, and neurologic sequelae. These data reveal a mechanistic explanation for the beneficial effects of mTOR inhibition. More importantly, these findings dramatically alter our understanding of the pathogenesis of LS, demonstrating that immune involvement is causal in disease. This work has important implications for the mechanisms of mitochondrial disease and may lead to novel therapeutic strategies.

Keywords: Genetic diseases; Inflammation; Mitochondria; Mouse models; Neuroscience.


Figures

Figure 1
Figure 1. Isoform-specific inhibition of PI3K catalytic subunit p110γ, but not p110α, p110β, or p110δ, significantly attenuates disease in the Ndufs4(KO) mouse model of LS.
(A) Age of cachexia (n = 31), clasping (n = 35), ataxia (n = 28), and circling (n = 20) onset and of death (n = 41) (see Methods for symptoms, replicates, scoring). (B and C) Survival (B) and life span and dosage data (C) for Ndufs4(KO) mice administered control chow (black, n = 41) or isoform-specific inhibitors of PI3K catalytic subunits: p110α/BYL719 (n = 13), p110β/GSK2636771 (n = 7), p110δ/CAL101 (n = 6), p110γ/IPI549 (n = 6). Rapamycin for reference (see refs. 4, 5); line, median for rapamycin. (C) Color key for B and D-G, dosing, and median life spans. P = 0.017, **P < 0.005, and ****P < 0.0001, log-rank test (Bonferroni-corrected significance threshold, BCST: P < 0.015). (D-G) Clasping (D), ataxia (E), circling (F), and cachexia (G) in Ndufs4(KO) mice treated with BYL719 (n = 12, 10, 8, 16), GSK2636771 (n = 7, 7, 7, 7), CAL101 (n = 6, 6, 6, 6), or IPI549 (n = 7, 7, 7, 6). Treatment indicated by color (see C) and p110 α/β/δ/γ symbols. Control-treated ns as in A. *P < 0.015, **P < 0.005, ***P < 0.0005, and ****P < 0.0001 by log-rank test vs. untreated Ndufs4(KO) (BCST: P < 0.015). (H and I) Ndufs4(KO) weight by age and treatment (indicated by color and symbol; mTOR, ABI009 treatment); local regression (Lowess) curve overlaid. ns as in B. (J) Performance of Ndufs4(KO) mice on a rotarod assay. (K) Blood glucose by age (see Methods). (J and K) n provided as numbers within/above bars. *P < 0.015, **P < 0.005, ***P < 0.0005, and ****P < 0.0001 by Welch’s t test (treated vs. untreated BCST: P < 0.015; vs. baseline within same treatment BCST: P < 0.0167). For rotarod, when animals die before P80, t tests are interpreted as significant. (L) Cause of death in survival studies. n values as in A and B. (M and N) Growth rate P21–P35 (M) and maximum weight during life (N). ns indicated within bars. *P < 0.0033, ***P < 0.0005, and ****P < 0.0001, unpaired, unequal variances (Welch’s) t test (BCST: P < 0.0033). Data represent mean, error bars ± SEM, unless otherwise stated.
Figure 2
Figure 2. Leukocyte depletion prevents CNS lesions and significantly attenuates disease in the Ndufs4(KO) model of LS.
(A and B) Dose-dependent impact of the CSF1R inhibitor pexidartinib (A) and rapamycin (ABI-009 formulation) (B) on the fraction of Iba1+ leukocytes (likely microglia given cell origins, see Methods) in mixed primary brain cultures. Error bars show ± SEM. Dashed lines, 95% confidence interval for inhibitor vs. response (3 parameters) least squares fit. n = 3 replicates/concentration for rapamycin, 6/condition for pexidartinib (data representative of 3 independent experiments). (C) Representative images of mixed primary brain cultures from A and B stained with an anti-Iba1 antibody (red) and DAPI (blue, nuclei). Scale bar in rapamycin image is representative for all. (D) Representative pictures of control and Ndufs4(KO) animals fed control diet or ~300 mg/kg/d pexidartinib chow. (E and F) Brainstem (E) and cerebellar peduncle (F) lesion size (area of lesion in central slice in serial sectioning, see Methods) in control-treated (Untreated) and 300 mg/kg/d pexidartinib (Pex300) treated control (Ctl) and Ndufs4(KO) (KO) animals. Quantification and representative images provided for each region. Representative images are only provided for Ndufs4(KO) animals as control mice do not develop lesions. See Figure 3 for quantification of Iba1+ leukocytes and GFAP+ astrocytes in control and Ndufs4(KO) mice. Anti-Iba1 antibody staining in red, DAPI (nuclei) in grayscale (see Methods). Lesion areas indicated by dashed white lines. Ages are noted in representative images (P78, etc.). ****P < 0.0001 by unpaired, unequal variances (Welch’s) t test. n = 3 animals per condition. (GI) Onset of clasping (G), ataxia (H), and circling (I) in Ndufs4(KO) mice fed control diet (black lines, n as in Figure 1; see Methods) or administered pexidartinib at 100 mg/kg/d (dotted red lines, n = 9, 9, 9), 200 mg/kg/d (dashed red lines, n = 11, 11, 11), or 300 mg/kg/d (solid red lines, n = 9, 9, 9). ***P < 0.0005, and ****P < 0.0001 by log-rank test vs. untreated Ndufs4(KO) animals (Bonferroni significance threshold = P < 0.0167). (J) Performance of control- and pexidartinib-treated animals on a rotarod assay. **P < 0.005, and ****P < 0.0001 by unpaired, unequal variances (Welch’s) t test (BCST = *P < 0.0167 for both comparisons between pexidartinib-treated and control untreated mice and for comparisons to baseline within same treatment). Replicates (ns) are shown by vertically oriented numbers within/above bars. For rotarod, where animals do not survive to P80, t test undefined but interpreted as highly significant (see Methods). (K) Representative traces of respiratory (breathing) activity in P70 (±2 days) control and Ndufs4(KO) mice control treated or fed 300 mg/kg/d pexidartinib chow. (L) Multivariable plotting of respiratory amplitude irregularity, frequency, and frequency irregularity in P70 (±2 days) control and Ndufs4(KO) mice fed control chow or administered 300 mg/kg/d pexidartinib. (M) Frequency of breathing (representative data in K). (N and O) Single-variable analysis of data in L. (MO) Data points represent individual animals, *P < 0.05, **P < 0.005, and ****P < 0.0005 by 2-way ANOVA with Tukey’s multiple-testing correction–adjusted P values for pairwise comparisons. Each comparison is pairwise. (P and Q) Respiratory responses to increased environmental CO2. Pairwise data shown for responses in individual mice. **P < 0.005 by Wilcoxon matched pairs signed-rank test. For all panels, data represent mean, error bars ± SEM, unless otherwise stated. (MQ) n = 9 for control animal data sets, 10 for Ndufs4(KO) data sets.
Figure 3
Figure 3. Leukocyte depletion prevents leukocyte/microglia accumulation and astrocytosis throughout the brain and rescues a range of systemic symptoms associated with LS in the Ndufs4(KO) mice.
(AC) Iba1+ leukocytes/microglia (A) (see Discussion) and GFAP+ astrocytes (B) in cortex of control- and pexidartinib-treated control and Ndufs4(KO) (see Methods). Data points represent individual animals. n = 4 for untreated Ndufs4(KO), 3 for other groups. (C) Representative images of cortex. (D and E) Iba1+ leukocytes/microglia and GFAP+ astrocytes in brainstem regions outside overt lesions in control- and pexidartinib-treated control and Ndufs4(KO) mice (representative images in Figure 2). Data points represent individual animals. n = 4 for untreated Ndufs4(KO), 3 for other groups. *P < 0.05, **P < 0.005, ***P < 0.0005, and ****P < 0.0001, 2-way ANOVA with Tukey’s multiple-testing correction–adjusted P values for pairwise comparisons. (F) Rotarod-induced seizure frequency at P30 by treatment. *P < 0.016, Fisher’s exact test (Bonferroni-adjusted P value cutoff for significance = 0.0167). n indicated by bars. (G) Time to seizure in rotarod assay, P30. All data points shown. *P < 0.05, log-rank test. ns as in F. (H) Scatter plots of Ndufs4(KO) mouse weight as a function of age and treatment, with local regression (Lowess) curves to display population trends. (I) Cachexia onset (see Figure 1, Methods) in control- and pexidartinib-treated Ndufs4(KO) mice. Colors and ns as in G. *P < 0.0167, ****P < 0.00005, log-rank test (Bonferroni-corrected P value cutoff for significance = 0.0167). (J) Blood glucose by age in control- and pexidartinib-treated Ndufs4(KO) animals. Each point represents the median value for 1 animal during the period (data points are biological replicates/individual animals). ****P < 0.0001 by unpaired, unequal variances (Welch’s) t test (Bonferroni-corrected P value cutoff for significance = 0.0125). ns as indicated in bars. (K and L) Blood lactate in response to a glucose bolus (2 g/kg) in control and Ndufs4(KO) mice at predisease (P25) and early disease (P45). (K) Time course and (L) total AUC for blood lactate 0–90 minutes. *P < 0.008, 2-way ANOVA with Tukey’s multiple-testing correction–adjusted P values for pairwise comparisons. ns indicated in bars. (MO) Blood lactate in response to glucose bolus (2 g/kg) in untreated control and Ndufs4(KO) mice and Ndufs4(KO) mice treated with pexidartinib (300 mg/kg/d in chow), IPI-549 (100 mg/kg/d in chow), or rapamycin (ABI-009 formulation, 8 mg/kg/d IP). Time course of blood lactate (M), baseline lactate (N), and total AUC for blood lactate (O) 0–90 minutes. *P < 0.0167, **P < 0.005, ****P < 0.0001 by unpaired, unequal variances (Welch’s) t test (Bonferroni-adjusted significance cutoff = 0.0167). ns indicated in bars (N and O). (P) Change in blood lactate in control and Ndufs4(KO) mice after 30-minute exposure to 0.4% isoflurane and impact of treatment with 300 mg/kg/d pexidartinib. n = 5, 7, and 3. **P < 0.005 by 1-way ANOVA with Tukey’s multiple-testing correction–adjusted P values for pairwise comparisons. (K and M) AUC, not individual time points, were compared. (Q) Minimum alveolar anesthetic concentration (MAC) of isoflurane associated with anesthesia in control- and pexidartinib-treated Ndufs4(KO) mice (see Methods). **P < 0.005 by unpaired, unequal variances (Welch’s) t test. n = 6/group. Data represent mean, error bars ± SEM, unless otherwise stated.
Figure 4
Figure 4. Pexidartinib dose dependently increases Ndufs4(KO) survival, with survival limited by drug toxicity rather than CNS disease.
(A and B) Survival and cause of death in Ndufs4(KO) mice treated with increasing doses of pexidartinib. (A) Survival curves. Black line — control-treated Ndufs4(KO). Red dotted, dashed, and solid lines — Ndufs4(KO) mice treated with 100, 200, or 300 mg/kg/d pexidartinib, respectively (n as in Figure 2, G–I). Purple dashed/dotted line — control animals treated with 300 mg/kg/d pexidartinib (n = 6). Gray dashed line — rapamycin life span (for reference, see Figure 1). (B) Median life spans and dosing data associated with A. ****P < 0.0001 by log-rank test (passing Bonferroni’s cutoff of P < 0.0167). (C) Cause of death for Ndufs4(KO) animals in control and pexidartinib treatment groups (all control animals on pexidartinib 300 mg/kg/d died of unknown causes with no overt signs of disease/illness). n as in A. (D) Plasma ALT and (E) plasma AST levels (see Supplemental Methods). Data represent mean, error bars ± SEM. *P < 0.05, **P < 0.005 by 1-way ANOVA with Tukey’s multiple-testing correction–adjusted P values for pairwise comparisons. n = 8, 3, and 4 for untreated controls and pexidartinib 300 mg/kg/d treated controls and Ndufs4(KO) animals, respectively. (F) A model for the pathogenesis of disease in LS (see Discussion). In this model, CNS lesions and many systemic sequelae are causally downstream of immune involvement. A central role for glutamatergic neurons in initiating disease has previously been identified (8, 40), while our findings here reveal a role for leukocytes in the pathogenesis of disease. In the model resulting from these combined data, the mechanisms underlying the benefits of rapamycin and of PKC inhibitors, previously shown to benefit the Ndufs4(KO) mouse, can be accounted for by their convergence with pexidartinib and IPI-549 on leukocyte suppression. Key remaining questions are presented in Discussion.

Similar articles

Cited by

References

    1. Goncalves FG, et al. Primary mitochondrial disorders of the pediatric central nervous system: neuroimaging findings. Radiographics. 2020;40(7):2042–2067. doi: 10.1148/rg.2020200052. - DOI - PubMed
    1. Alston CL, et al. The genetics of mitochondrial disease: dissecting mitochondrial pathology using multi-omic pipelines. J Pathol. 2021;254(4):430–442. doi: 10.1002/path.5641. - DOI - PMC - PubMed
    1. Lake NJ, et al. Leigh syndrome: neuropathology and pathogenesis. J Neuropathol Exp Neurol. 2015;74(6):482–492. doi: 10.1097/NEN.0000000000000195. - DOI - PubMed
    1. Johnson SC, et al. Dose-dependent effects of mTOR inhibition on weight and mitochondrial disease in mice. Front Genet. 2015;6:247. - PMC - PubMed
    1. Johnson SC, et al. mTOR inhibition alleviates mitochondrial disease in a mouse model of Leigh syndrome. Science. 2013;342(6165):1524–1528. doi: 10.1126/science.1244360. - DOI - PMC - PubMed

Publication types

Substances