. 2022 Jan 20;18(1):e1009678.
doi: 10.1371/journal.pcbi.1009678. eCollection 2022 Jan.

Use of Raman and Raman optical activity to extract atomistic details of saccharides in aqueous solution

Affiliations

Use of Raman and Raman optical activity to extract atomistic details of saccharides in aqueous solution

Vladimír Palivec et al. PLoS Comput Biol. .

Abstract

Sugars are crucial components in biosystems and industrial applications. In aqueous environments, the natural state of short saccharides or charged glycosaminoglycans is floating and wiggling in solution. Therefore, tools to characterize their structure in a native aqueous environment are crucial but not always available. Here, we show that a combination of Raman/ROA and, on occasions, NMR experiments with Molecular Dynamics (MD) and Quantum Mechanics (QM) is a viable method to gain insights into structural features of sugars in solutions. Combining these methods provides information about accessible ring puckering conformers and their proportions. It also provides information about the conformation of the linkage between the sugar monomers, i.e., glycosidic bonds, allowing for identifying significantly accessible conformers and their relative abundance. For mixtures of sugar moieties, this method enables the deconvolution of the Raman/ROA spectra to find the actual amounts of its molecular constituents, serving as an effective analytical technique. For example, it allows calculating anomeric ratios for reducing sugars and analyzing more complex sugar mixtures to elucidate their real content. Altogether, we show that combining Raman/ROA spectroscopies with simulations is a versatile method applicable to saccharides. It allows for accessing many features with precision comparable to other methods routinely used for this task, making it a viable alternative. Furthermore, we prove that the proposed technique can scale up by studying the complicated raffinose trisaccharide, and therefore, we expect its wide adoption to characterize sugar structural features in solution.


Conflict of interest statement

The authors have declared that no competing interests exist.

Figures
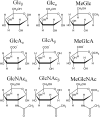
Fig 1
Fig 1. Investigated monosaccharides.
The Figures were prepared with ChemSketch [27] and edited with Inkscape [28].
Fig 2
Fig 2. Investigated oligosaccharides.
Investigated disaccharides: trehalose, methyl-1α-2α-mannobiose (M12), methyl-1α-3α-mannobiose (M13), and methyl-1α-6α-mannobiose (M16), together with defined glycosidic dihedral angles ϕ1, ϕ2, and ϕ3 (explicit atom definitions in S1 File). Bottom raffinose trisaccharide.
Fig 3
Fig 3. M13 free energy surface and sampled structures.
Left: Calculated free energy surface (FES) of M13 disaccharide in {ϕ1, ϕ2} dihedral angles. Middle: Calculated FES, together with 250 extracted structures from unbiased 500 ns MD simulations (MD). Right: Calculated FES, together with 250 extracted structures for each biased 200 ns MD simulation (biased MD; md1/md2/md3/md4; restrain {ϕ1, ϕ2} values in Table 2). White regions represent area with the free energy >40 kJ/mol.
Fig 4
Fig 4. Raman/ROA spectra of M13.
Comparison of experimental (exp.) and calculated spectra of M13 disaccharide. Top left—best fit: Best fit of md1/md2/md3/md4 Raman/ROA spectra to experimental data. Top right—MD: Simulated Raman/ROA spectra obtained using structures from unbiased MD simulation (MD). Bottom—local-conformers: Calculated ensemble averaged Raman/ROA spectra of M13 disaccharide prepared in 4 distinct conformations md1/md2/md3/md4 as described in Fig 3.
Fig 5
Fig 5. M16 free energy surface and sampled structures.
Left: Calculated free energy surface (FES) of M16 disaccharide in terms of the {ϕ1, ϕ2} dihedral angles. Middle: Calculated FES, together with 250 extracted structures from unbiased 500 ns MD simulations (MD). Right: Calculated FES, together with 250 extracted structures per each biased 200 ns MD simulation (biased MD; md1/md2/md3/md4/md5/md6; restrain {ϕ1, ϕ2} values in Table 4). White regions represents area with the free energy >40 kJ/mol.
Fig 6
Fig 6. Raman/ROA spectra of M16.
Comparison of experimental (exp.) and calculated spectra of M16 disaccharide. Top left—best fit: Best fit of md1/md2/md3/md4/md5/md6 Raman/ROA spectra to experimental data. Top right—MD: Simulated Raman/ROA spectra of disaccharide obtained using structures from unbiased MD simulation (MD). Bottom—local-conformers: Calculated ensemble averaged Raman and ROA spectra of disaccharide prepared in 6 distinct conformations md1/md2/md3/md4/md5/md6 as described in Fig 5.
Fig 7
Fig 7. MeGlcA free energy surface and sampled structures.
Left: Calculated FES of MeGlcA in ϕ/θ puckering coordinates. Middle: Calculated FES, together with 250 extracted structures from unbiased 500 ns MD simulations (MD). Right: Calculated FES, together with 250 extracted structures per each biased 200 ns MD simulation(biased MD; 1C4/4C1/OS2/1S3; restrain {ϕ, θ} values in Table 7). All plots are shown as equal area Mollweide projection.
Fig 8
Fig 8. Raman/ROA spectra of MeGlcA.
Comparison of experimental (exp.) and calculated spectra of MeGlcA. Top left—best fit: Best fit of 1C4/4C1/OS2/1S3 Raman/ROA spectra to experimental data. Top right—MD: Simulated Raman/ROA spectra of the monosaccharide obtained using structures from unbiased MD simulation (MD). Bottom—local-conformers: Calculated ensemble averaged Raman and ROA spectra of the monosaccharide prepared in 4 distinct conformations 1C4/4C1/OS2/1S3 as described in Fig 7.
Fig 9
Fig 9. Raman/ROA spectra of raffinose trisaccharide.
Comparison of calculated Raman and ROA spectra of raffinose trisaccharide with experiment.
Fig 10
Fig 10. Raman/ROA spectra of Glc, GlcA, and GlcNAc.
Left: Calculated Raman/ROA spectra for the α/β anomers (Glc, GlcA, and GlcNAc). Right: Best fit to experimental data.
Fig 11
Fig 11. Raman/ROA spectra of mixtures of MeGlc:MeGlcNAc.
In blue the experimental Raman/ROA spectra of MeGlc and MeGlcNAc, and their 3:1, 1:1, and 1:3 mixtures (MeGlc:MeGlcNAc). The best fit simulation spectra to the experiment using the spectra of simulated pure substances to fit them are shown in red (see Fig 12 and Table 10 for the results of the fit).
Fig 12
Fig 12. Prediction of molar fractions of mixtures of MeGlc:MeGlcNAc.
Summary of calculated molar fractions and estimated errors of mixtures (MeGlc:MeGlcNAc) obtained by the best fitting corresponding experimental Raman/ROA spectra of known composition (black,xMeGlc = 0.00, 0.25, 0.5, 0.75, 1.00) using simulation(red, calculated spectra) or experimental(green, experimental spectra) spectra of pure substances to fit them.
Fig 13
Fig 13. Raman/ROA spectra of two MeGlc in close proximity.
Calculated Raman/ROA spectra of methyl-β-glucose at infinite dilution, i.e., single molecule (black), of two interacting methyl-β-glucose sugar moieties (red, representative snapshot in the inset). In blue the experimental spectra at 1 M concentration for comparison.

Similar articles

Cited by

References

    1. Vuorio J, Škerlová J, Fábry M, Veverka V, Vattulainen I, Řezáčová P, et al.. N-glycosylation can selectively block or foster different receptor–ligand binding modes. Scientific Reports. 2021;11(1). doi: 10.1038/s41598-021-84569-z - DOI - PMC - PubMed
    1. Tarbell JM, Cancel LM. The glycocalyx and its significance in human medicine. Journal of Internal Medicine. 2016;280(1):97–113. doi: 10.1111/joim.12465 - DOI - PubMed
    1. Tang Y, Cheng F, Feng Z, Jia G, Li C. Stereostructural elucidation of glucose phosphorylation by Raman optical activity. The Journal of Physical Chemistry B. 2019;123(37):7794–7800. doi: 10.1021/acs.jpcb.9b05968 - DOI - PubMed
    1. Sodhi H, Panitch A. Glycosaminoglycans in tissue engineering: A review. Biomolecules. 2020;11(1):29. doi: 10.3390/biom11010029 - DOI - PMC - PubMed
    1. Imberty A, Pérez S. Structure, conformation, and dynamics of bioactive oligosaccharides: theoretical approaches and experimental validations. Chemical Reviews. 2000;100(12):4567–4588. doi: 10.1021/cr990343j - DOI - PubMed

Publication types