. 2022 Feb 3;185(3):547-562.e22.
doi: 10.1016/j.cell.2021.12.035. Epub 2022 Jan 19.

Genetic manipulation of gut microbes enables single-gene interrogation in a complex microbiome

Affiliations

Genetic manipulation of gut microbes enables single-gene interrogation in a complex microbiome

Wen-Bing Jin et al. Cell. .

Abstract

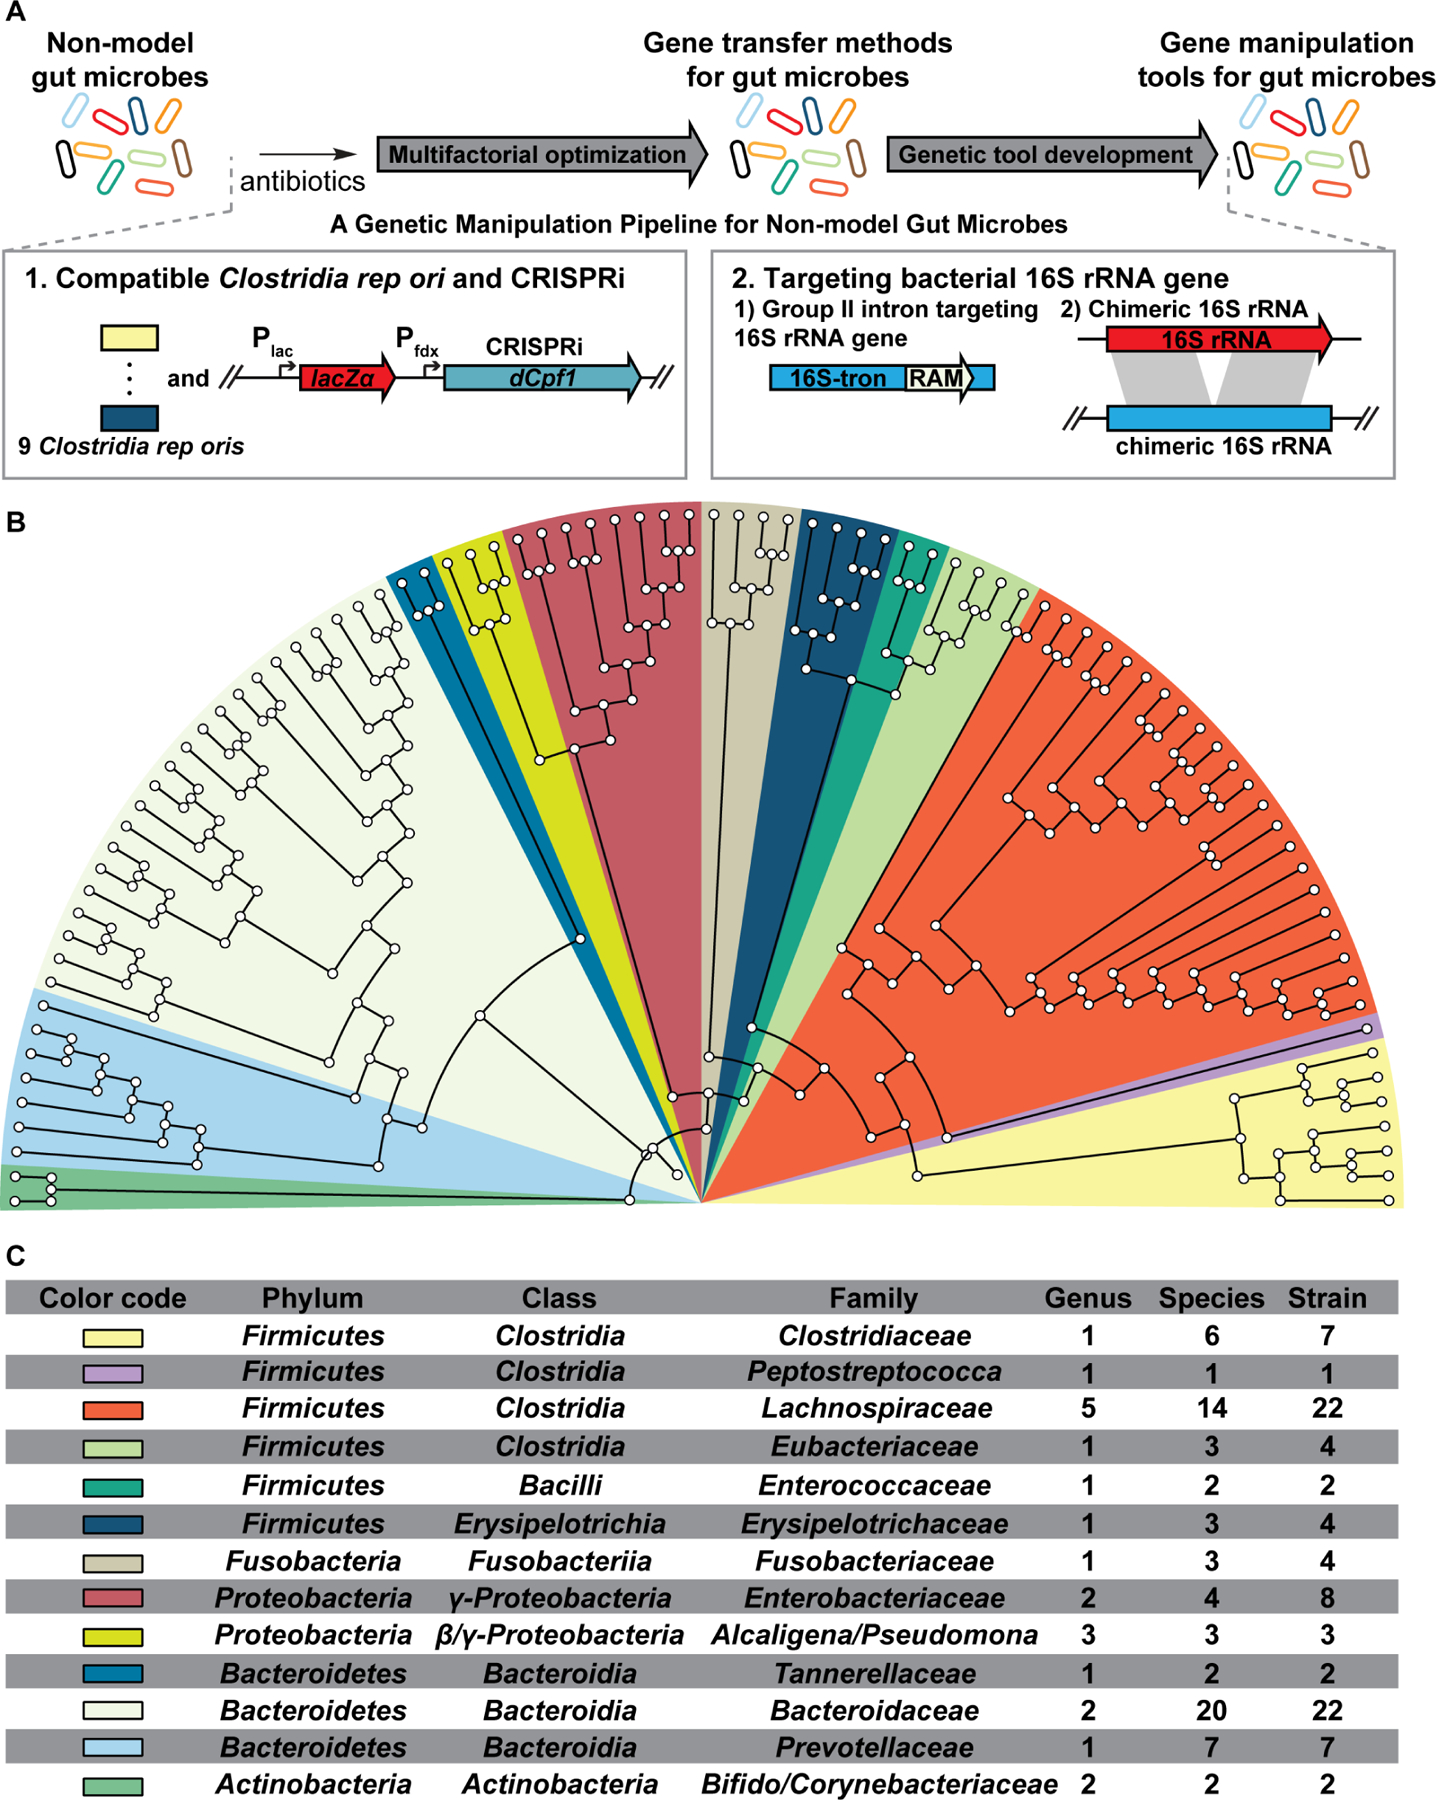
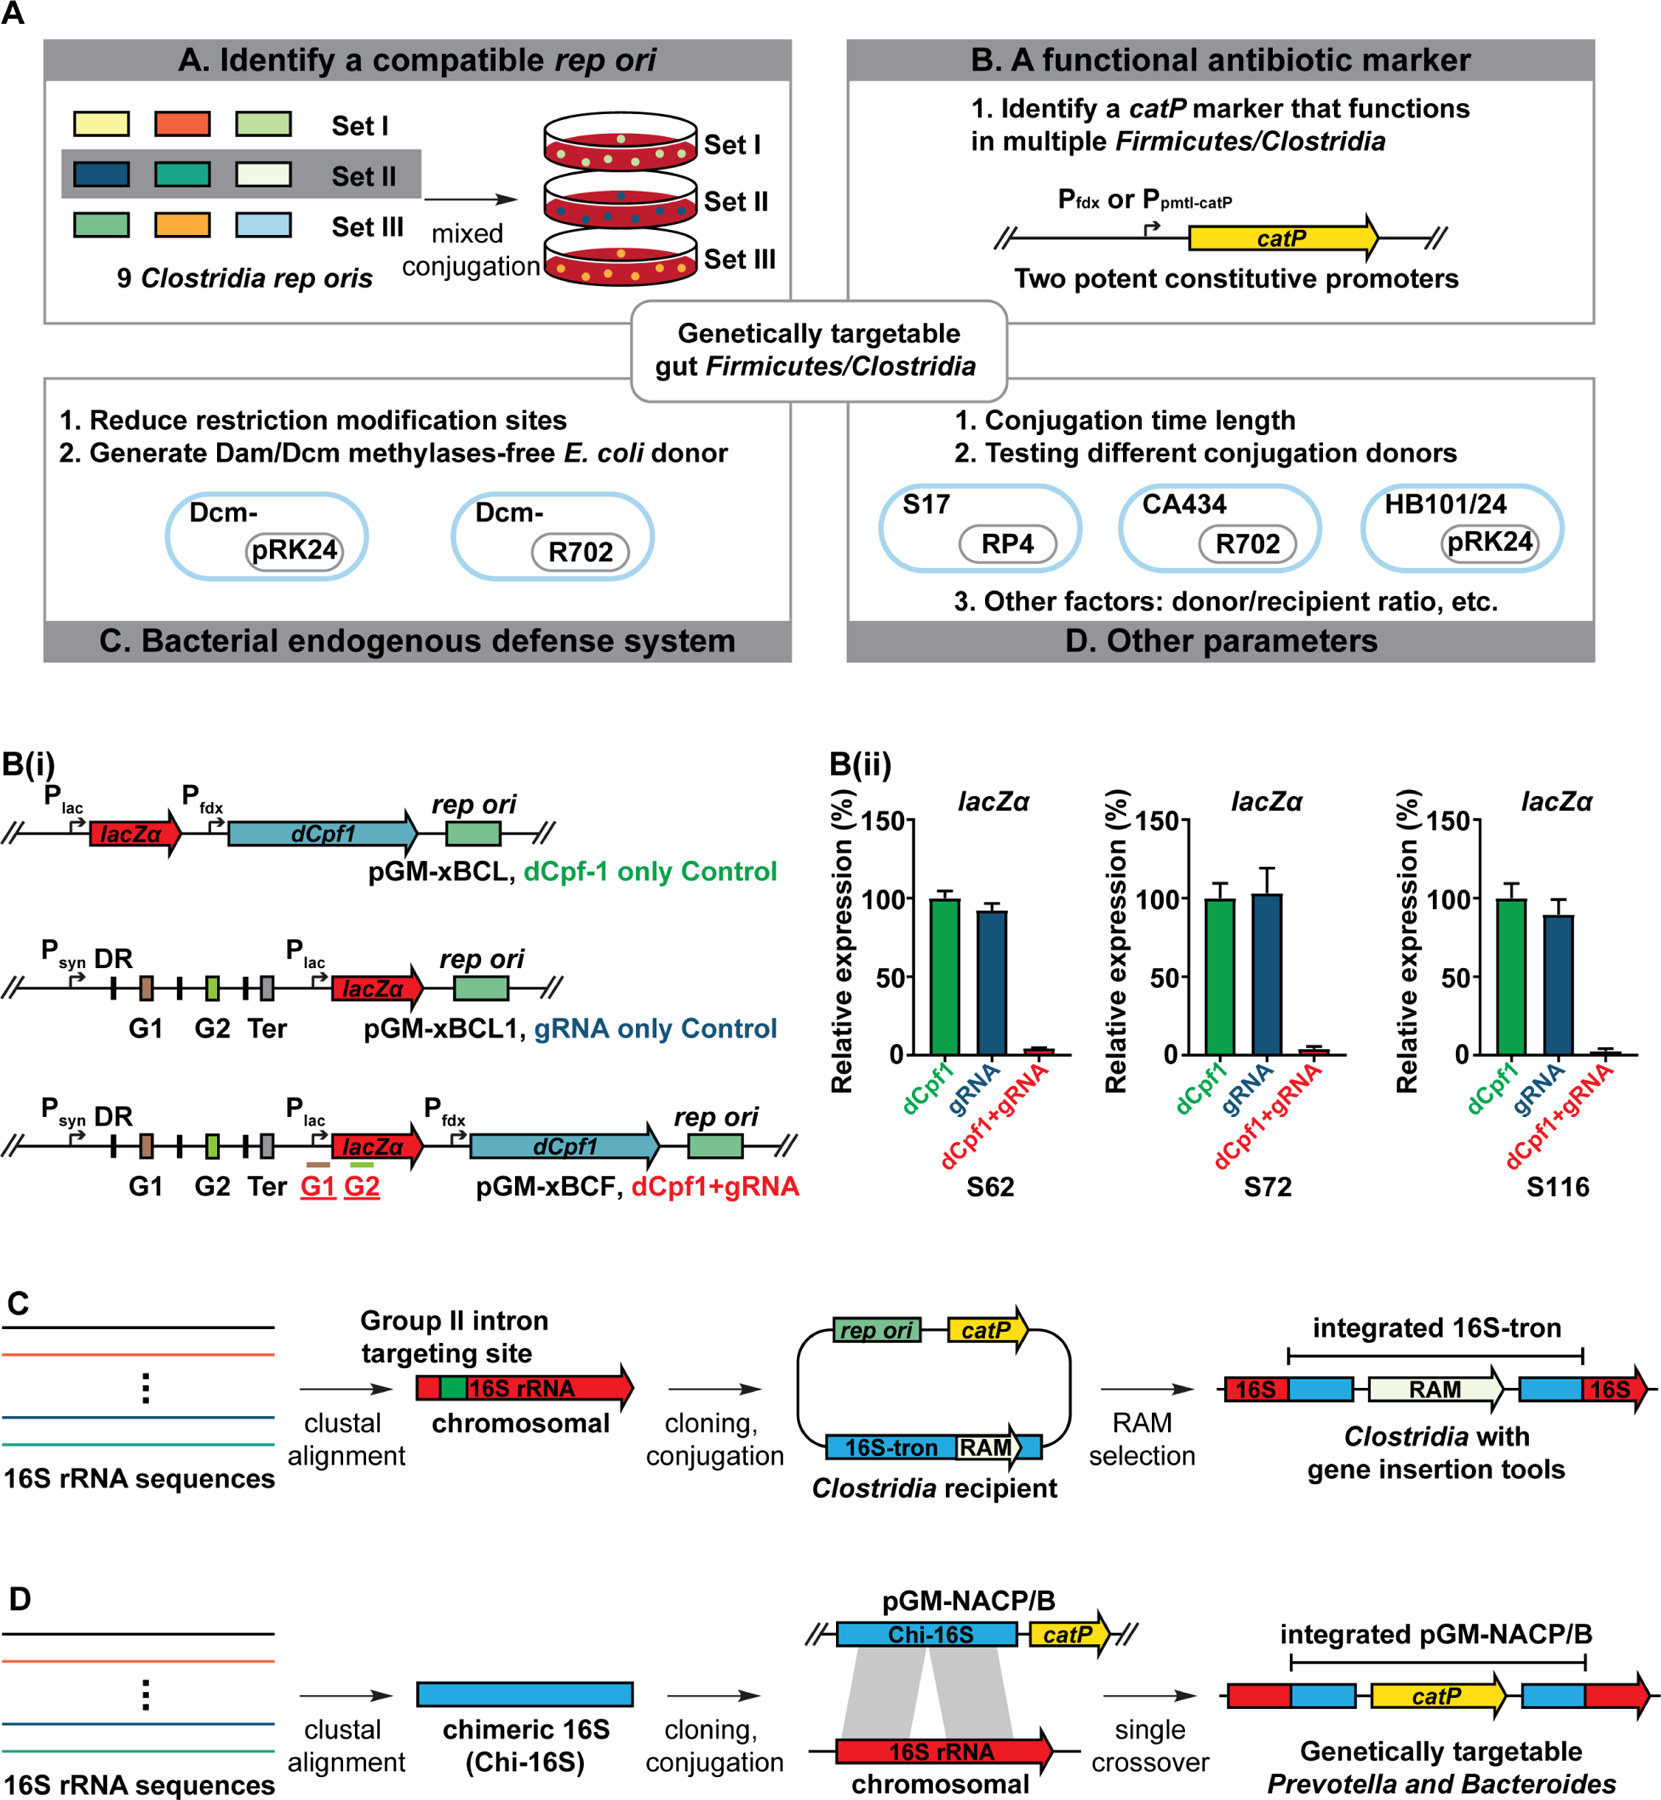
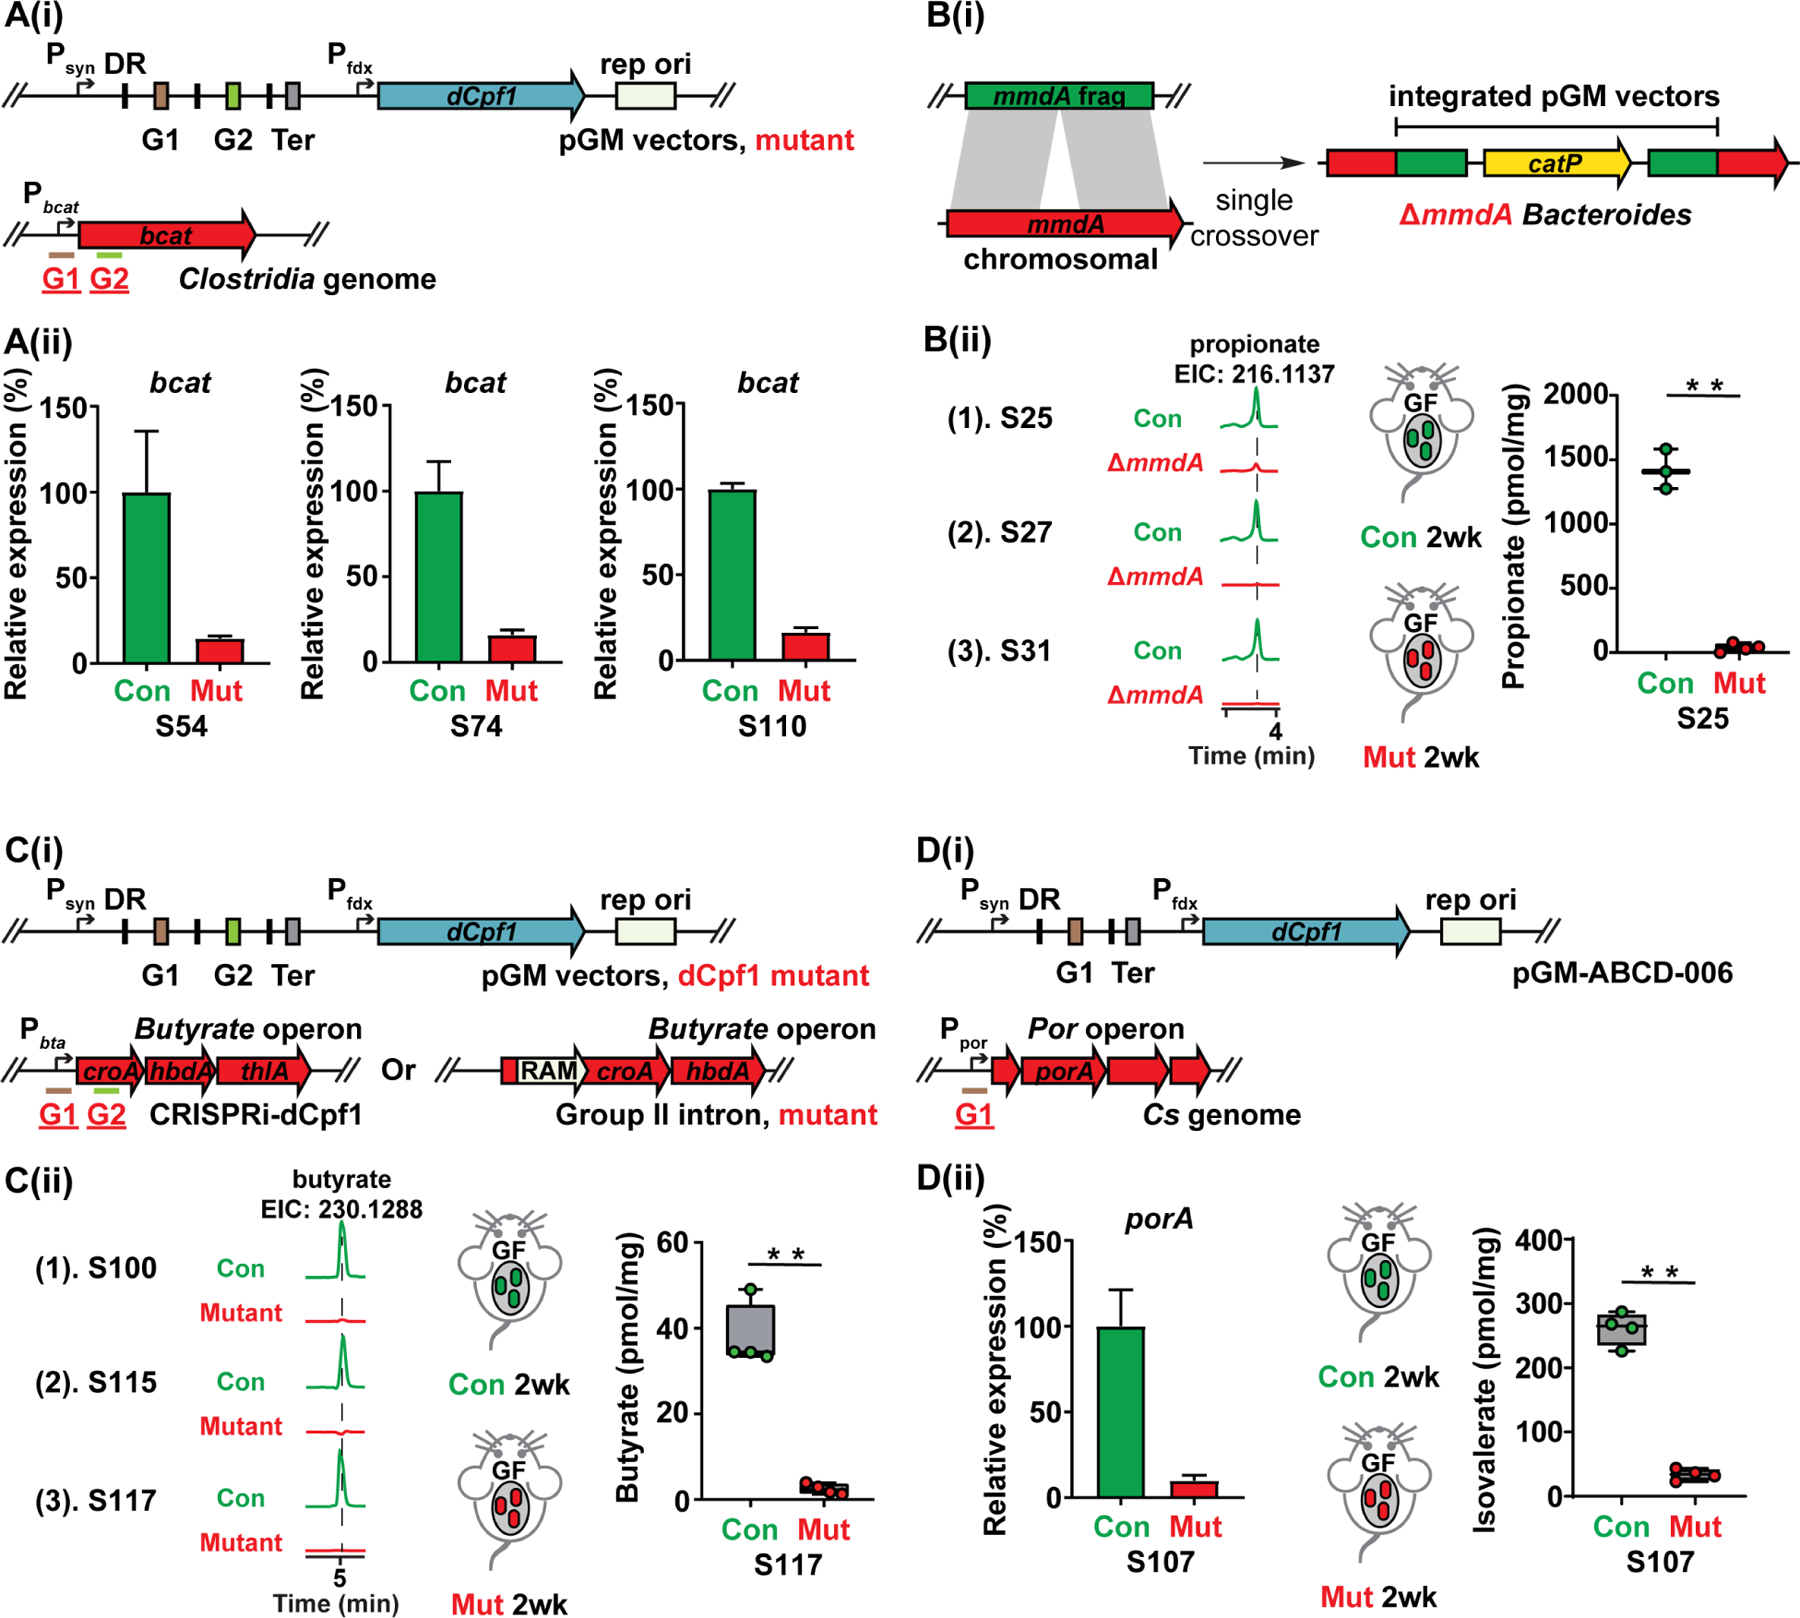
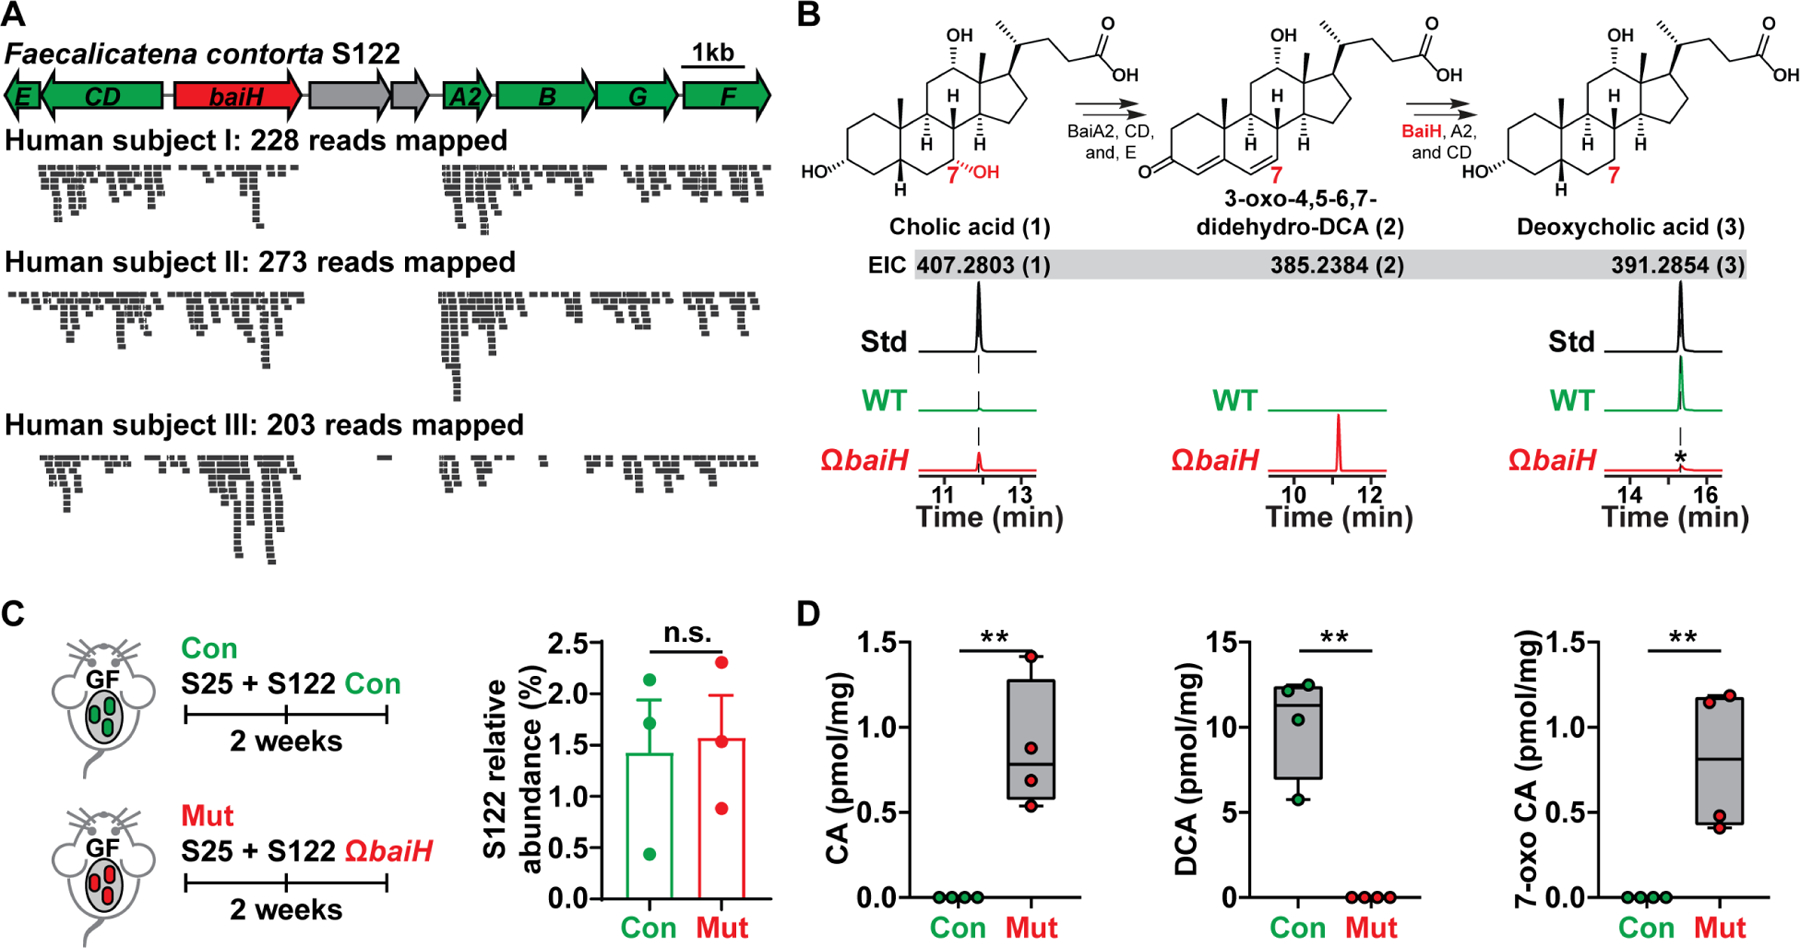
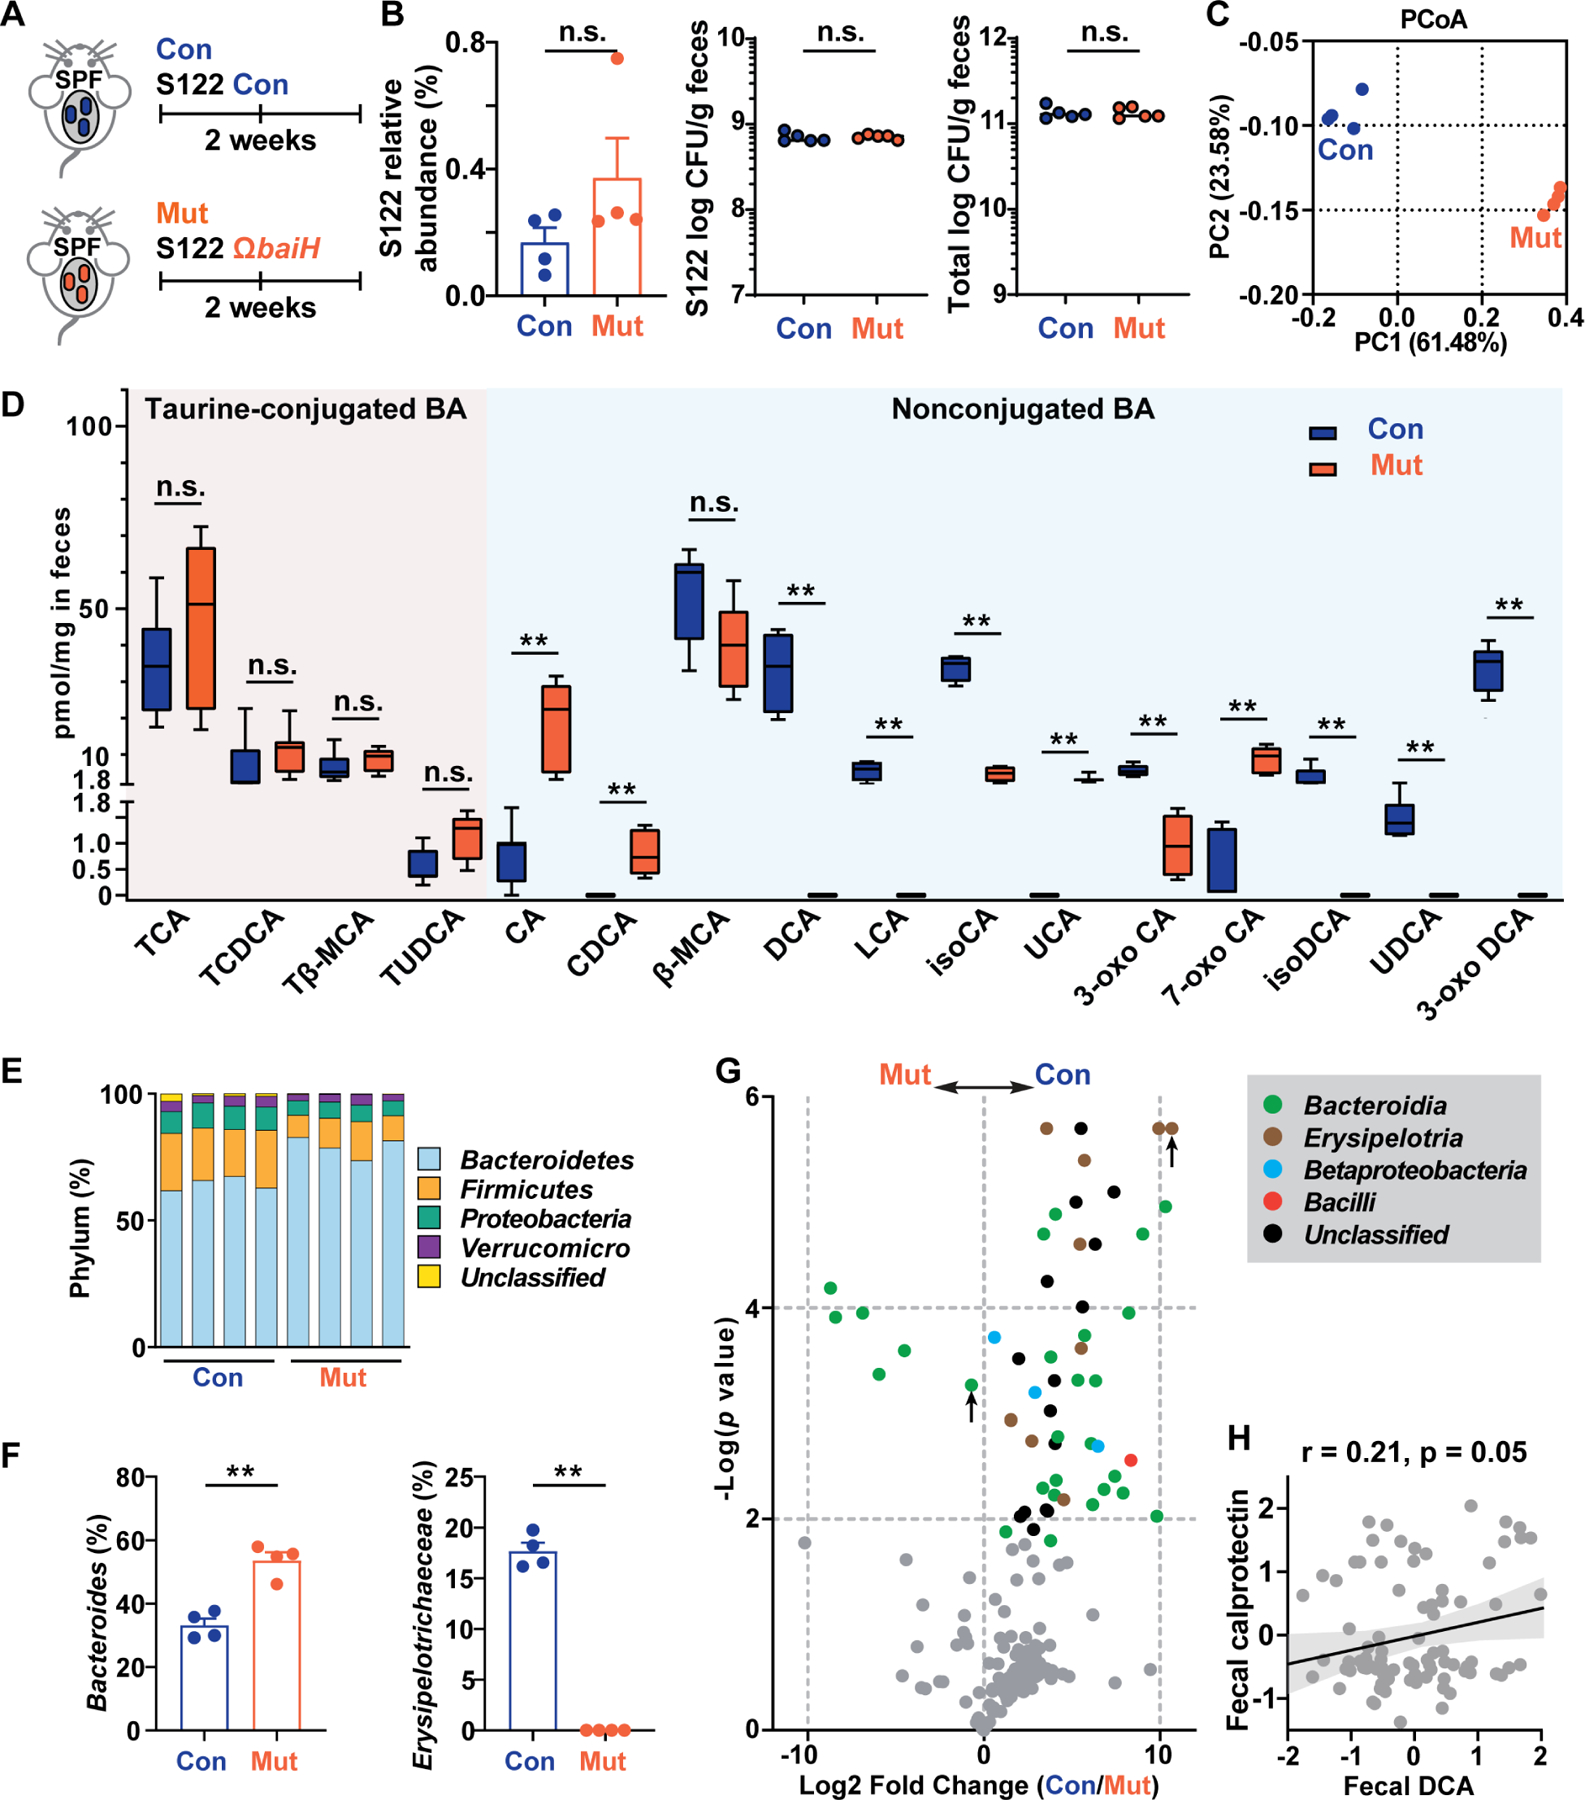
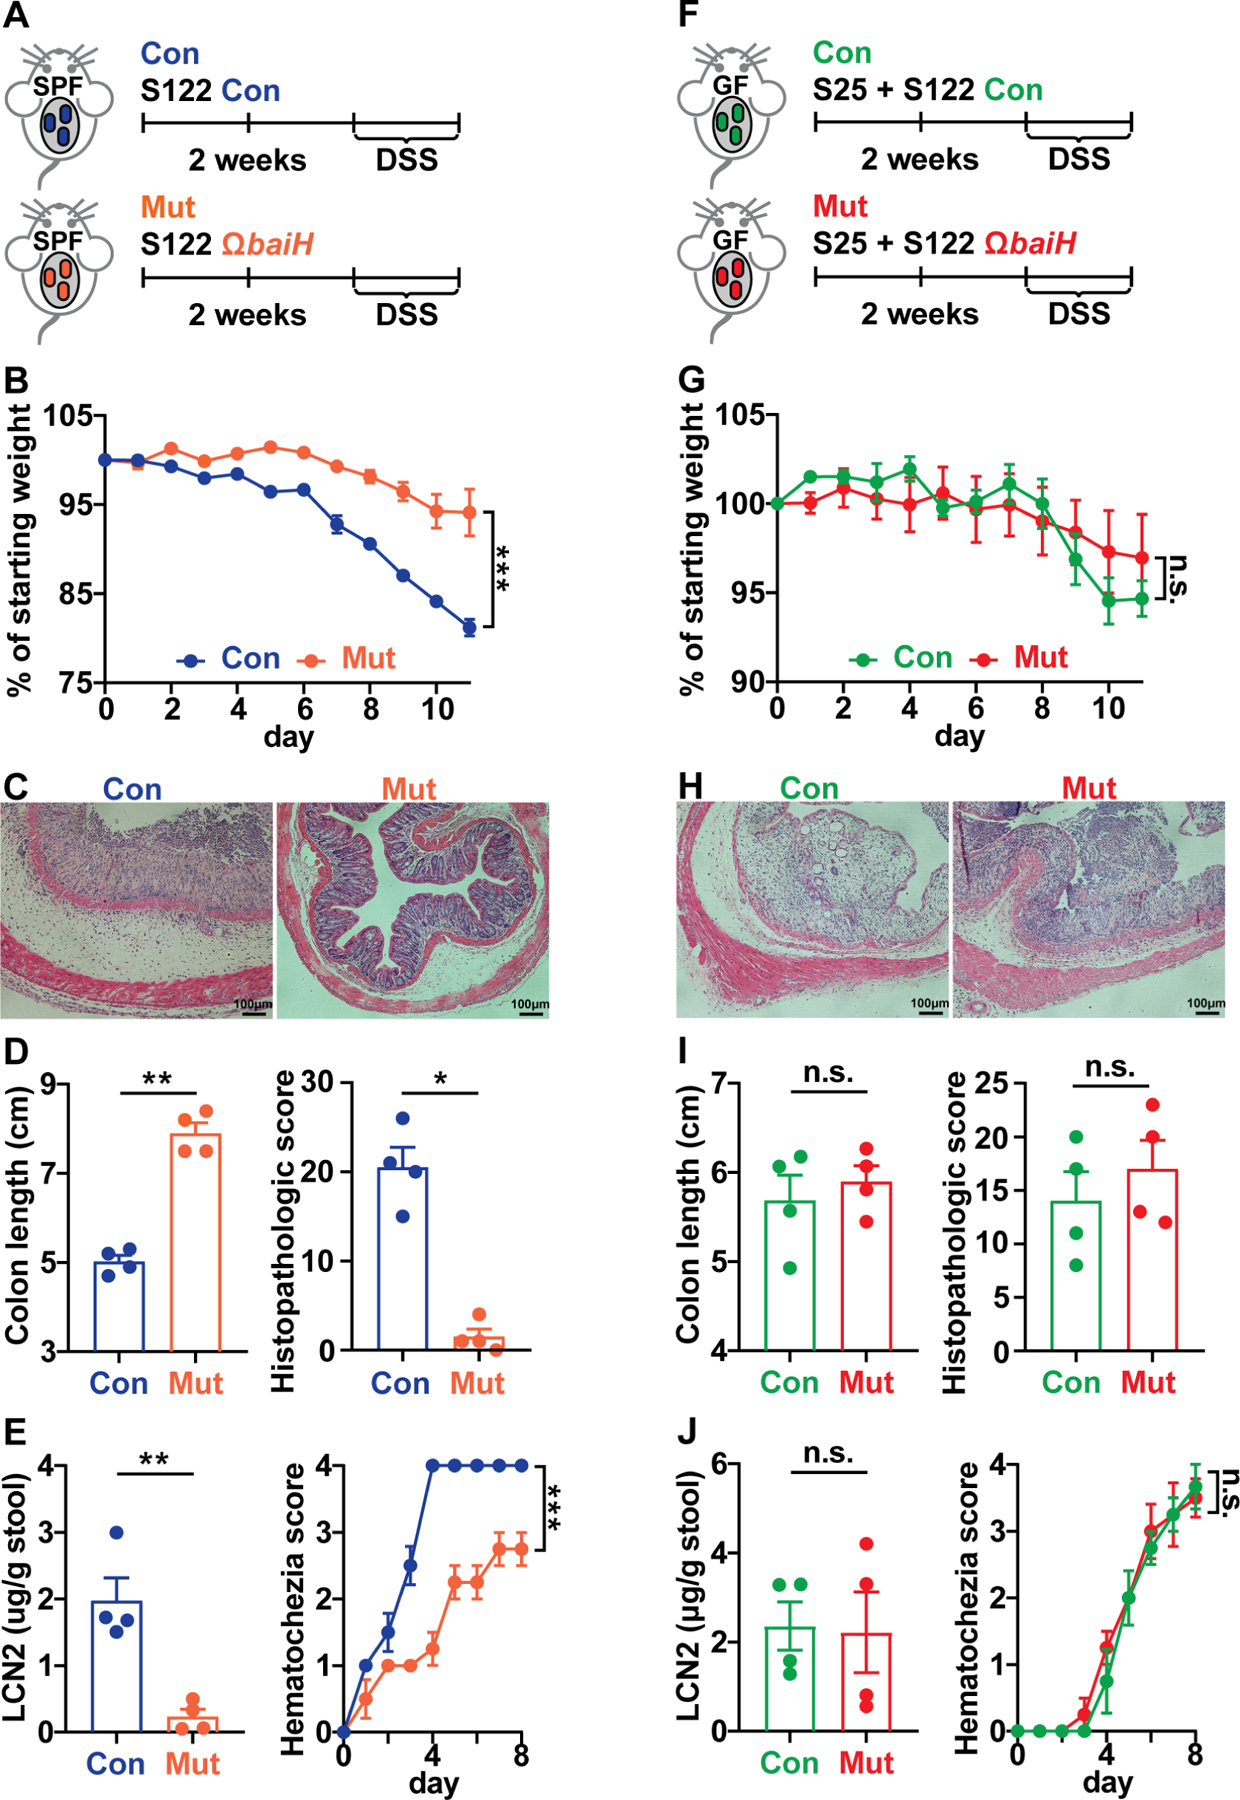
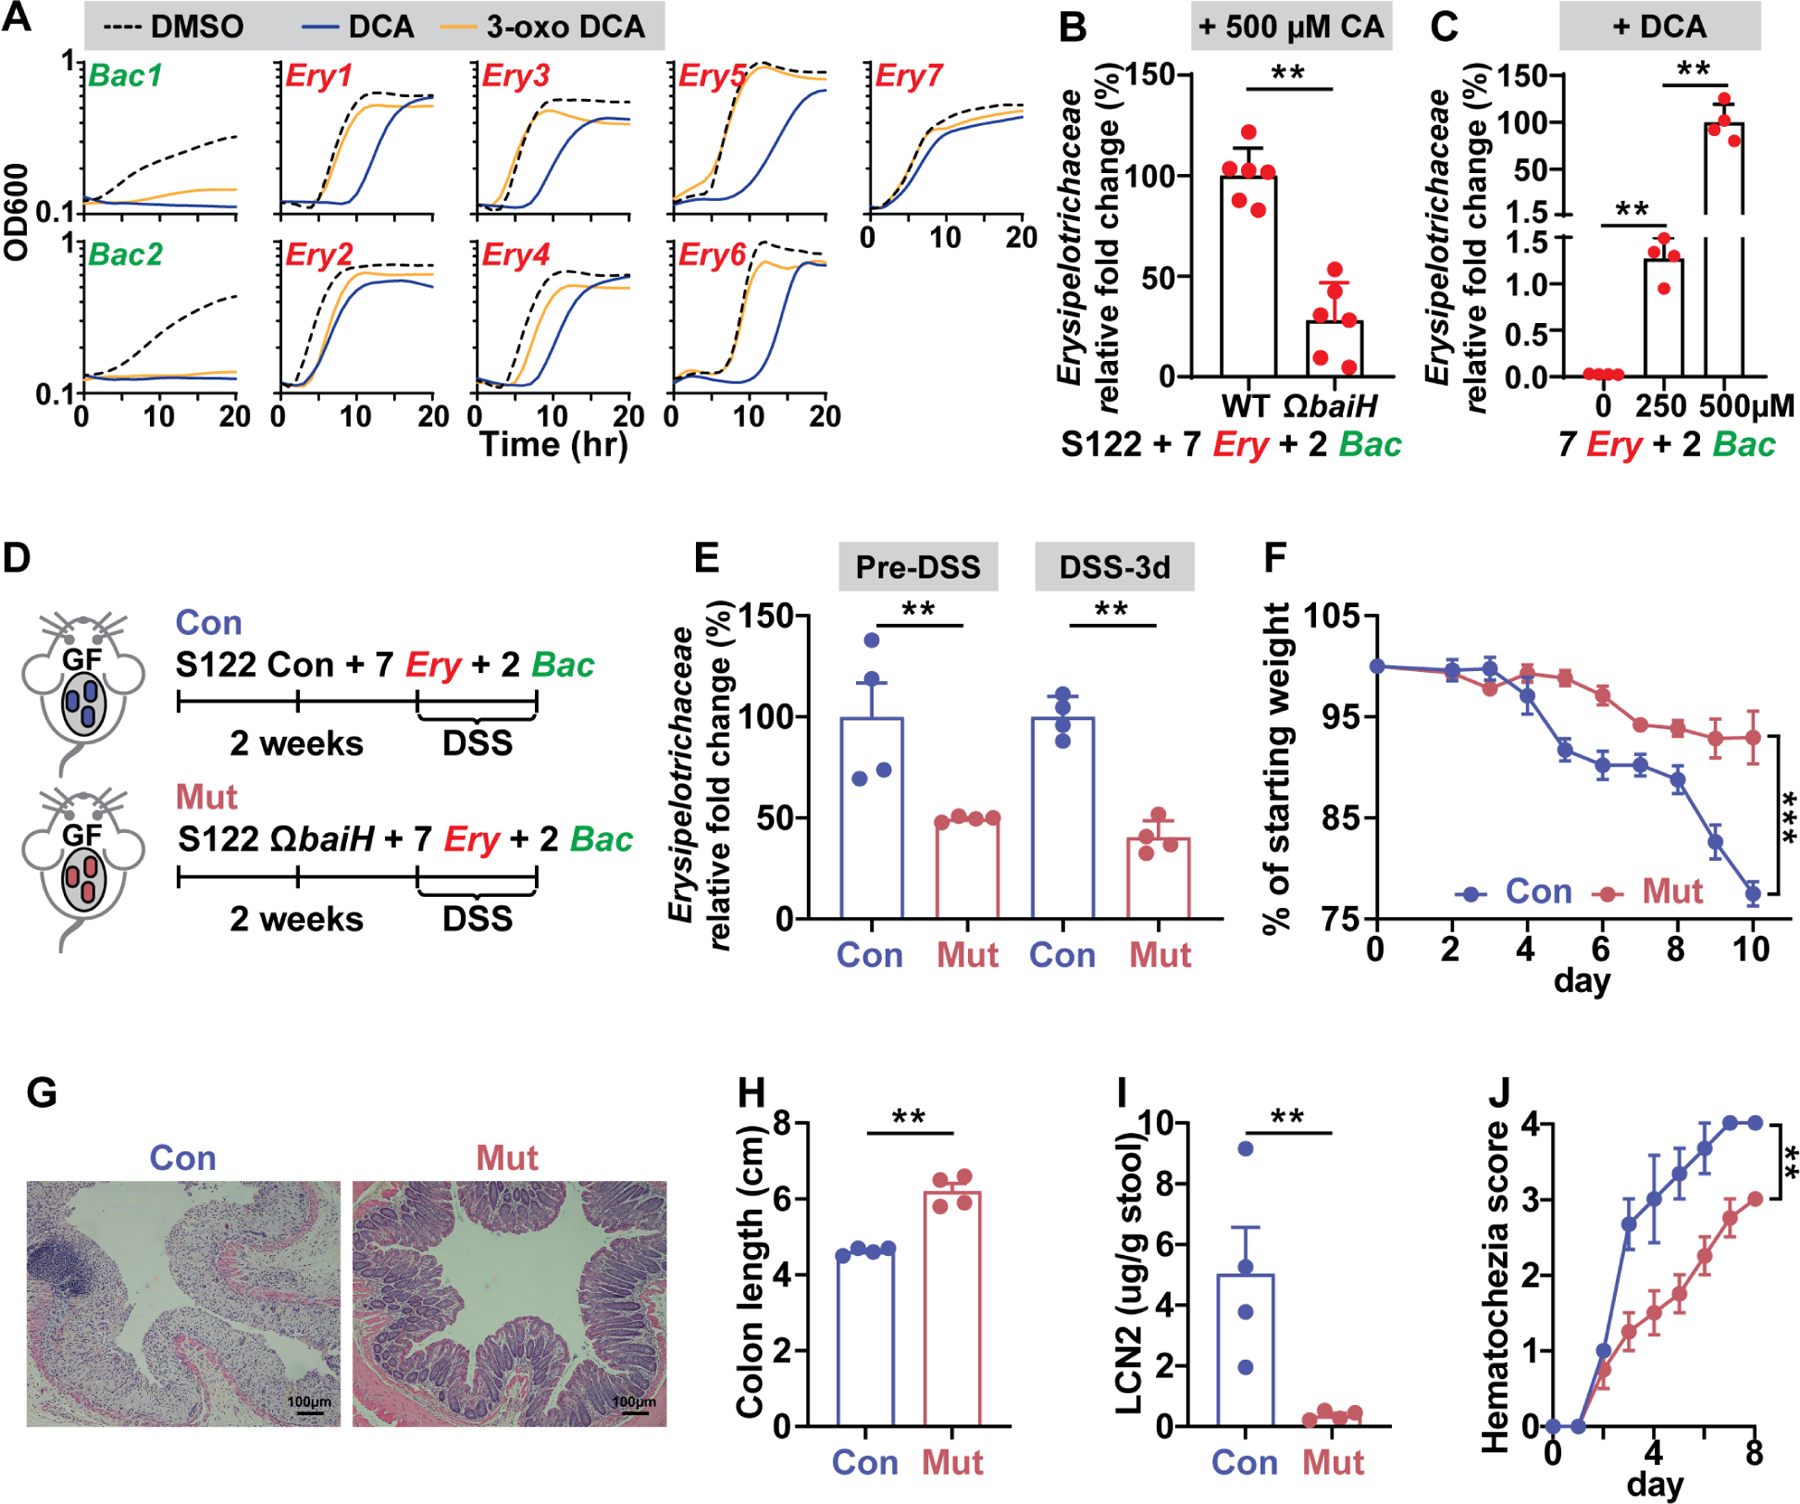
Hundreds of microbiota genes are associated with host biology/disease. Unraveling the causal contribution of a microbiota gene to host biology remains difficult because many are encoded by nonmodel gut commensals and not genetically targetable. A general approach to identify their gene transfer methodology and build their gene manipulation tools would enable mechanistic dissections of their impact on host physiology. We developed a pipeline that identifies the gene transfer methods for multiple nonmodel microbes spanning five phyla, and we demonstrated the utility of their genetic tools by modulating microbiome-derived short-chain fatty acids and bile acids in vitro and in the host. In a proof-of-principle study, by deleting a commensal gene for bile acid synthesis in a complex microbiome, we discovered an intriguing role of this gene in regulating colon inflammation. This technology will enable genetically engineering the nonmodel gut microbiome and facilitate mechanistic dissection of microbiota-host interactions.

Keywords: Firmicutes/Clostridia; bile acid metabolism; colitis; complex gut microbiome; genetic manipulation tools; host-microbe interactions; nonmodel gut microbes.


Conflict of interest statement

Declaration of interests D.A. has contributed to scientific advisory boards at Genentech, Pfizer, Takeda, FARE, and the KRF. The other authors declare no competing interests. A provisional patent application has been filed by the Weill Cornell Center for Technology Licensing based on this work.

Figures

Figure 1.
Figure 1.. Overview of the genetic manipulation (GM) pipeline for non-model gut commensals.
(A) A total of 200 human gut isolates from >140 species and 5 phyla were subject to the GM pipeline. The pipeline identifies gene transfer methods for 88 non-model gut microbes and build gene manipulation tools for 71 of them (Table S1). For Gram-negative gut microbes, identifying their gene transfer methods and building their gene insertion tools are achieved in one step via the chimeric-16S rRNA strategy. (B) Phylogenetic tree (colored by Family) of the 16S rRNA sequences from the genetically targetable microbes identified via the GM pipeline. (C) Detailed phylogenetic information of the genetically targetable microbes identified in this study. See also Tables S1 and S3.
Figure 2.
Figure 2.. Developing a genetic manipulation pipeline for non-model gut commensals.
(A) Schematic view of a multifactorial optimization of the conjugation/transformation parameters to identify gene transfer conditions for 38 non-model gut Firmicutes/Clostridia that are mostly untransformed. Please see STAR Methods for more details. (B) Establishment of a dCpf1-lacZα platform for non-model gut Firmicutes/Clostridia. (i) Schematic view of a dCpf1-lacZα system. The promoter and CDS region of lacZα are targeted by a duplex gRNA G1 and G2. (ii) The dCpf1-lacZα system efficiently suppresses lacZα expression in 25 Clostridia microbes. The panel shows the mean gene expression of three biological replicates as determined by qPCR. The dCpf-1-only and gRNA-only vectors are used as negative controls. Three qPCR results are shown. The numbering of the strains corresponds to the strain information shown in Table S1. Error bar: S.E.M. DR: direct repeat, G1: guide RNA-coding sequence 1, G2: guide RNA-coding sequence 2, Ter: terminator. (C) Schematic view of the 16S-tron strategy for non-model Clostridia. The Clostridia 16S rRNA sequences were aligned to identify a conserved target site of Group II intron. The 16S targeting Group II intron (16S-tron) was introduced into the targetable Clostridia commensals due to RAM (retrotransposition-activated marker) availability. We identified 15 Clostridia whose chromosomes have been integrated by the 16S-tron. (D) Schematic view of a Bacteroidia/Prevotella GM pipeline. The Prevotella 16S rRNA sequences were aligned to generate a ~1kb chimeric 16S (Chi-16S) fragment. The Chi-16S was assembled to get a suicide vector pGM-NAC2P. The pGM-NAC2P (NAC2B for Bacteroides) was conjugated to multiple Prevotella, Bacteroides, and Parabacteroides commensals targeting their chromosomal 16S rRNA genes (Table S1). We identified 31 targetable Bacteroidia whose 16S rRNA genes have been integrated by pGM-NAC2P (or NAC2B) (Table S1). See also Tables S1 and S2, and Figures S1 and S2.
Figure 3.
Figure 3.. Modulating Clostridia gene expression and microbiome-derived metabolites using gene manipulation tools developed via the GM pipeline.
(A) (i) Schematic view of a duplex gRNA targeting the branched-chain amino acid aminotransferase bcat in the Clostridia commensals. (ii) The bcat gene of 11 Clostridia microbes was efficiently repressed using dCpf1. The panel shows the mean gene expression of three biological replicates as determined by qPCR. Only three representative results (S54, S74, and S110, Table S1) are shown. (B) (i) Schematic view of knocking out the Bacteroides mmdA genes using pGM vectors. The pMG vector was assembled with ~1kb fragment of the mmdA genes, and the mmdA genes of three Bacteroides microbes were knocked out via single crossover integration. (ii) Three Bacteroides ΔmmdA mutants (S25, S27, and S31, Table S1) deplete propionate in vitro. The bacterial culture supernatant was derivatized and propionate production was examined using LC-MS (EIC: 216.1137). The Bacteroides ΔmmdA mutant depletes propionate in vivo. Germ-free Swiss Webster mice (n = 3 or 4 per group) were mono-colonized with the S25 control strain (Con, 16S integrated by pGM-NAC2B) and ΔmmdA mutant (Mut). Propionate was depleted in the host by mmdA deletion. Student’s T-test was performed, and the asterisk indicates p-value < 0.05 (*) or < 0.01 (**). Error bar: standard deviation. (C) (i) Schematic view of modulating butyrate production in the Clostridia commensals using dCpf1 or Group II intron. (ii) The butyrate production (quantified by LC-MS) was significantly reduced in three Clostridia microbes S100 (by dCpf1), S115 (by Group II intron), and S117 (by dCpf1) (Table S1). The fecal butyrate (quantified by LC-MS) in the germ-free Swiss Webster mice mono-colonized with S117 mutant (Mut, dCpf1+gRNAs) is significantly lower compared to the control (Con, dCpf1 only). Student’s T-test was performed, and the asterisk indicates p-value < 0.05 (*) or < 0.01 (**). Error bar: standard deviation. (D) In vitro and in vivo depletion of branched short-chain fatty acids (BSCFAs) by S107 using CRISPR-dCpf1. (i) Schematic view of targeting the BSCFAs gene porA using CRISPR-dCpf1. The dCpf1 gRNA (G1) targets the porA promoter region. (ii) The porA expression (by qPCR) is significantly reduced in the mutant (Mut, dCpf1 with gRNA) compared to the control (Con, dCpf1 only) in vitro. Germ-free Swiss Webster mice (n = 4 per group) mono-associated with porA repression mutant have much less isovalerate (quantified by LC-MS) in their feces than the control (dCpf1 only). Student’s T-test was performed, and the asterisk indicates p-value < 0.05 (*) or < 0.01 (**). Error bar: S.E.M. For (A), (C), and (D), DR: direct repeat, G1: guide RNA-coding sequence 1, G2: guide RNA-coding sequence 2, Ter: terminator. The numbering of the strains corresponds to the strain information shown in Table S1. See also Table S1 and Figure S3.
Figure 4.
Figure 4.. Knocking out baiH in gnotobiotic mice.
(A) The orientation of the S122 bai operon for bile acid 7α-dehydroxylation. The mutated gene baiH (by Group II intron) is highlighted in red. The S122 bai operon is actively transcribed under host colonization, and three representative results of metatranscriptomic analyses of the S122 bai operon are shown. (B) The biosynthetic scheme of bile acid 7α-dehydroxylation. The baiH encodes an oxidoreductase that reduces the 6,7-olefinic bond of the intermediate 3-oxo-4,5–6,7-didehydro-DCA (2, EIC: 385.2384). The S122 ΩbaiH mutant accumulates the predicted intermediate (2, EIC: 385.2384) and no longer converts CA (1, EIC: 407.2803) to DCA (3, EIC: 391.2854) in vitro. The structure of the intermediate (2) was determined by comparing its retention time and exact mass to the published literature. The asterisk indicates a residual amount of DCA that is a contaminant from the CA chemical standard. EIC: extracted ion chromatogram. (C) Germ-free C57BL/6J mice (n = 3 or 4 per group) were co-colonized with S25 plus the S122 control (Con) or ΩbaiH mutant (Mut) (by Group II intron) strain. The relative abundances of S122 in the control and mutant group were assessed by 16S rRNA sequencing and were comparable. (D) Depleting baiH using Group II intron abolishes gut 7α-dehydroxylating activity and modifies gut bile acid pool in gnotobiotic mice. CA, DCA, and 7-oxo CA (see Data S1E for their structures) were quantified using LCMS. Data in (C) and (D) were analyzed using unpaired two-tailed Student’s T-test. The asterisk indicates p-value < 0.05 (*) or < 0.01 (**). The numbering of the strains corresponds to the strain information shown in Table S1. See also Table S1 and Figure S4.
Figure 5.
Figure 5.. Knocking out baiH in the context of a complex microbiota impacts the host bile acid pool and the gut microbiome.
(A) SPF C57BL/6J mice (n = 4 or 5 per group) given low dose antibiotic water (15 μg/ml thiamphenicol and 10 μg/ml erythromycin) were colonized with genetically tagged S122 control (Con) or ΩbaiH mutant (Mut) (by Group II intron) strain. (B) The relative abundances of S122 in the control and mutant group were assessed by 16S rRNA sequencing and were comparable. The SPF mice are stably colonized with S122 control (Con) and the ΩbaiH mutant (Mut) at about the same level with a comparable total bacterial load. (C) Principal coordinates analysis (PCoA) of the fecal microbiome of the control and ΩbaiH mutant mice. (D) Targeted metabolomics analyses (quantified by LC-MS) of the stool bile acid (BA) compositions of the control (Con) and ΩbaiH mutant (Mut) colonized SPF mice. (E) The relative abundance of taxonomic phyla in the gut microbiota of the control and ΩbaiH mutant mice. (F) Relative abundances of inflammation-associated gut microbial taxa in the stool microbiome of the control and ΩbaiH mutant mice. (G) Volcano plot of differential bacterial OTU abundances calculated from 16S rRNA gene sequencing. Significantly different OTUs (n= 56, FDR < 0.05) are colored and plotted. The Bacteroidia OTU and Erysipelotrichaceae OTU with high relative abundances (>10%) are marked with an upward pointing arrow. (H) Gut 7α-dehydroxylating activity is weakly associated with fecal calprotectin level in nonIBD people. In (B), (D), and (F), data were analyzed using unpaired two-tailed Student’s T-test, and the asterisk indicates p-value < 0.01 (**). The data in (C), (E), (F), and (G) are representative of two independent experiments with n =4 or 5 per group, and only the changes in taxonomic groups that are consistent between the two experiments are shown. Data are shown as mean ± SEM. The numbering of the strains corresponds to the strain information shown in Table S1. See also Tables S1 and S4, and Figure S5.
Figure 6.
Figure 6.. baiH modulates intestinal inflammation in the context of complex gut microbiota.
(A, F) DSS-induced murine colitis model was applied to the SPF or gnotobiotic mice colonized with the genetically tagged S122 control (Con) and ΩbaiH mutant (Mut). Mice were colonized with the control or mutant strain for at least two weeks before giving DSS, SPF mice were given 2.5% DSS (in water supplemented with 15 μg/ml thiamphenicol and 10 μg/ml erythromycin) for 8 days, and gnotobiotic mice were given 2.0% DSS (in water supplemented with 15 μg/ml thiamphenicol) for 7 days. The disease state was monitored by weight loss (B, G), hematoxylin and eosin (H&E) staining of the distal colon (C, H), colon shortening, and histopathologic score (D, I), and fecal lipocalin-2 and daily hematochezia score (E, J). Data shown in (B-E, G-J) are representations of n = 4 to 5 mice per group replicated in two or more independent experiments. In (B, G), % of starting weight was calculated by normalizing weights at sacrifice to starting weight. In (D, I) and (E, J), colon length and LCN2 data were analyzed using unpaired two-tailed Student’s T-test. In (B, G) and (E, J), % of starting weight and hematochezia score data were analyzed using Two-way ANOVA followed by the Bonferroni post hoc test (n=4). In (D, I), histopathologic score data were analyzed using the Mann-Whitney test. Data are shown as mean ± SEM. The asterisk indicates p-value < 0.05 (*), < 0.01 (**) or < 0.001 (***). The numbering of the strains corresponds to the strain information shown in Table S1. See also Table S1 and Figure S6.
Figure 7.
Figure 7.. The baiH-mediated microbiota composition shift exacerbates DSS-induced colitis in gnotobiotic mice.
(A) The growth curve of two Bacteroides (bac) microbes and seven Erysipelotrichaceae (Ery) microbes in the presence of 500 μM DCA, 500 μM 3-oxo DCA, or DMSO control. The Erysipelotrichaceae microbes are more resistant to DCA and 3-oxo DCA than the Bacteroides microbes. (B) The baiH gene drives expansion of Erysipelotrichaceae microbes in an in vitro consortium consisting of 2 Bacteroides (Bac) and 7 Erysipelotrichaceae microbes (Ery) with either the S122 control or ΩbaiH strain. 500 µM CA was supplemented as the substrate for the bai pathway. The relative fold change of Erysipelotrichaceae was assessed by qPCR. (C) DCA drives expansion of Erysipelotrichaceae microbes in an in vitro consortium consisting of 2 Bacteroides (Bac) microbes and 7 Erysipelotrichaceae (Ery) microbes. DCA was supplemented at 0, 250, and 500 µM, respectively. The relative fold change of Erysipelotrichaceae was assessed by qPCR. (D) DSS-induced murine colitis model was applied to the gnotobiotic mice colonized with a synthetic consortium consisting of the genetically tagged S122 control (Con) or ΩbaiH mutant (Mut) (by Group II intron) along with 2 Bacteroides (Bac) microbes and 7 Erysipelotrichaceae (Ery) microbes tested in (A), (B), and (C). Mice were colonized with the control or mutant strain for at least two weeks followed by 2.5% DSS for 8 days. (E) The baiH gene drives expansion of Erysipelotrichaceae microbes in the context of host colonization before and during DSS treatment assessed by qPCR. The disease state was monitored by weight loss (F), hematoxylin and eosin (H&E) staining of the distal colon (G), colon shortening (H), fecal lipocalin-2 (I), and daily hematochezia score (J). The data in (A to C) are from a representative experiment with three technical replicates (A), or with six or four biological replicates (B, C). Data shown in (F, H, I, J) are representations of n = 4 mice per group replicated in two or more independent experiments. In (F), % of starting weight was calculated by normalizing weights at sacrifice to starting weight. In (H) and (I), colon length and LCN2 data were analyzed using unpaired two-tailed Student’s T-test. In (F) and (J), % of starting weight and hematochezia score data were analyzed using Two-way ANOVA followed by the Bonferroni post hoc test (n=4). Data are shown as mean ± SEM. The asterisk indicates p-value < 0.05 (*), < 0.01 (**) or < 0.001 (***). The numbering of the strains corresponds to the strain information shown in Table S1. See also Table S1 and Figure S7.

Comment in

References

    1. Arab JP, Karpen SJ, Dawson PA, Arrese M, and Trauner M (2017). Bile acids and nonalcoholic fatty liver disease: Molecular insights and therapeutic perspectives. Hepatology 65, 350–362. - PMC - PubMed
    1. Bencivenga-Barry NA, Lim B, Herrera CM, Stephen Trent M, and Goodman AL (2020). Genetic manipulation of wild human gut Bacteroides. Journal of Bacteriology 202. - PMC - PubMed
    1. Blander JM, Longman RS, Iliev ID, Sonnenberg GF, and Artis D (2017). Regulation of inflammation by microbiota interactions with the host. Nature Immunology 18, 851–860. - PMC - PubMed
    1. Buffie CG, Bucci V, Stein RR, McKenney PT, Ling L, Gobourne A, No D, Liu H, Kinnebrew M, Viale A, et al. (2015). Precision microbiome reconstitution restores bile acid mediated resistance to Clostridium difficile. Nature 517, 205–208. - PMC - PubMed
    1. Campbell C, McKenney PT, Konstantinovsky D, Isaeva OI, Schizas M, Verter J, Mai C, Jin WB, Guo CJ, Violante S, et al. (2020). Bacterial metabolism of bile acids promotes generation of peripheral regulatory T cells. Nature 581, 475–479. - PMC - PubMed

Publication types

MeSH terms

LinkOut - more resources