. 2022 Feb;298(2):101593.
doi: 10.1016/j.jbc.2022.101593. Epub 2022 Jan 17.

The yapsin family of aspartyl proteases regulate glucose homeostasis in Candida glabrata

Affiliations

The yapsin family of aspartyl proteases regulate glucose homeostasis in Candida glabrata

Fizza Askari et al. J Biol Chem. 2022 Feb.

Abstract

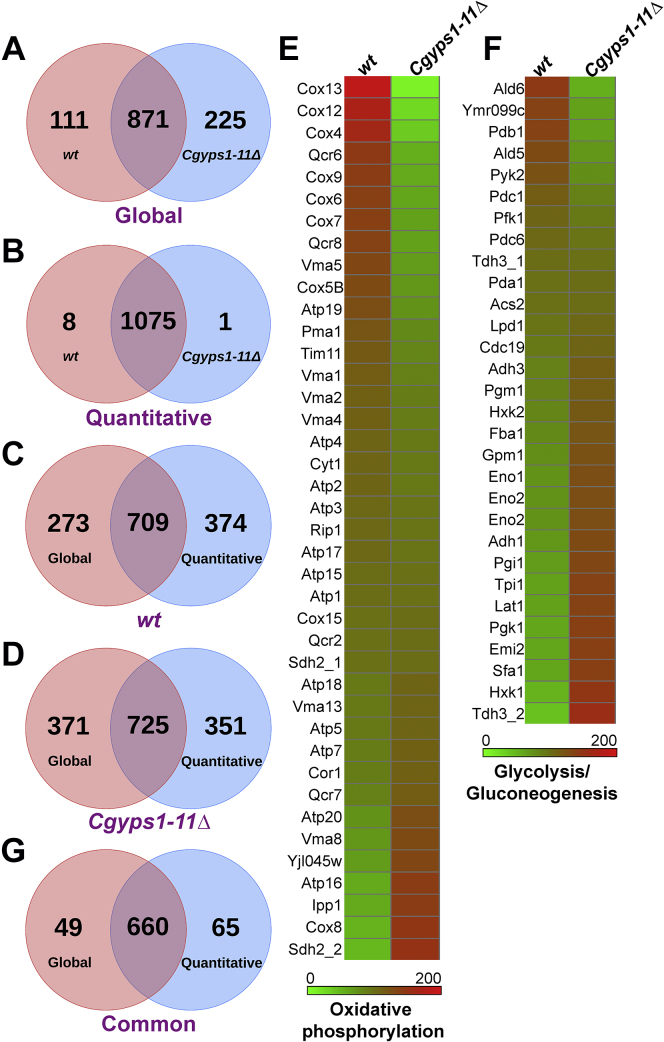
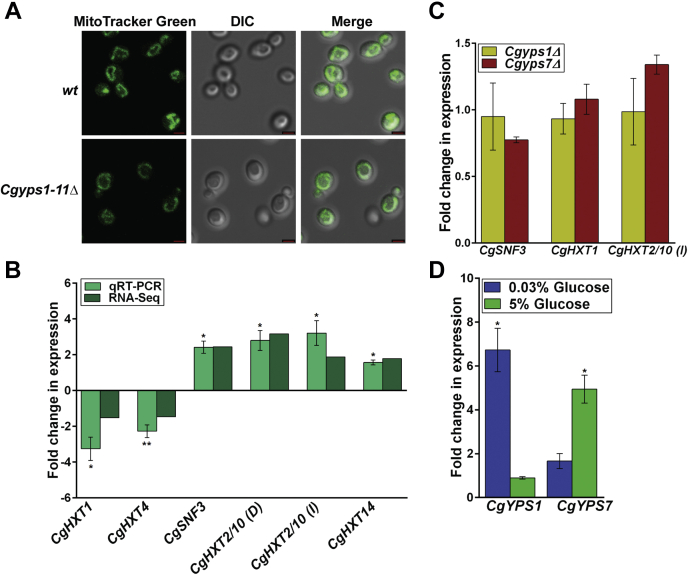
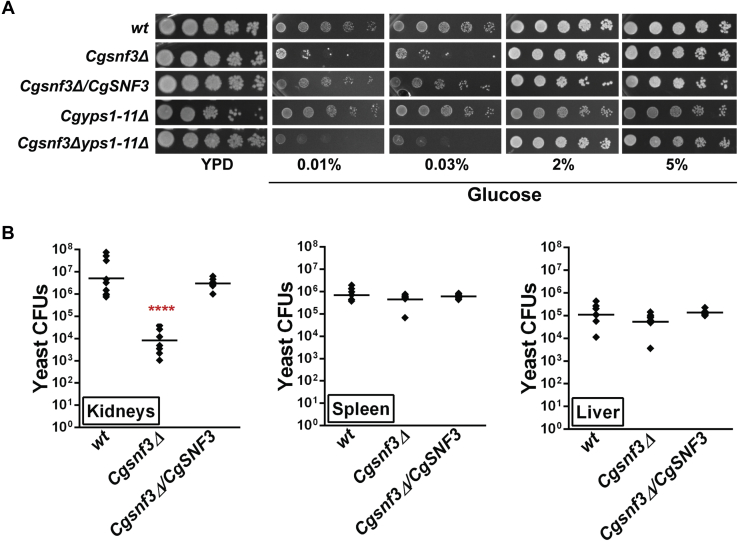
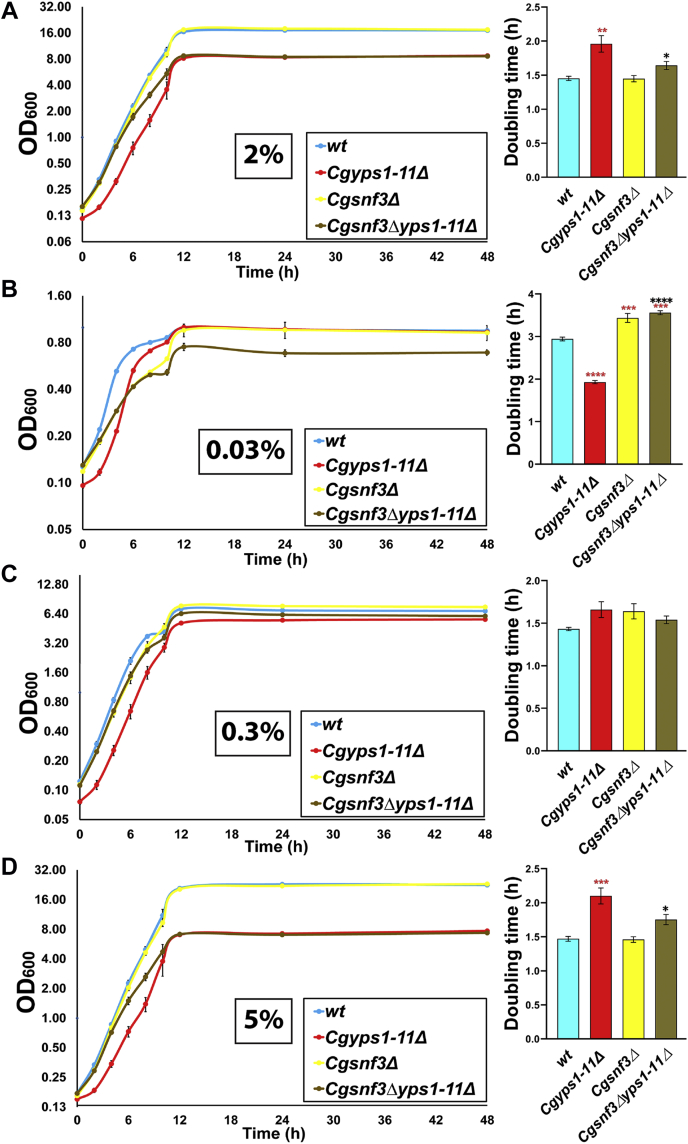
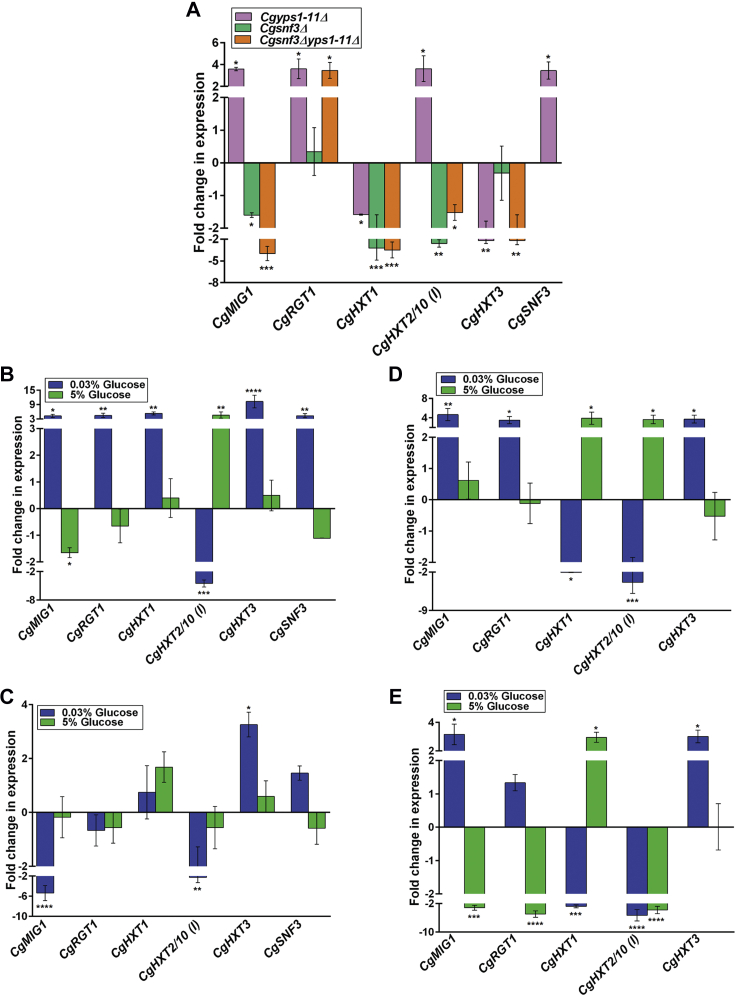
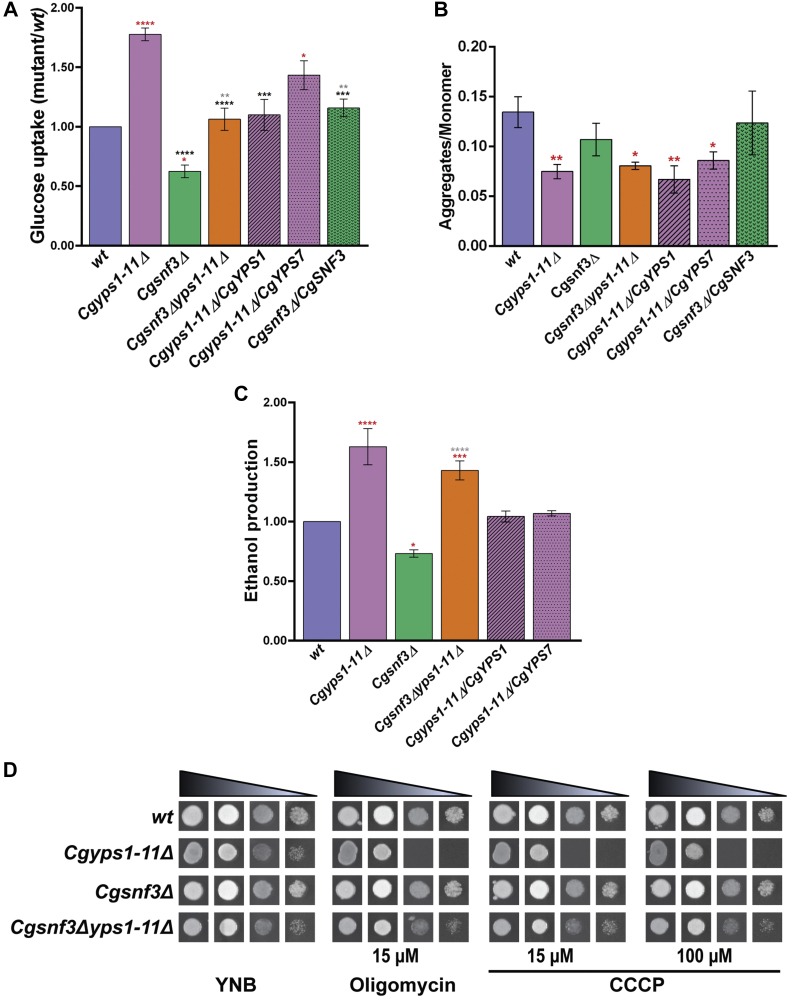
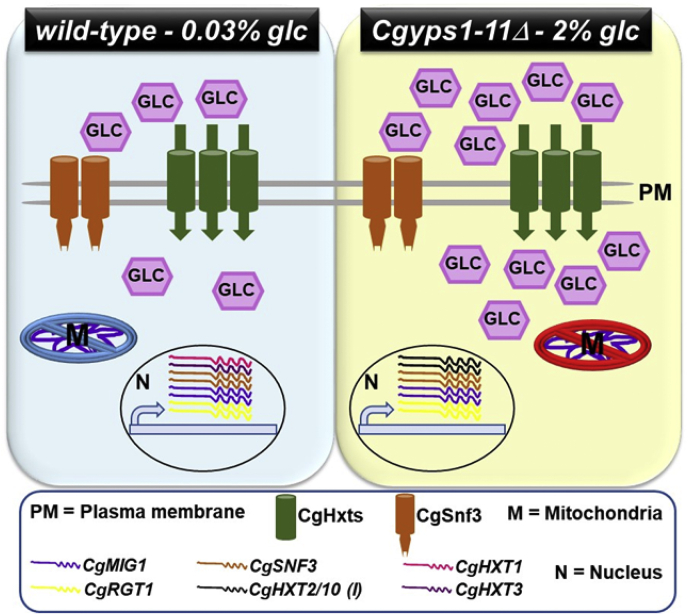
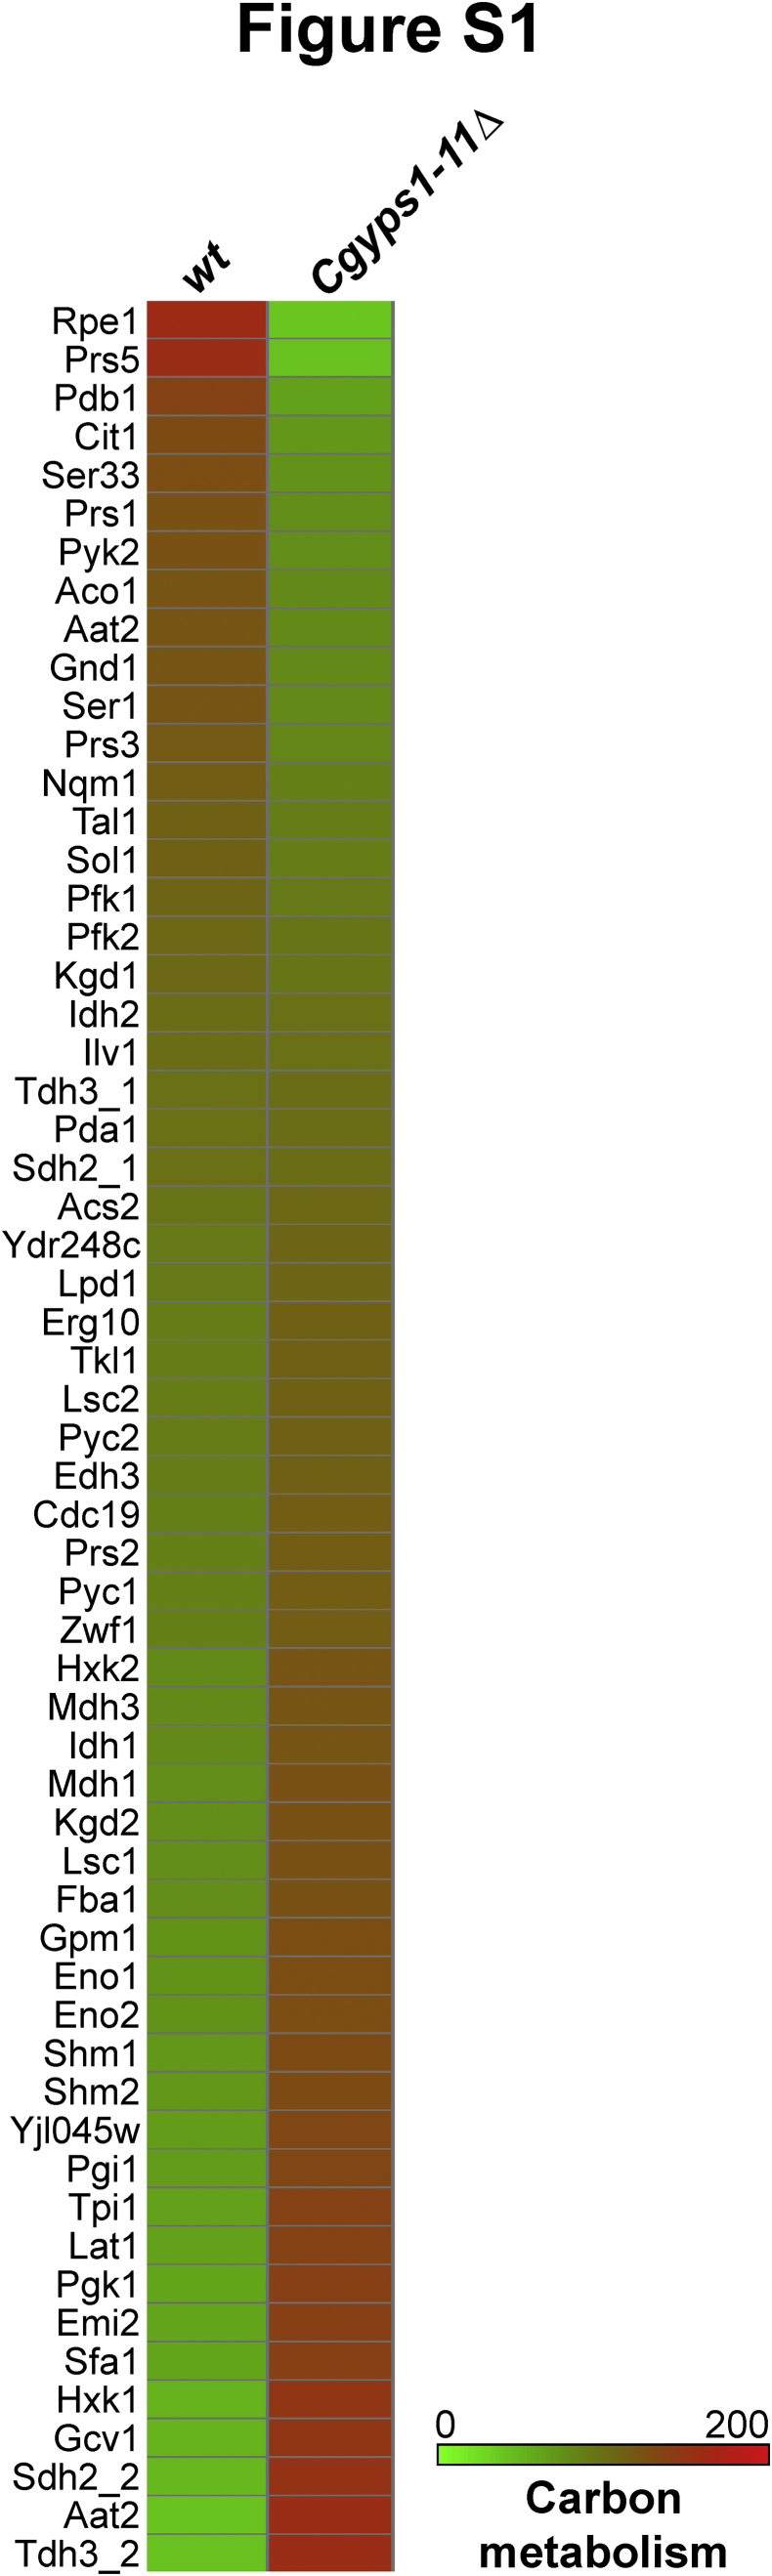
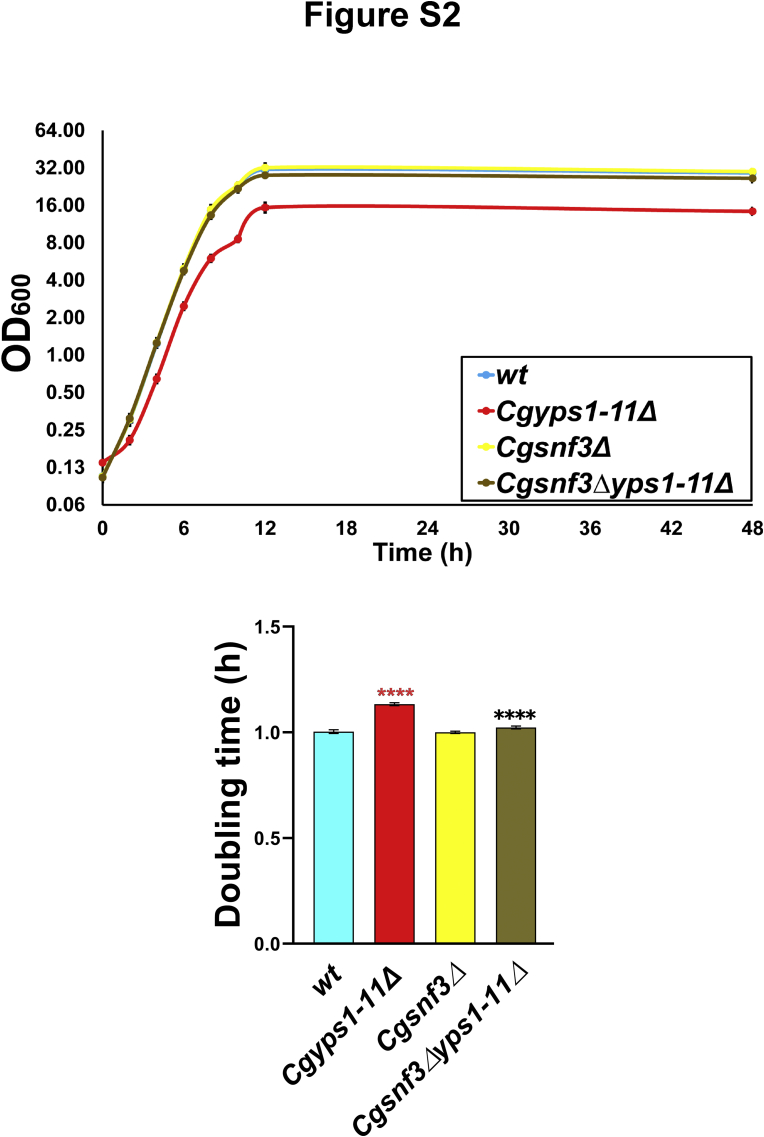
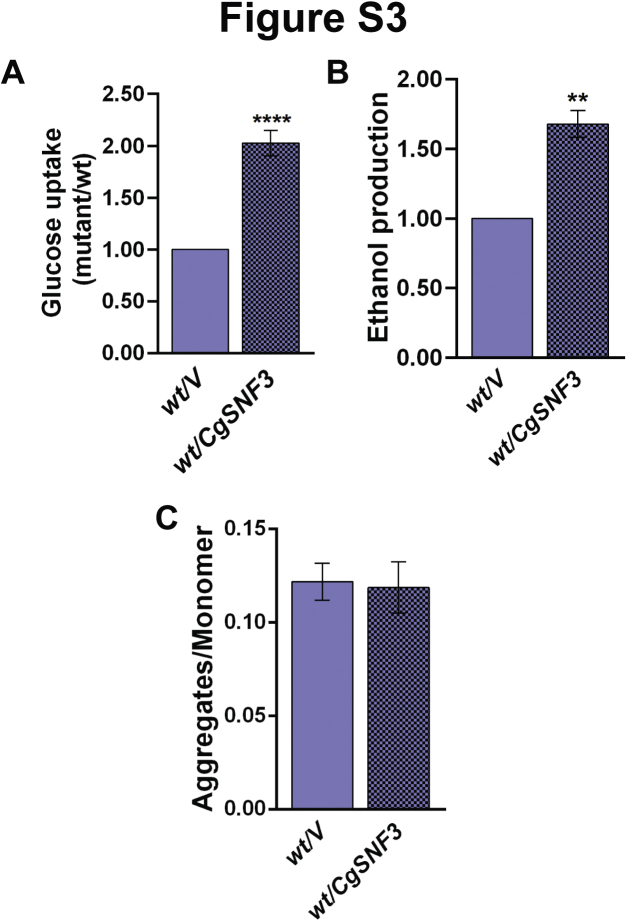
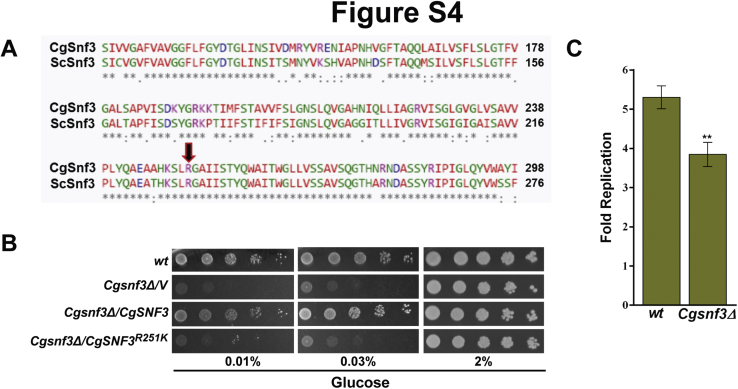
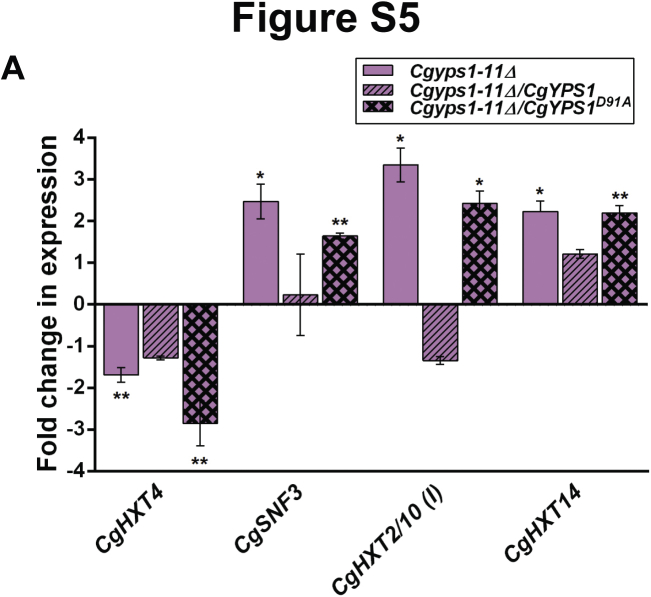
Invasive candidiasis poses a major healthcare threat. The human opportunistic fungal pathogen Candida glabrata, which causes mucosal and deep-seated infections, is armed with distinct virulence attributes, including a family of 11 glycosylphosphatidylinositol-linked aspartyl proteases, CgYapsins. Here, we have profiled total membrane proteomes of the C. glabrata wildtype and 11 proteases-deficient strain, Cgyps1-11Δ, by mass spectrometry analysis and uncovered a novel role for fungal yapsins in glucose sensing and homeostasis. Furthermore, through label-free quantitative membrane proteome analysis, we showed differential abundance of 42% of identified membrane proteins, with electron transport chain and glycolysis proteins displaying lower and higher abundance in Cgyps1-11Δ cells, compared with wildtype cells, respectively. We also demonstrated elevated glucose uptake and upregulation of genes that code for the low-glucose sensor CgSnf3, transcriptional regulators CgMig1 and CgRgt1, and hexose transporter CgHxt2/10 in the Cgyps1-11Δ mutant. We further elucidated a potential underlying mechanism through genetic and transcript measurement analysis under low- and high-glucose conditions and found CgSNF3 deletion to rescue high glucose uptake and attenuated growth of the Cgyps1-11Δ mutant in YPD medium, thereby linking CgYapsins with regulation of the CgSnf3-dependent low-glucose sensing pathway. Last, high ethanol production, diminished mitochondrial membrane potential, and elevated susceptibility to oxidative phosphorylation inhibitors point toward increased fermentative and decreased respiratory metabolism in the Cgyps1-11Δ mutant. Altogether, our findings revealed new possible glucose metabolism-regulatory roles for putative cell surface-associated CgYapsins and advanced our understanding of fungal carbohydrate homeostasis mechanisms.

Keywords: GPI-linked aspartyl proteases; aspartic protease; glucose; glucose sensing and uptake; hexose transporters; high-affinity glucose sensor Snf3; human pathogenic fungi; membrane proteome; proteomics; respiration.


Conflict of interest statement

Conflict of interest The authors declare that they have no conflict of interest with the contents of this article.

Figures

Figure 1
Figure 1
Global membrane proteome analysis of C. glabrata wildtype and Cgyps1-11Δ strains.A, Venn diagram illustrating overlap between proteins identified in global membrane proteomes of wildtype (wt) and Cgyps1-11Δ strains. B, Venn diagram illustrating overlap between proteins identified in quantitative membrane proteomes of wt and Cgyps1-11Δ strains. C, Venn diagram illustrating overlap between proteins identified in global and quantitative membrane proteomes of the wt strain. D, Venn diagram illustrating overlap between proteins identified in global and quantitative membrane proteomes of the Cgyps1-11Δ mutant. E and F, heat map depicting abundance of proteins identified by quantitative membrane proteome profiling that belong to oxidative phosphorylation (E) and glycolysis/gluconeogenesis (F). Please note that CAGL0C03223g and CAGL0E03850g are labeled as Sdh2_1 and Sdh2_2, respectively, in E, and CAGL0G09383g and CAGL0J00451g are labeled as Tdh3_1 and Tdh3_2, respectively, in F. G, Venn diagram illustrating overlap between proteins identified in wt and Cgyps1-11Δ strains by both global and quantitative membrane proteome profiling.
Figure 2
Figure 2
Glucose sensing and transport genes are deregulated in the Cgyps1-11Δ mutant.A, MitoTracker Green–based mitochondrial morphology analysis. Representative maximum-intensity projection of Z-stack fluorescence confocal images showing mitochondrial network in YNB medium–grown, MitoTracker Green (100 nM)–stained log-phase cells of wt and Cgyps1-11Δ strains. The scale bar represents 2 μm. B, qRT-PCR-based expression analysis of indicated genes (two downregulated and four upregulated genes in the RNA-Seq experiment) in wt and Cgyps1-11Δ strains. Strains were grown to log-phase in YPD medium for 4 h, followed by RNA extraction using acid phenol. The cDNA synthesis reaction was set up with 500 ng total RNA, followed by qRT-PCR using appropriate primer sets, and gene transcript levels were measured using the 2−ΔΔCt method. Please note that CgHXT2/10 (D) and CgHXT2/10 (I) refer to CAGL0D02640g/CAGL0D02662g and CAGL0I00286g genes, respectively. Data (mean ± SEM, n = 3–4) were normalized against CgACT1 mRNA control and represent fold change in expression in Cgyps1-11Δ cells, compared with wt cultures (considered as 1.0). ∗p ≤ 0.05; ∗∗p ≤ 0.01, paired two-tailed Student's t test. C, qRT-PCR-based expression analysis of indicated genes in YPD medium–grown log-phase Cgyps1Δ and Cgyps7Δ cells. Data (mean ± SD, n = 2–3) were normalized against CgACT1 mRNA control and represent fold change in expression in Cgyps1Δ and Cgyps7Δ cells, compared with wt cultures (considered as 1.0). D, qRT-PCR-based expression analysis of CgYPS1 and CgYPS7 genes in log-phase wt cells that were grown in YNB medium containing low (0.03%), regular (2%), and high (5%) glucose for 2 h. Data (mean ± SEM, n = 3–4) were normalized against CgACT1 mRNA control and represent fold change in expression in low-glucose and high-glucose medium–grown wt cells, compared with regular-glucose medium–grown wt cells (considered as 1.0). ∗p ≤ 0.05, paired two-tailed Student's t test. DIC, differential interference contrast.
Figure 3
Figure 3
CgSNF3 is required for virulence.A, serial dilution spotting analysis of wt, Cgsnf3Δ, Cgsnf3Δ/CgSNF3, Cgyps1-11Δ, and Cgsnf3Δyps1-11Δ strains in YPD (2% dextrose) or YNB medium containing indicated glucose concentrations. C. glabrata cultures were grown overnight in casamino acid medium and normalized to A600 of 1.0. After diluting cultures 10-fold serially in PBS, 3 μl was spotted on YPD medium or YNB medium containing 0.01%, 0.03%, 2%, and 5% glucose. Plates were incubated at 30 °C, and images were captured after 2 days. B, colony-forming unit–based survival analysis of the Cgsnf3Δ mutant. C. glabrata strains (100 μl cell suspension; 4 × 107 cells) were infected into the tail vein of 6- to 8-week-old female BALB/c mice. After 7 days, mice were sacrificed and three organs (kidneys, liver, spleen) were collected and homogenized in PBS. The homogenates were diluted in PBS, and appropriate dilutions were plated on penicillin- and streptomycin-containing YPD medium. The colony-forming units (CFUs) recovered from each organ of the individual mouse are represented by diamonds in graphs. The horizontal line bars represent the CFU geometric mean (n = 7–9) for each organ. Statistically significant differences in CFUs between kidneys of wt- and Cgsnf3Δ-infected mice are marked. ∗∗∗∗p < 0.0001; Mann-Whitney U test.
Figure 4
Figure 4
CgSNF3 gene loss confers growth advantage to Cgyps1-11Δ cells in medium containing 2% glucose. Time course analysis of wt, Cgyps1-11Δ, Cgsnf3Δ, and Cgsnf3Δyps1-11Δ strains. C. glabrata strains were grown overnight in YPD medium and inoculated at an initial A600 of 0.1 in YNB medium containing 2% (A), 0.03% (B), 0.3% (C), and 5% (D) glucose. Cultures were incubated at 30 °C with continuous shaking (200 rpm), and absorbance was monitored at regular intervals till 48 h. The absorbance (A600) values are plotted against time, and the growth period, corresponding to the log-phase (between 2 and 6 h), was used to determine the doubling time. Data represent mean ± SEM (n = 3–4). The one-way ANOVA with Tukey’s test was employed to determine the statistical significance of doubling time differences between strains. Red and black asterisks denote differences in doubling time between wt and mutants, and Cgyps1-11Δ and Cgsnf3Δyps1-11Δ mutants, respectively. ∗p ≤ 0.05; ∗∗p ≤ 0.01; ∗∗∗p ≤ 0.001; ∗∗∗∗p ≤ 0.0001.
Figure 5
Figure 5
The response to extracellular glucose is impaired in the Cgyps1-11Δ mutant.A, qRT-PCR-based expression analysis of indicated genes in YNB medium–grown log-phase wt, Cgyps1-11Δ, Cgsnf3Δ, and Cgsnf3Δyps1-11Δ cells. Data (mean ± SEM, n = 3–4) were normalized against CgACT1 mRNA control and represent fold change in expression in mutant cells, compared with wt cultures (considered as 1.0). ∗p ≤ 0.05; ∗∗p ≤ 0.01; ∗∗∗p ≤ 0.001, one-way ANOVA with uncorrected Fisher’s LSD test. BE, qRT-PCR-based expression analysis of indicated genes in log-phase wt (B), Cgyps1-11Δ (C), Cgsnf3Δ (D), and Cgsnf3Δyps1-11Δ (E) cells that were grown in YNB medium containing low (0.03%), regular (2%), and high (5%) glucose for 2 h. Data (mean ± SEM, n = 3–4) were normalized against CgACT1 mRNA control and represent fold change in expression in low-glucose and high-glucose medium–grown cells, compared with regular-glucose medium–grown cells of each strain (considered as 1.0). ∗p ≤ 0.05; ∗∗p ≤ 0.01; ∗∗∗p ≤ 0.001; ∗∗∗∗p ≤ 0.0001, one-way ANOVA with uncorrected Fisher’s LSD test.
Figure 6
Figure 6
The Cgyps1-11Δ mutant displays higher glucose uptake.A, uptake of 2-NBDG ([2-N-(7-nitrobenz-2-oxa-1,3-diazol-4-yl) amino]-2-deoxy-D-glucose) in indicated C. glabrata strains, as determined by spectrofluorimetry. Glucose-starved cells were incubated with 2-NBDG (100 μM) for 1 h at 30 °C, and the fluorescence emission was recorded at 540 nm, under excitation at 465 nm. Data (mean ± SEM, n = 3–5) were normalized against the wt fluorescence values (considered as 1.0) and represent fold change in NBDG uptake in mutant strains, compared with the wt strain. Red asterisks denote differences in the glucose uptake between wt and indicated strains, black asterisks denote differences between Cgyps1-11Δ and indicated strains, and gray asterisks denote differences between Cgsnf3Δ and indicated strains. ∗p ≤ 0.05; ∗∗p ≤ 0.01; ∗∗∗p ≤ 0.001; ∗∗∗∗p ≤ 0.0001, one-way ANOVA with Tukey’s test. B, JC-1 dye–based assessment of mitochondrial membrane potential. Log-phase cells were stained with JC-1 (20 μM) dye and washed with PBS, and fluorescence of J-aggregates (red) and monomers (green) was recorded at 550 nm excitation/emission 600 nm and excitation/emission 485 nm/535 nm, respectively. The ratio of red fluorescence (J aggregates) to green fluorescence (monomer) was calculated for each strain and plotted. Data represent mean ± SEM (n = 3–4). Red asterisks denote differences between wt and indicated strains. ∗p ≤ 0.05; ∗∗p ≤ 0.01, one-way ANOVA with Tukey’s test. C, ethanol measurement in the culture broth. Ethanol in the culture medium of indicated strains was extracted using dibutyl phthalate, followed by potassium dichromate oxidation of ethanol. The amount of ethanol in the culture medium was calculated from the standard curve, and data (mean ± SEM, n = 3–5) were normalized against ethanol produced by the wt strain (considered as 1.0). Data represent fold change in ethanol production in mutant strains, compared with the wt strain. Red and gray asterisks denote uptake differences between wt and indicated strains, and Cgsnf3Δ and Cgsnf3Δyps1-11Δ mutants, respectively. ∗p ≤ 0.05; ∗∗∗p ≤ 0.001; ∗∗∗∗p ≤ 0.0001, one-way ANOVA with Tukey’s test. D, liquid medium–based growth analysis of wt, Cgyps1-11Δ, Cgsnf3Δ, and Cgsnf3Δyps1-11Δ strains in the presence of indicated inhibitors. Cultures were inoculated at an initial A600 of 0.25 and grown in medium lacking (YNB) or containing oligomycin (15 μM) and carbonyl cyanide m-chlorophenylhydrazone (CCCP; 15 and 100 μM). After 12 h, cultures were diluted in PBS, and 3 μl of undiluted and 10-, 100-, and 1000-fold-diluted cultures were spotted on YNB medium. Plates were incubated at 30 °C, and images were captured after 1 day.
Figure 7
Figure 7
A schematic illustration of key findings of the study. The loss of CgYapsins impairs the ability of C. glabrata cells to sense the external glucose concentration. The Cgyps1-11Δ mutant perceives the 2% glucose environment (YPD/YNB medium) as glucose-poor environment, which results in transcriptional activation of genes coding for CgSnf3 glucose sensor, CgMig1 and CgRgt1 transcription factors, and CgHxt2/10 (I) (CAGL0I00286p) hexose transporter, which possibly leads to higher glucose uptake and perturbed glucose homeostasis. Contrarily, wildtype cells respond to a low-glucose environment (0.03% glucose) by elevating the expression of CgSNF3, CgMIG1, CgRGT1, and CgHXT1 and CgHXT3 (code for hexose transporters) genes, which probably facilitates glucose import, and glucose homeostasis is maintained. Of note, CgHXT2/10 (I) is transcriptionally repressed in glucose-starved wildtype cells, whereas CgHXT1 and CgHXT3 genes are transcriptionally repressed in 2% glucose–grown Cgyps1-11Δ cells. In addition, proteins belonging to glycolysis and oxidative phosphorylation are over- and underrepresented, respectively, in total membrane proteome of the Cgyps1-11Δ mutant, as compared with the wt cells, which may contribute partly to depolarized mitochondria and elevated ethanol production in the mutant. Altogether, these data underscore a critical requirement for CgYapsins in glucose metabolism in C. glabrata.
Supplemental Figure S1
Supplemental Figure S2
Supplemental Figure S3
Supplemental Figure S4
Supplemental Figure S5

References

    1. Naglik J.R., Challacombe S.J., Hube B. Candida albicans secreted aspartyl proteinases in virulence and pathogenesis. Microbiol. Mol. Biol. Rev. 2003;67:400–428. - PMC - PubMed
    1. Yike I. Fungal proteases and their pathophysiological effects. Mycopathologia. 2011;171:299–323. - PubMed
    1. Rapala-Kozik M., Bochenska O., Zajac D., Karkowska-Kuleta J., Gogol M., Zawrotniak M., Kozik A. Extracellular proteinases of Candida species pathogenic yeasts. Mol. Oral Microbiol. 2018;33:113–124. - PubMed
    1. Gagnon-Arsenault I., Tremblay J., Bourbonnais Y. Fungal yapsins and cell wall: A unique family of aspartic peptidases for a distinctive cellular function. FEMS Yeast Res. 2006;6:966–978. - PubMed
    1. Kaur R., Ma B., Cormack B.P. A family of glycosylphosphatidylinositol-linked aspartyl proteases is required for virulence of Candida glabrata. Proc. Natl. Acad. Sci. U. S. A. 2007;104:7628–7633. - PMC - PubMed

Publication types