. 2022 Mar:216:108952.
doi: 10.1016/j.exer.2022.108952. Epub 2022 Jan 17.

Measuring hyperemic response to light flicker stimulus using continuous laser speckle flowgraphy in mice

Affiliations

Measuring hyperemic response to light flicker stimulus using continuous laser speckle flowgraphy in mice

Michelle R Tamplin et al. Exp Eye Res. 2022 Mar.

Abstract

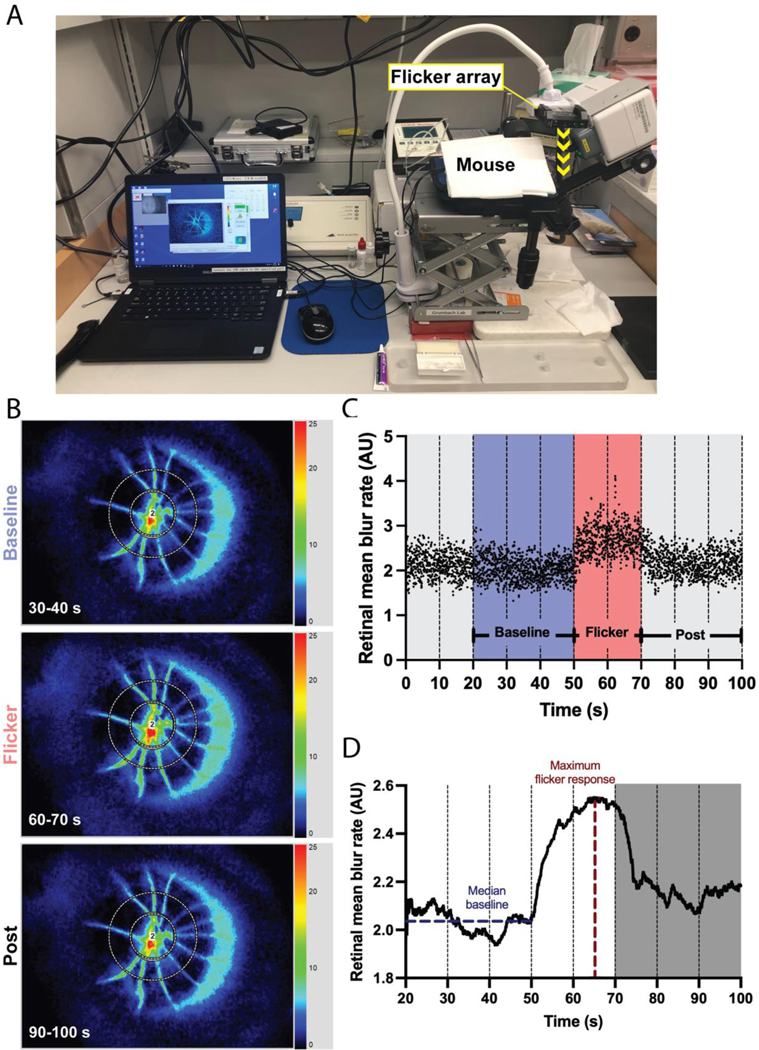
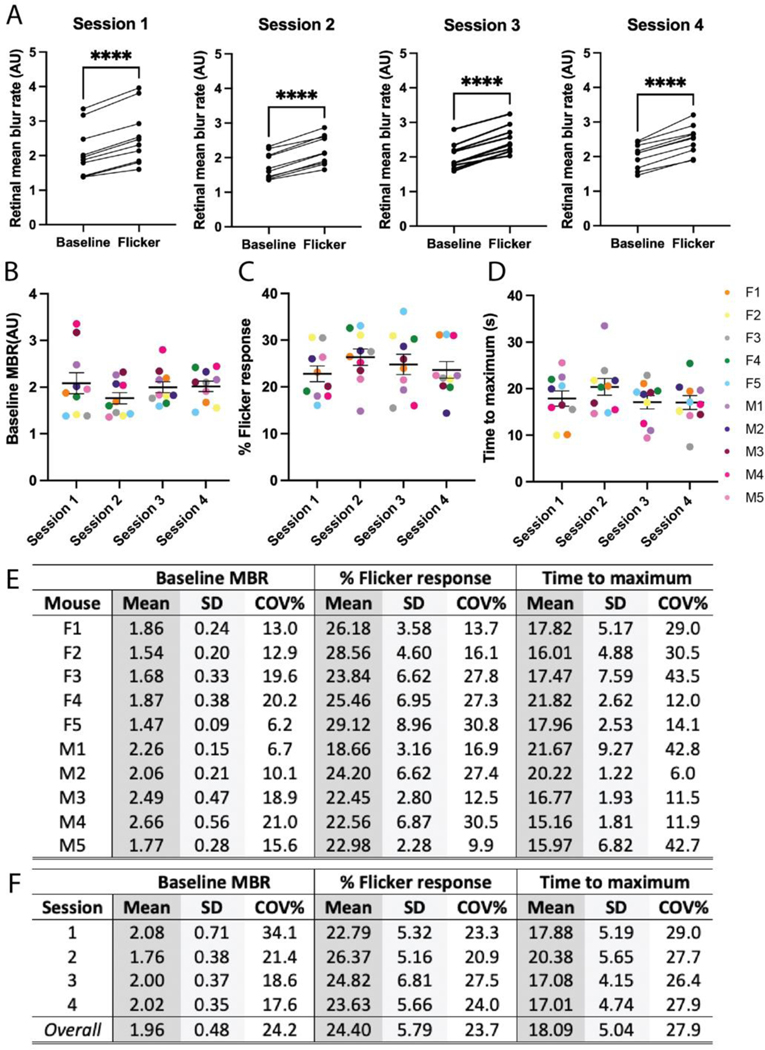
Alterations in neurovascular coupling have been associated with various ocular, cerebral, and systemic vascular disorders. In the eye, changes in vessel caliber by dynamic vessel analysis have been used to measure neurovascular coupling following a light flicker stimulus. Here, we present a new protocol for quantifying light-flicker induced hyperemia in the C57/Bl6J mouse retina using laser speckle flowgraphy (LSFG). Our protocol was adapted from protocols used in human subjects. By acquiring continuous time series data, we detected significant increase in blood flow. These responses are maintained with low variability over multiple imaging sessions, indicating these methods may be applied in serial studies of neurovascular coupling.

Keywords: Laser speckle flowgraphy; Neurovascular coupling; Retinal blood flow.


Figures

Figure 1:
Figure 1:. Continuous blood flow acquisition and processing methods.
(A) LSFG acquisition setup with position of the 10 Hz flicker array above the mouse eye relative to the LSFG-Micro camera. (B) Representative composite images acquired during baseline (30–40 s, top), flicker stimulus (60–70 s, middle) and post-flicker cessation (90–100 s, bottom) corresponding to the time series in (C,D). (C) Raw blood flow data acquired continuously at 30 fps over 100 s, resulting in 3000 data points. Time periods of interest for analysis are marked. (D) Processing of data shown in (C) result in a smooth response curve.
Figure 2:
Figure 2:. Blood flow characteristics with corresponding subject and session variability.
(A) Pairwise comparison of median baseline and maximal flicker response in 10 C57/Bl6J mice over four sessions. Significant increases in blood flow were observed across all sessions (p < 0.0001). Median baseline blood flow (B), maximal percent flicker response (C), and time to reach maximum response (D) calculated at each session. (E) Calculated mean, standard deviation, and intersession variability for all 10 mice, by each measure, across the four sessions. (F) Intrasession variability calculated for each measure. For (A-E) mice are codified by biological sex (F, female; M, male) and color-coded by mouse. **** p < 0.0001 by paired t-test (two-tailed) in A. (B-E) differences due to biological sex nonsignificant (p > 0.05) by 2-way ANOVA with Sidak’s multiple comparisons test; differences between sessions nonsignificant (p > 0.05) by one-way ANOVA with Tukey’s multiple comparisons test.

References

    1. Aizawa N, Nitta F, Kunikata H, Sugiyama T, Ikeda T, Araie M, Nakazawa T, 2014. Laser speckle and hydrogen gas clearance measurements of optic nerve circulation in albino and pigmented rabbits with or without optic disc atrophy. Investigative ophthalmology & visual science 55, 7991–7996. - PubMed
    1. Aizawa N, Yokoyama Y, Chiba N, Omodaka K, Yasuda M, Otomo T, Nakamura M, Fuse N, Nakazawa T, 2011. Reproducibility of retinal circulation measurements obtained using laser speckle flowgraphy-NAVI in patients with glaucoma. Clin Ophthalmol 5, 1171–1176. - PMC - PubMed
    1. Albanna W, Kotliar K, Lüke JN, Alpdogan S, Conzen C, Lindauer U, Clusmann H, Hescheler J, Vilser W, Schneider T, Schubert GA, 2018. Non-invasive evaluation of neurovascular coupling in the murine retina by dynamic retinal vessel analysis. PloS one 13, e0204689. - PMC - PubMed
    1. Arimura T, Shiba T, Takahashi M, Kumashiro S, Osamura H, Matsumoto T, Sakai K, Hori Y, 2018. Assessment of ocular microcirculation in patients with end-stage kidney disease. Graefe’s archive for clinical and experimental ophthalmology = Albrecht von Graefes Archiv fur klinische und experimentelle Ophthalmologie 256, 2335–2340. - PubMed
    1. Fondi K, Bata AM, Luft N, Witkowska KJ, Werkmeister RM, Schmidl D, Bolz M, Schmetterer L, Garhofer G, 2018. Evaluation of flicker induced hyperemia in the retina and optic nerve head measured by Laser Speckle Flowgraphy. PloS one 13. - PMC - PubMed

Publication types