. 2022 Jan 16;13(1):156.
doi: 10.3390/genes13010156.

Drought, Low Nitrogen Stress, and Ultraviolet-B Radiation Effects on Growth, Development, and Physiology of Sweetpotato Cultivars during Early Season

Affiliations

Drought, Low Nitrogen Stress, and Ultraviolet-B Radiation Effects on Growth, Development, and Physiology of Sweetpotato Cultivars during Early Season

Purushothaman Ramamoorthy et al. Genes (Basel). .

Abstract

Drought, ultraviolet-B (UV-B), and nitrogen stress are significant constraints for sweetpotato productivity. Their impact on plant growth and development can be acute, resulting in low productivity. Identifying phenotypes that govern stress tolerance in sweetpotatoes is highly desirable to develop elite cultivars with better yield. Ten sweetpotato cultivars were grown under nonstress (100% replacement of evapotranspiration (ET)), drought-stress (50% replacement of ET), UV-B (10 kJ), and low-nitrogen (20% LN) conditions. Various shoot and root morphological, physiological, and gas-exchange traits were measured at the early stage of the crop growth to assess its performance and association with the storage root number. All three stress factors caused significant changes in the physiological and root- and shoot-related traits. Drought stress reduced most shoot developmental traits (29%) to maintain root growth. UV-B stress increased the accumulation of plant pigments and decreased the photosynthetic rate. Low-nitrogen treatment decreased shoot growth (11%) and increased the root traits (18%). The highly stable and productive cultivars under all four treatments were identified using multitrait stability index analysis and weighted average of absolute scores (WAASB) analyses. Further, based on the total stress response indices, 'Evangeline', 'O'Henry', and 'Beauregard B-14' were identified as vigorous under drought; 'Evangeline', 'Orleans', and 'Covington' under UV-B; and 'Bonita', 'Orleans', and 'Beauregard B-14' cultivars showed greater tolerance to low nitrogen. The cultivars 'Vardaman' and 'NC05-198' recorded a low tolerance index across stress treatments. This information could help determine which plant phenotypes are desirable under stress treatment for better productivity. The cultivars identified as tolerant, sensitive, and well-adapted within and across stress treatments can be used as source materials for abiotic stress tolerance breeding programs.

Keywords: aboveground parameters; gas exchange; nutrient deficiency; roots; solar radiation; transpiration efficiency; water stress.


Conflict of interest statement

The authors declare no conflict of interest.

Figures

Figure 1
Figure 1
Drought (DS), low nitrogen (LN), and ultraviolet-B (UV-B) effect on (A) photosynthesis, (B) internal to atmospheric CO2 concentration ratio (Ci/Ca), (C) stomatal conductance (gs), and (D) transpiration of 10 sweetpotato cultivars measured at 20 days after planting. The middle line indicates the median, and the box shows the range of the 25th to 75th percentiles of the total data. The different alphabetic letters (a, b, c, and d) labeled within the box represent the significant differences between treatments (Duncan Multiple Range Test, p < 0.05), and the outer dots are outliers.
Figure 2
Figure 2
Drought (DS), low nitrogen (LN), and ultraviolet-B (UV-B) effect on (A) chlorophyll concentration, (B) nitrogen balance index, (C) flavonoid index, and (D) anthocyanin index of 10 sweet potato cultivars measured at 20 days after planting. The middle line indicates the median, and the box shows the range of the 25th to 75th percentiles of the total data. The different alphabetic letters (a, b, and c) labeled within the box represent the significant differences between treatments (Duncan Multiple Range Test, p < 0.05), and the outer dots are outliers.
Figure 3
Figure 3
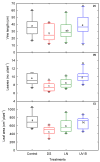
Drought (DS), low nitrogen (LN), and ultraviolet-B (UV-B) effect on (A) vine length, (B) leaf number, and (C) leaf area of 10 sweet potato cultivars measured at 20 days after planting. The middle line indicates the median, and the box shows the range of the 25th to 75th percentiles of the total data. The different alphabetic letters (a, b, and c) labeled within the box represent the significant differences between treatments (Duncan Multiple Range Test, p < 0.05), and the outer dots are outliers.
Figure 4
Figure 4
Drought (DS), low nitrogen (LN), and ultraviolet-B (UV-B) effect on (A) root length, (B) root surface area, (C) root volume, (D) root tips, (E) root forks, and (F) root diameter of 10 sweet potato cultivars measured at 20 days after planting. The middle line indicates the median, and the box shows the range of the 25th to 75th percentiles of the total data. The different alphabetic letters (a, b, and c) labeled within the box represent the significant differences between treatments (Duncan Multiple Range Test, p < 0.05), and the outer dots are outliers.
Figure 5
Figure 5
Drought (DS), low nitrogen (LN), and ultraviolet-B (UV-B) effect on (A) shoot weight, (B) root weight, (C) root to shoot ratio, and (D) storage root number of 10 sweet potato cultivars measured at 20 days after planting. The middle line indicates the median, and the box shows the range of the 25th to 75th percentiles of the total data. The different alphabetic letters (a, b, c, and d) labeled within the box represent the significant differences between treatments (Duncan Multiple Range Test, p < 0.05), and the outer dots are outliers.
Figure 6
Figure 6
Genotype raking of cultivars based on the multitrait stability index of ten sweetpotato cultivars evaluated under drought, low-nitrogen, ultraviolet-B, and control treatments. The selected genotypes based on this index are shown in red, and the central red circle represents the cutpoint according to the selection intensity (20%).
Figure 7
Figure 7
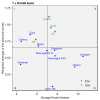
The yield × weighted average of absolute scores (WAASB) biplot based on joint interpretation of storage root number (Y) and stability (WAASB) for ten sweetpotato cultivars evaluated under drought (DS), ultraviolet-B (UV-B), low-nitrogen (LN), and control treatments.
Figure 8
Figure 8
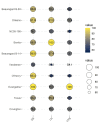
Bubble plot of the cultivars’ total stress indices, calculated from shoot, root, physiological, and gas-exchange traits, of 10 sweetpotato cultivars measured at 20 days after planting under drought (DS), ultraviolet-B (UV-B), and low-nitrogen (LN) stress conditions.

References

    1. The US Sweetpotato Council . Sweet Potato Statistical Year Book: World Statistics. The US Sweetpotato Council; Dillsburg, PA, USA: 2020. pp. 1–62.
    1. Betty J.B. Evaluating sweet potato as an intervention food to prevent vitamin A deficiency. Compr. Rev. Food Sci. Food Saf. 2011;10:118–130.
    1. Allen J.C., Corbitt A.D., Maloney K.P., Butt M.S., Truong V.D. Glycemic index of sweet potato as affected by cooking methods. Open Nutr. J. 2012;6:1–11. doi: 10.2174/1874288201206010001. - DOI
    1. Fuglie K.O. Priorities for sweetpotato research in developing countries: Results of a survey. Hortic. Sci. 2007;42:1200–1206. doi: 10.21273/HORTSCI.42.5.1200. - DOI
    1. Asiedu R., Sartie A. Crops that feed the World. 1. Yams: Yams for income and food security. Food Secur. 2010;2:305–315. doi: 10.1007/s12571-010-0085-0. - DOI

Publication types

MeSH terms

LinkOut - more resources