. 2021 Dec 28;11(1):66.
doi: 10.3390/antiox11010066.

SKP-SC-EVs Mitigate Denervated Muscle Atrophy by Inhibiting Oxidative Stress and Inflammation and Improving Microcirculation

Affiliations

SKP-SC-EVs Mitigate Denervated Muscle Atrophy by Inhibiting Oxidative Stress and Inflammation and Improving Microcirculation

Wei Wang et al. Antioxidants (Basel). .

Abstract

Denervated muscle atrophy is a common clinical disease that has no effective treatments. Our previous studies have found that oxidative stress and inflammation play an important role in the process of denervated muscle atrophy. Extracellular vesicles derived from skin precursor-derived Schwann cells (SKP-SC-EVs) contain a large amount of antioxidants and anti-inflammatory factors. This study explored whether SKP-SC-EVs alleviate denervated muscle atrophy by inhibiting oxidative stress and inflammation. In vitro studies have found that SKP-SC-EVs can be internalized and caught by myoblasts to promote the proliferation and differentiation of myoblasts. Nutrient deprivation can cause myotube atrophy, accompanied by oxidative stress and inflammation. However, SKP-SC-EVs can inhibit oxidative stress and inflammation caused by nutritional deprivation and subsequently relieve myotube atrophy. Moreover, there is a remarkable dose-effect relationship. In vivo studies have found that SKP-SC-EVs can significantly inhibit a denervation-induced decrease in the wet weight ratio and myofiber cross-sectional area of target muscles. Furthermore, SKP-SC-EVs can dramatically inhibit highly expressed Muscle RING Finger 1 and Muscle Atrophy F-box in target muscles under denervation and reduce the degradation of the myotube heavy chain. SKP-SC-EVs may reduce mitochondrial vacuolar degeneration and autophagy in denervated muscles by inhibiting autophagy-related proteins (i.e., PINK1, BNIP3, LC3B, and ATG7). Moreover, SKP-SC-EVs may improve microvessels and blood perfusion in denervated skeletal muscles by enhancing the proliferation of vascular endothelial cells. SKP-SC-EVs can also significantly inhibit the production of reactive oxygen species (ROS) in target muscles after denervation, which indicates that SKP-SC-EVs elicit their role by upregulating Nrf2 and downregulating ROS production-related factors (Nox2 and Nox4). In addition, SKP-SC-EVs can significantly reduce the levels of interleukin 1β, interleukin-6, and tumor necrosis factor α in target muscles. To conclude, SKP-SC-EVs may alleviate the decrease of target muscle blood perfusion and passivate the activities of ubiquitin-proteasome and autophagy-lysosome systems by inhibiting oxidative stress and inflammatory response, then reduce skeletal muscle atrophy caused by denervation. This study not only enriches the molecular regulation mechanism of denervated muscle atrophy, but also provides a scientific basis for SKP-SC-EVs as a protective drug to prevent and treat muscle atrophy.

Keywords: SKP-SC-EVs; denervated muscle atrophy; inflammation; microcirculation; oxidative stress.


Conflict of interest statement

The authors declare no conflict of interest.

Figures
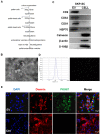
Figure 1
Figure 1
Identification of EVs from SKP-SCs. (A) Schematic diagram of gradient ultracentrifugation steps for separating and extracting EVs derived from SKP-SCs. (B) Representative transmission electron microscope images of SKP-SC-EVs. Scale bar = 500 nm. (C) Western blot analysis shows the positive expression of exosomal markers CD9, CD63, CD81, and HSP70 in EVs. Calnexin, β-actin, and S-100β in SKP-SCs acted as control markers positively expressed in SKP-SCs. (D) NTA of representative SKP-SC-EV particles. (E) Representative SKP-SC-EVs labeled with PKH67 (green) in the cytoplasm of C2C12 myoblasts (red label indicates myosin), and the nucleus labeled with DAPI (blue). Scale bar = 20 μm. EVs, extracellular vesicles; SCs, Schwann cells; SKP, skin-derived precursors.
Figure 2
Figure 2
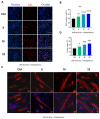
SKP-SC-EVs promote C2C12 cell proliferation and differentiation. (A) Representative EdU staining image of C2C12 cells 12 h after SKP-SC-EV or control treatment. Scale bar = 400 μm. (B) Histogram indicating the number of proliferating cells in the EV and control (Ctrl) groups. n = 4, ** p < 0.01 and **** p < 0.0001 vs. Ctrl group. (C) SKP-SC-EV effects on the induction of C2C12 cell fusion. Scale bar = 20 μm. (D) Histogram indicating the effect of different doses of SKP-SC-EVs on the myotube fusion index. n = 4, * p < 0.05 and *** p < 0.001 vs. Ctrl group. EVs, extracellular vesicles. SCs, Schwann cells; SKP, skin-derived precursors.
Figure 3
Figure 3
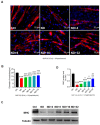
SKP-SC-EVs relieve C2C12 myotube atrophy caused by nutrient deprivation. (A) Myosin heavy chain (MHC) immunofluorescence image of myotubes 12 h after treatment with HBSS with or without SKP-SC-EVs (4 × 10⁸, 8 × 10⁸, 16 × 108, and 32 × 108 particles/mL). Red represents MHC staining. Scale bar = 20 μm. (B) Measurement of myotube diameter. After SKP-SC-EV treatment, the diameter of myotubes gradually increased. n = 4, *** p < 0.001 vs. Ctrl group, ### p < 0.001 vs. ND group. (C) Western blot images of MHC expression in different treatment groups. (D) Representative western blot detection of changes in MHC expression. n = 3, ** p < 0.01 and *** p < 0.001 vs. Ctrl group; # p < 0.05 and ## p < 0.01 vs. ND group. Ctrl, control; EVs, extracellular vesicles; HBSS, Hank’s balanced salt solution; ND, nutritional deprivation; SCs, Schwann cells; SKP, skin-derived precursors.
Figure 4
Figure 4
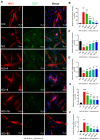
SKP-SC-EVs inhibit oxidative stress of myotubes after nutrient deprivation. (A) DCF staining images of myotubes 12 h after treatment with HBSS with or without SKP-SC-EVs (4 × 10⁸, 8 × 10⁸, 16 × 108, and 32 × 108 particles/mL). Red and green represent MHC staining and DCF staining, respectively. Blue fluorescence in far right panels represent DAPI-stained nuclei. Scale bar = 20 μm. (B) Histogram indicating that SKP-SC-EVs inhibit oxidative stress of atrophic myotubes after nutrient deprivation. n = 4, * p < 0.05, ** p < 0.01, and *** p < 0.001 vs. Ctrl group; ## p < 0.01 vs. ND group. (CF) qRT-PCR analysis of oxidative stress-related genes Nrf2, NQO1, Nox4, and Nox2 in myotubes. n = 3, * p < 0.05, ** p < 0.01, and *** p < 0.001 vs. Ctrl group; # p < 0.05 and ## p < 0.01 vs. ND group. Ctrl, control; DCF, dichlorofluorescein; EVs, extracellular vesicles; HBSS, Hank’s balanced salt solution; ND, nutritional deprivation; SCs, Schwann cells; SKP, skin-derived precursors.
Figure 5
Figure 5
SKP-SC-EVs inhibit inflammation in myotubes after nutrient deprivation. (AC) qRT-PCR analysis of the expression of IL-1β, IL-6, and TNF-α in myotubes 12 h after treatment with HBSS with or without SKP-SC-EVs (4 × 10⁸, 8 × 10⁸, 16 × 108, and 32 × 108 particles/mL). n = 3, * p < 0.05, ** p < 0.01, and *** p < 0.001 vs. Ctrl group; # p < 0.05, ## p < 0.01, and ### p < 0.001 vs. ND group. Ctrl, control; DCF, dichlorofluorescein; EVs, extracellular vesicles; HBSS, Hank’s balanced salt solution; IL, interleukin; ND, nutritional deprivation; SCs, Schwann cells; SKP, skin-derived precursors; TNF-α, tumor necrosis factor-α.
Figure 6
Figure 6
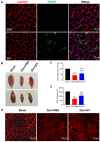
SKP-SC-EVs alleviate denervated skeletal muscle atrophy. (A) EVs labeled with PKH67 (green) are displayed in the muscle fibers (red), and the nucleus is labeled with DAPI (blue). Scale bar = 20 μm. The tibialis anterior muscle was injected with PBS (Ctrl group) or PKH67-labeled EVs (EV group). (B) General observation of the effect of SKP-SC-EVs on denervated muscle atrophy. (C) Histogram indicating the effect of SKP-SC-EVs on the wet weight ratio after denervated muscle atrophy. n = 10, *** p < 0.001 vs. Sham group; ### p < 0.001 vs. Den + PBS group. (D) Laminin (red) staining of muscle fiber cross-sections in different treatment groups after denervated muscle atrophy. Scale bar = 50 μm. (E) Statistical analysis of muscle fiber cross-sections. n = 5, *** p < 0.001 vs. Sham group; ### p < 0.001 vs. Den + PBS group. The sham group was injected with PBS; the Den group was injected with PBS containing SKP-SC-EVs (5 × 10¹⁰ particles) (Den + EV group), and; the Ctrl PBS group (Den + PBS group) was injected with PBS. The tibialis anterior muscle samples were collected 14 days after treatment. Den, denervation; EVs, extracellular vesicles; SCs, Schwann cells; SKP, skin-derived precursors.
Figure 7
Figure 7
SKP-SC-EVs inhibit oxidative stress of the denervated skeletal muscle. (A) DHE (red) staining of the tibialis anterior muscle fiber section. Scale bar = 100 μm (low magnification); Scale bar = 50 μm (high magnification). (B) Relative quantification of DHE fluorescence intensity; n = 5, * p < 0.05 and *** p < 0.001 vs. Sham group; # p < 0.05 vs. Den + PBS group. (C) Representative western blot detection of the levels of Nrf2, Nox2, and Nox4 in the tibialis anterior muscle in different treatment groups. (DF) Histogram of the relative levels of Nrf2, Nox2, and Nox4 proteins. n = 3, * p < 0.05, ** p < 0.01, and *** p < 0.001 vs. Sham group; # p < 0.05 and ## p < 0.01 vs. Den + PBS group. The sham group was injected with PBS; the Den group was injected with PBS containing SKP-SC-EVs (5 × 10¹⁰ particles) (Den + EV group), and; the control PBS group (Den + PBS group) was injected with PBS. The tibialis anterior muscle samples were collected 14 days after treatment. Den, denervation; DHE, dihydroethidium; EVs, extracellular vesicles; SCs, Schwann cells; SKP, skin-derived precursors.
Figure 8
Figure 8
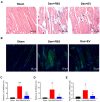
SKP-SC-EVs inhibit inflammation in the denervated skeletal muscle. (A) Hematoxylin-eosin staining of skeletal muscle. Black arrows indicate inflammatory cells. Scale bar = 50 μm. (B) CD68 immunofluorescence staining (green indicates CD68 positive signals). Scale bar = 20 μm. (CE) qPCR analysis of the expression of inflammatory factors IL-1β, IL-6, and TNF-α in the tibialis anterior muscle. n = 3, * p < 0.05, ** p < 0.01, and *** p < 0.001 vs. Sham group; # p < 0.05 and ## p < 0.01 vs. Den + PBS group. The sham group was injected with PBS; the Den group was injected with PBS containing SKP-SC-EVs (5 × 10¹⁰ particles) (Den + EV group), and; the control PBS group (Den + PBS group) was injected with PBS. The tibialis anterior muscle samples were collected 14 days after treatment. Den, denervation; EVs, extracellular vesicles; TNF-α, tumor necrosis factor-α.
Figure 9
Figure 9
SKP-SC-EVs inhibit ubiquitinated proteolysis during denervated muscle atrophy. (A) Representative western blot detection of MHC, MuRF1, and MAFbx in different treatment groups. (BD) Histogram showing the relative abundances of MHC, MuRF1, and MAFbx in the tibialis anterior muscle after denervation. n = 3, * p < 0.05, ** p < 0.01, and *** p < 0.001 vs. Sham group; # p < 0.05 vs. Den + PBS group. The sham group was injected with PBS; the Den group was injected with PBS containing SKP-SC-EVs (5 × 10¹⁰ particles) (Den + EV group), and; the control PBS group (Den + PBS group) was injected with PBS. The tibialis anterior muscle samples were collected 14 days after treatment. Den, denervation; EVs, extracellular vesicles; IL, interleukin; SCs, Schwann cells; SKP, skin-derived precursors; TNF-α, tumor necrosis factor-α.
Figure 10
Figure 10
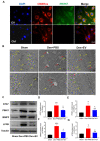
SKP-SC-EVs inhibit denervation-induced skeletal muscle autophagy. (A) Co-localization of SKP-SC-EVs and mitochondria: PKH67-labeled SKP-SC-EVs (green), CMXRos-labeled mitochondria (red), and nuclei labeled with DAPI (blue). Scale bar = 20 μm. The EV group was given SKP-SC-EVs, but the Ctrl group was not. (B) Electron microscope observation of the tibialis anterior muscle. The lower image shows an enlarged part of the upper image. The yellow arrow indicates normal mitochondria, and the red arrow indicates mitochondrial autophagy. (C) Representative western blot analysis of autophagy-related proteins ATG7, PINK1, BNIP3, and LC3B in the tibialis anterior muscle in different treatment groups. (DG) Histogram of the relative expressions of ATG7, PINK1, BNIP3, and LC3B in the tibialis anterior muscle in different treatment groups. n = 3, * p < 0.05, ** p < 0.01, and *** p < 0.001 vs. Sham group; # p < 0.05 vs. Den + PBS group. The sham group was injected with PBS; the Den group was injected with PBS containing SKP-SC-EVs (5 × 10¹⁰ particles) (Den + EV group), and; the control PBS group (Den + PBS group) was injected with PBS. The tibialis anterior muscle samples were collected 14 days after treatment. Den, denervation; EVs, extracellular vesicles; SCs, Schwann cells; SKP, skin-derived precursors.
Figure 11
Figure 11
SKP-SC-EVs promote the proliferation of HUVEC cells and improve blood flow reperfusion in the denervated skeletal muscle. (A) EdU staining of HUVEC cells. Scale bar = 400 μm. (B) Histogram showing the effect of the SKP-SC conditioned medium on the proliferation of HUVEC cells. n = 4, * p < 0.05 and *** p < 0.001 vs. Control group. (C) The effect of SKP-SC-EVs on the micro-blood flow in denervated skeletal muscles. Red indicates CD31 positive signals, and blue indicates the DAPI-labeled nucleus. Scale bar = 100 μm (low magnification); scale bar = 50 μm (high magnification). (D) Histogram showing the relative fluorescence intensity of the CD31 positive signal. n = 5, * p < 0.05 and *** p < 0.001 vs. Sham group; # p < 0.05 vs. Den + PBS group. (E) qPCR analysis of the expression of VEGF in the tibialis anterior muscle. n = 3, ** p < 0.01 vs. Sham group; ### p < 0.001 vs. Den + PBS group (F) Laser Doppler blood flow imaging analysis of the influence of SKP-SC-EVs on the micro-blood flow in the denervated skeletal muscle. (G) Histogram showing the blood perfusion ratio of the ischemic lower limb and the contralateral non-ischemic lower limb at different times after denervation. n = 6, *** p < 0.001 vs. Sham group; ## p < 0.01 and ### p < 0.001 vs. Den + PBS group. The sham group was injected with PBS; the Den group was injected with PBS containing SKP-SC-EVs (5 × 10¹⁰ particles) (Den + EV group), and; the control PBS group (Den + PBS group) was injected with PBS. The tibialis anterior muscle samples were collected 14 days after treatment. Den, denervation; EVs, extracellular vesicles; HUVEC, human umbilical vein endothelial cell; SCs, Schwann cells; SKP, skin-derived precursors.
Figure 12
Figure 12
Schematic diagram illustrating how SKP-SC-EVs may alleviate denervation-induced decrease in the blood flow of target muscles by inhibiting oxidative stress and inflammation, improving microcirculation, and inactivating the ubiquitinated proteolytic and autophagy-lysosomal pathways, thereby alleviating denervated skeletal muscle atrophy.

References

    1. Nagai K., Misonou Y., Fujisaki Y., Fuyuki R., Horii Y. Topical application of l-carnosine to skeletal muscle excites the sympathetic nerve innervating the contralateral skeletal muscle in rats. Amino Acids. 2019;51:39–48. doi: 10.1007/s00726-018-2597-4. - DOI - PubMed
    1. Carlson B.M. The biology of long-term denervated skeletal muscle. Eur. J. Transl. Myol. 2014;24:3293. doi: 10.4081/bam.2014.1.5. - DOI - PMC - PubMed
    1. Qiu J., Fang Q., Xu T., Wu C., Xu L., Wang L., Yang X., Yu S., Zhang Q., Ding F., et al. Mechanistic role of reactive oxygen species and therapeutic potential of antioxidants in denervation- or fasting-induced skeletal muscle atrophy. Front. Physiol. 2018;9:215. doi: 10.3389/fphys.2018.00215. - DOI - PMC - PubMed
    1. Shen Y., Zhang R., Xu L., Wan Q., Zhu J., Gu J., Huang Z., Ma W., Shen M., Ding F., et al. Microarray analysis of gene expression provides new insights into denervation-induced skeletal muscle atrophy. Front. Physiol. 2019;10:1298. doi: 10.3389/fphys.2019.01298. - DOI - PMC - PubMed
    1. Anderson L.J., Liu H., Garcia J.M. Sex differences in muscle wasting. Ad. Exp. Med. Biol. 2017;1043:153–197. - PubMed

LinkOut - more resources