. 2022 Jan 5;11(1):113.
doi: 10.3390/antiox11010113.

The Response to Oxidative Damage Correlates with Driver Mutations and Clinical Outcome in Patients with Myelofibrosis

Affiliations

The Response to Oxidative Damage Correlates with Driver Mutations and Clinical Outcome in Patients with Myelofibrosis

Elena Genovese et al. Antioxidants (Basel). .

Abstract

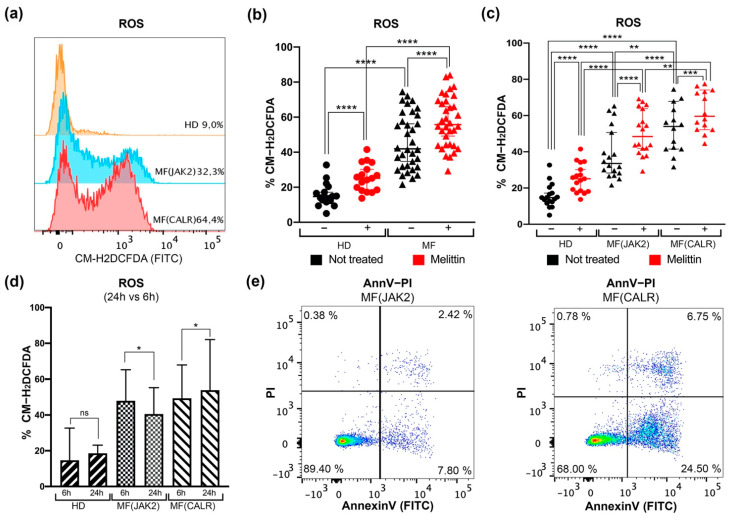
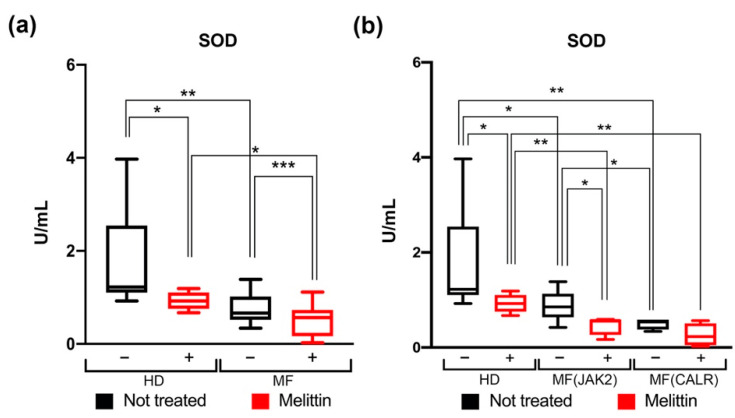
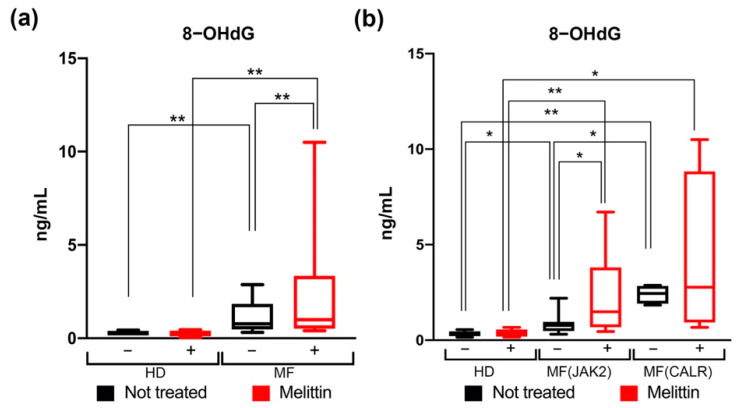
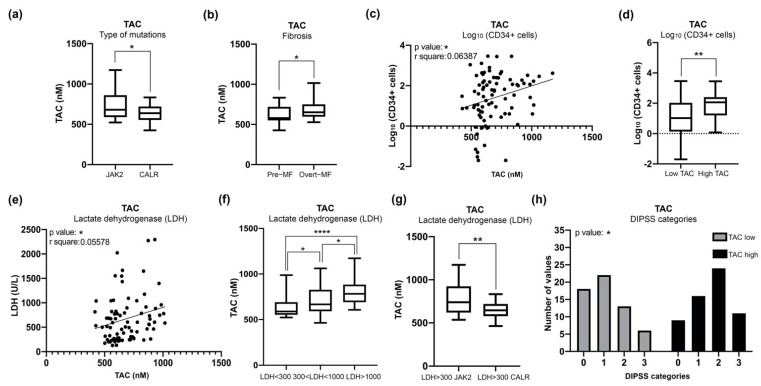
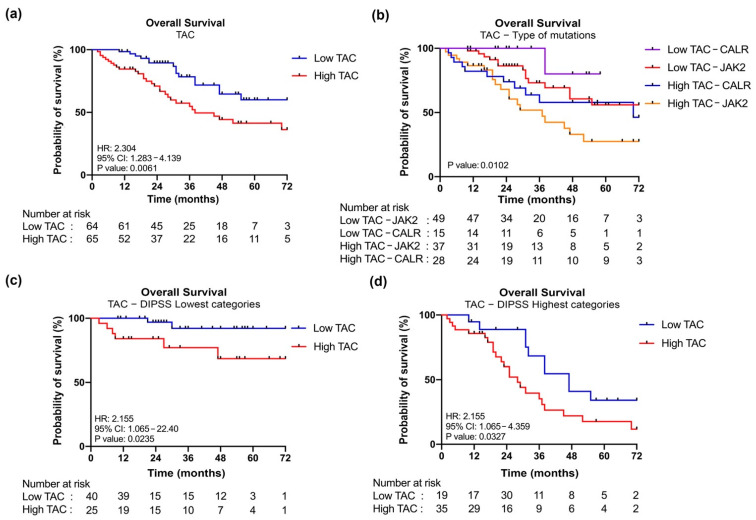
Myelofibrosis (MF) is the Philadelphia-negative myeloproliferative neoplasm characterized by the worst prognosis and no response to conventional therapy. Driver mutations in JAK2 and CALR impact on JAK-STAT pathway activation but also on the production of reactive oxygen species (ROS). ROS play a pivotal role in inflammation-induced oxidative damage to cellular components including DNA, therefore leading to greater genomic instability and promoting cell transformation. In order to unveil the role of driver mutations in oxidative stress, we assessed ROS levels in CD34+ hematopoietic stem/progenitor cells of MF patients. Our results demonstrated that ROS production in CD34+ cells from CALR-mutated MF patients is far greater compared with patients harboring JAK2 mutation, and this leads to increased oxidative DNA damage. Moreover, CALR-mutant cells show less superoxide dismutase (SOD) antioxidant activity than JAK2-mutated ones. Here, we show that high plasma levels of total antioxidant capacity (TAC) correlate with detrimental clinical features, such as high levels of lactate dehydrogenase (LDH) and circulating CD34+ cells. Moreover, in JAK2-mutated patients, high plasma level of TAC is also associated with a poor overall survival (OS), and multivariate analysis demonstrated that high TAC classification is an independent prognostic factor allowing the identification of patients with inferior OS in both DIPSS lowest and highest categories. Altogether, our data suggest that a different capability to respond to oxidative stress can be one of the mechanisms underlying disease progression of myelofibrosis.

Keywords: 8-hydroxy-2′-deoxy-guanosine; calreticulin; janus kinase 2; myelofibrosis; oxidative stress; reactive oxygen species; superoxide dismutase; total antioxidant capacity.


Conflict of interest statement

The authors declare no conflict of interest.

Figures

Figure 1
Figure 1
Detection of intracellular ROS levels in CD34+ cells of MF patients. (a) Representative histograms for flow cytometry detection of CM-H2DCFDA staining at 6 h in untreated CD34+ cells of HD, MF(JAK2) and MF(CALR) samples. (b) Dot plot shows the percentages of intracellular ROS assessed in HD and in MF samples, with (red dots) or without (black dots) 6 h of Melittin treatment respectively. The comparison between HD and MF was analyzed using Mann–Whitney U test, while the comparisons between treated and untreated cells were analyzed with Wilcoxon matched-pairs signed rank test. (c) Dot plot shows the percentages of intracellular ROS in the comparison between JAK2- or CALR-mutated MF patients compared to HD, with (red dots) or without (black dots) 6 h Melittin treatment respectively. The comparisons between HD and MF(JAK2) and between HD and MF(CALR) was analyzed with Mann–Whitney U test, while the comparisons between treated and not treated cells were analyzed with Wilcoxon matched-pairs signed rank test. (d) Histogram shows the percentages of intracellular ROS after 6 and 24 h; the statistical test used was Wilcoxon matched-pairs signed rank test. (e) Representative dot plots for flow cytometry detection of Annexin V/PI staining in CD34+ cells of MF(JAK2) and MF(CALR) samples. Data are reported as median with 95% CI (confidence interval). * p < 0.05, ** p < 0.01, *** p < 0.001, **** p < 0.0001.
Figure 2
Figure 2
Measurement of SOD activity in CD34+ cells of MF patients. (a) Box plot shows the SOD activity in HD and in MF Scheme 24. hours Melittin treatment respectively. (b) Box plot shows the percentages of SOD activity in the comparison between JAK2 or CALR-mutated MF patients compared to HD, with (red bars) or without (black bars) 24 h Melittin treatment respectively. SOD activity was normalized based on total amount protein were used to perform the assay. Data are reported as median of SOD activity (expressed in U/mL) with 95% CI (confidence interval). The comparisons between HD and MF were performed using Mann–Whitney U test, while the comparisons between treated and not treated cells were analyzed using Wilcoxon matched-pairs signed rank test. * p < 0.05, ** p < 0.01, *** p < 0.001.
Figure 3
Figure 3
Measurement of 8-OHdG levels in CD34+ cells of MF patients. (a) Box plot shows the 8-OHdG levels in HD and in MF samples, with (red bars) or without (black bars) 24 h Melittin treatment respectively. (b) Box plot shows the levels of 8-OHdG in JAK2- or CALR-mutated MF patients compared to HD, with (red bars) or without (black bars) 24 h of Melittin treatment respectively. Data are reported as median of 8-OHdG levels (expressed in ng/mL) with 95% CI (confidence interval). The comparisons between HD and MF were analyzed by means of Mann–Whitney U test, while the comparisons between treated and not treated cells were analyzed using Wilcoxon matched-pairs signed rank test. * p < 0.05, ** p < 0.01.
Figure 4
Figure 4
Measurement of TAC in plasma of MF patients and correlation with clinical detrimental features. (a) Box plot shows the level of TAC in CALR and JAK2-mutated MF patients. (b) Box plot shows correlation analysis of TAC level with fibrosis. (c) Graph represents linear regression analysis in MF patients showing correlation between the count of circulating CD34+ cells and TAC levels. (d) Box plot represents correlation analysis of the count of circulating CD34+ cells in MF samples presenting low or high levels of TAC. (e) Graph represents linear regression analysis in MF patients showing correlation between serum LDH and TAC levels. (f) Box plot represents correlation analysis of TAC levels with levels of serum LDH in MF samples divided into three ranges: LDH < 300, 300 < LDH < 1000, LDH > 1000 nM. (g) Graph showing correlations between JAK2- and CALR-mutated patients with LDH > 300 nM and TAC plasma levels. (h) Histogram was obtained from contingency tables computed to correlate low or high TAC plasma levels and DIPSS classification; the analysis was conducted with Chi-square test. Samples with low or high TAC levels are represented in gray and black, respectively. Box plot data are reported as median with 95% CI; the comparisons between two categories were analyzed with Mann–Whitney U test, while multiple comparisons were analyzed with Kruskal Wallis test. * p < 0.05, ** p < 0.01, **** p < 0.0001.
Figure 5
Figure 5
Kaplan–Meier analysis of OS according to TAC plasma levels. (a) Kaplan–Meier estimates OS according to TAC plasma levels. Patients’ cohort was stratified into two groups (low and high) according to the plasma levels of TAC. Blue and red curves represent patients with low or high levels of TAC respectively. (b) Kaplan–Meier estimates of OS according to TAC plasma levels and type of mutations. For this analysis patient cohort was stratified into four groups: CALR-mutated samples with low TAC (in violet), JAK2-mutated samples with low TAC (in red), CALR-mutated samples with high TAC (in blue), JAK2-mutated samples with high TAC (in yellow). (c) Kaplan–Meier estimates of OS according to TAC plasma levels in DIPSS lowest categories (Low and Intermediated-1). (d) Kaplan–Meier estimates of OS according to TAC plasma levels in DIPSS highest categories (High and Intermediated-2). Differences between two survival curves was evaluated by log-rank (Mantel–Cox) test. HR, hazard ratio computed to determine the magnitude of differences between two curves. 95% CI, 95% confidence interval. p value was computed by log-rank test.

References

    1. Sies H. Biochemistry of Oxidative Stress. Angew. Chem. Int. Ed. Engl. 1986;25:1058–1071. doi: 10.1002/anie.198610581. - DOI
    1. Bjørn M.E., Hasselbalch H.C. The Role of Reactive Oxygen Species in Myelofibrosis and Related Neoplasms. Mediat. Inflamm. 2015;2015:1–11. doi: 10.1155/2015/648090. - DOI - PMC - PubMed
    1. Allegra A., Pioggia G., Tonacci A., Casciaro M., Musolino C., Gangemi S. Synergic Crosstalk between Inflammation, Oxidative Stress, and Genomic Alterations in BCR–ABL-Negative Myeloproliferative Neoplasm. Antioxidants. 2020;9:1037. doi: 10.3390/antiox9111037. - DOI - PMC - PubMed
    1. Tefferi A., Pardanani A. Myeloproliferative Neoplasms: A Contemporary Review. JAMA Oncol. 2015;1:97. doi: 10.1001/jamaoncol.2015.89. - DOI - PubMed
    1. Tefferi A. Primary Myelofibrosis: 2021 Update on Diagnosis, Risk--stratification and Management. Am. J. Hematol. 2021;96:145–162. doi: 10.1002/ajh.26050. - DOI - PubMed

LinkOut - more resources