. 2022 Jan 15;11(1):164.
doi: 10.3390/antiox11010164.

The Trypanosoma brucei-Derived Ketoacids, Indole Pyruvate and Hydroxyphenylpyruvate, Induce HO-1 Expression and Suppress Inflammatory Responses in Human Dendritic Cells

Affiliations

The Trypanosoma brucei-Derived Ketoacids, Indole Pyruvate and Hydroxyphenylpyruvate, Induce HO-1 Expression and Suppress Inflammatory Responses in Human Dendritic Cells

Hannah K Fitzgerald et al. Antioxidants (Basel). .

Abstract

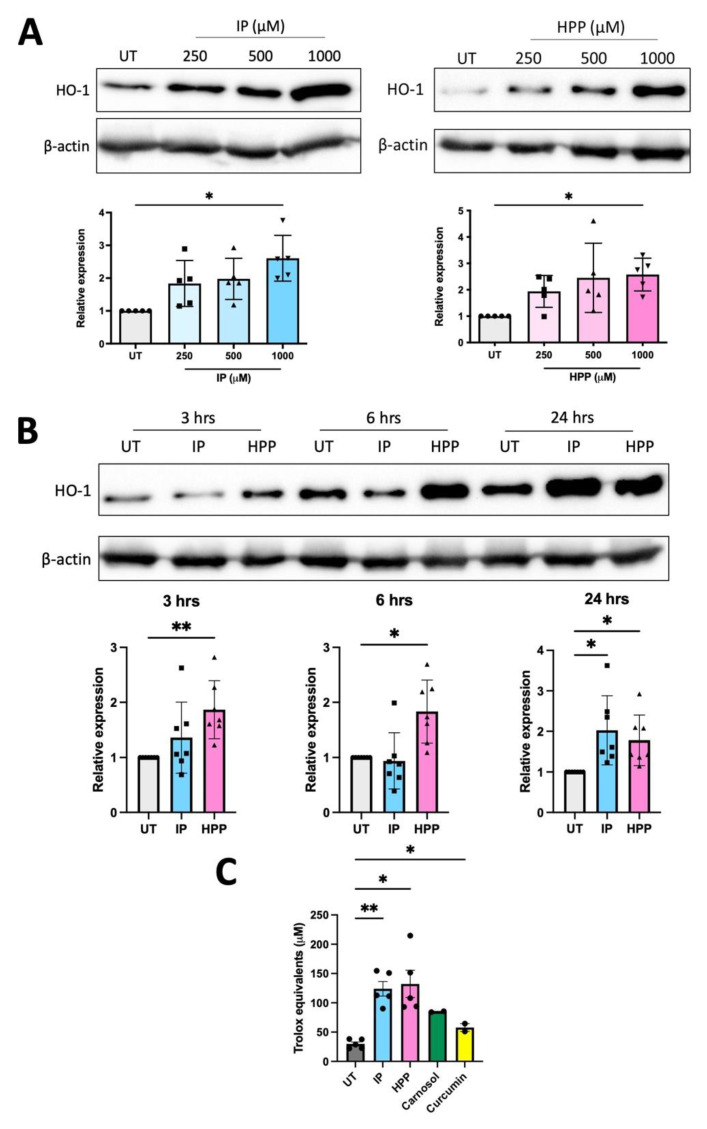
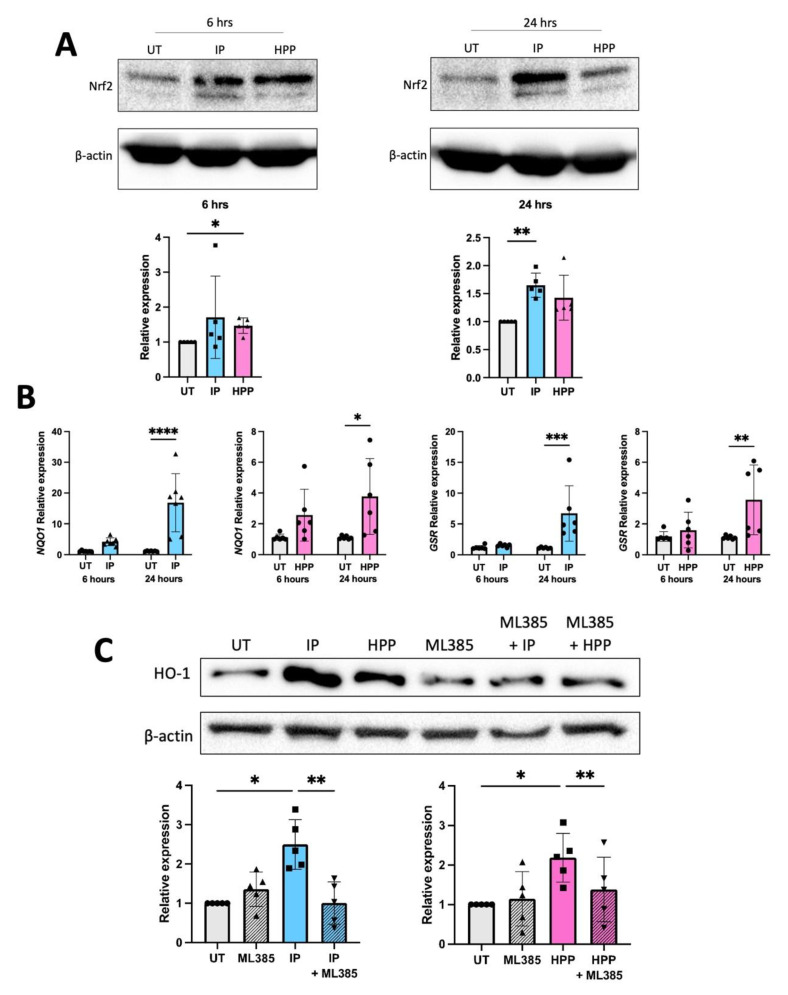
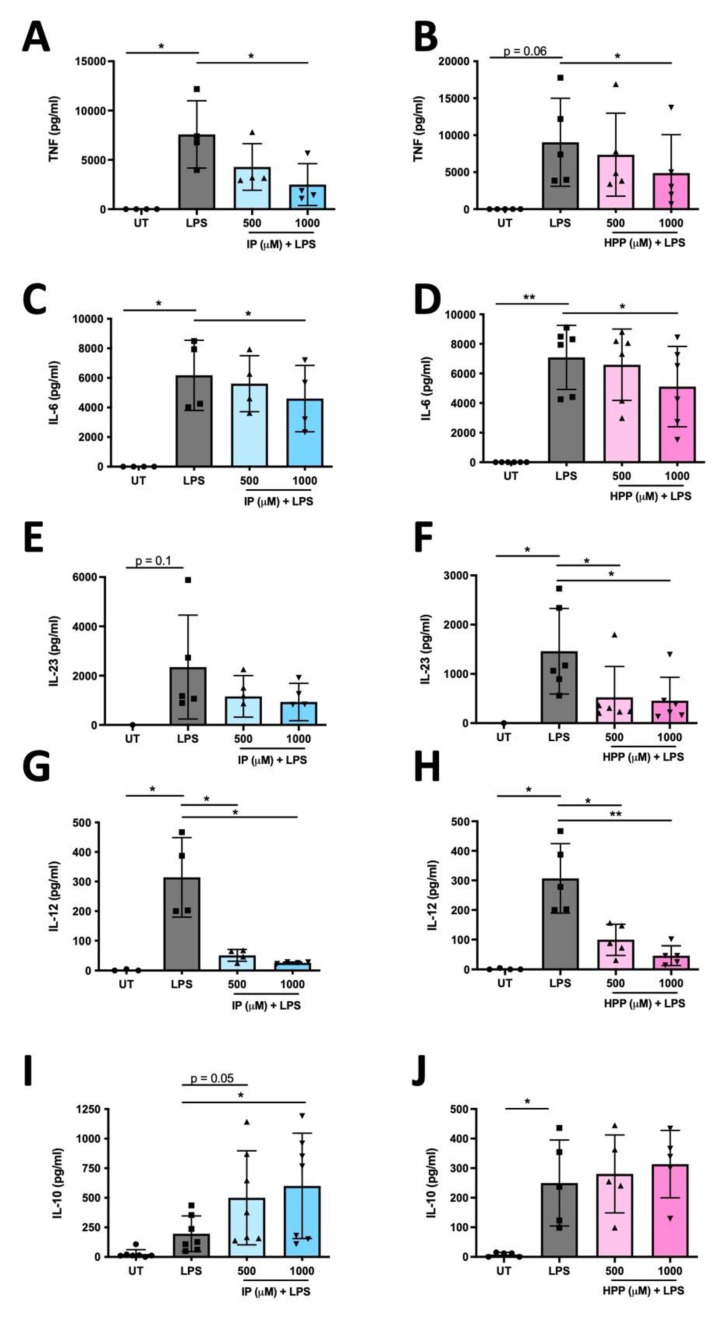
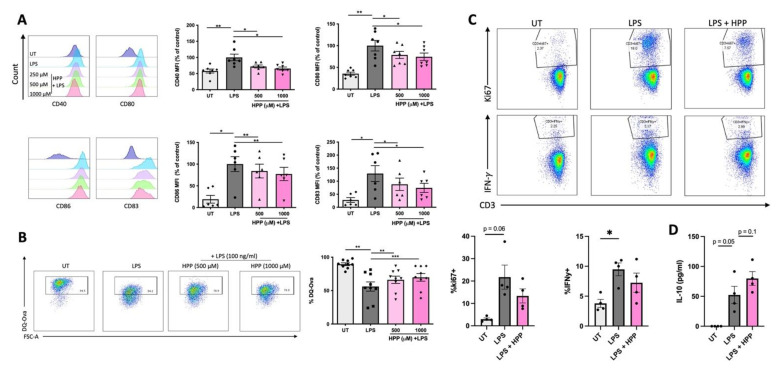
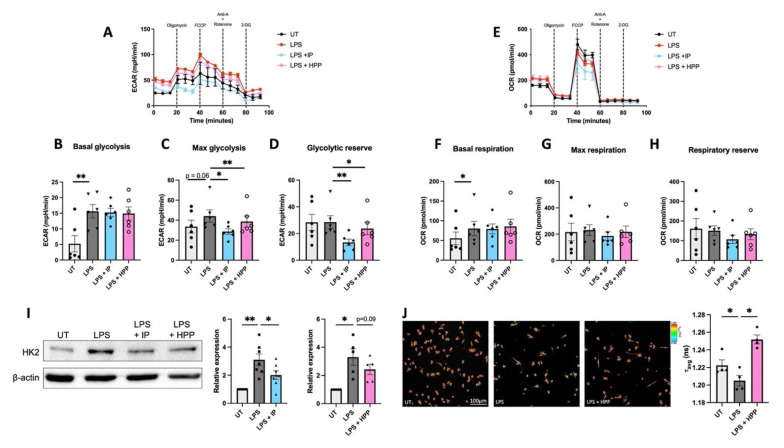
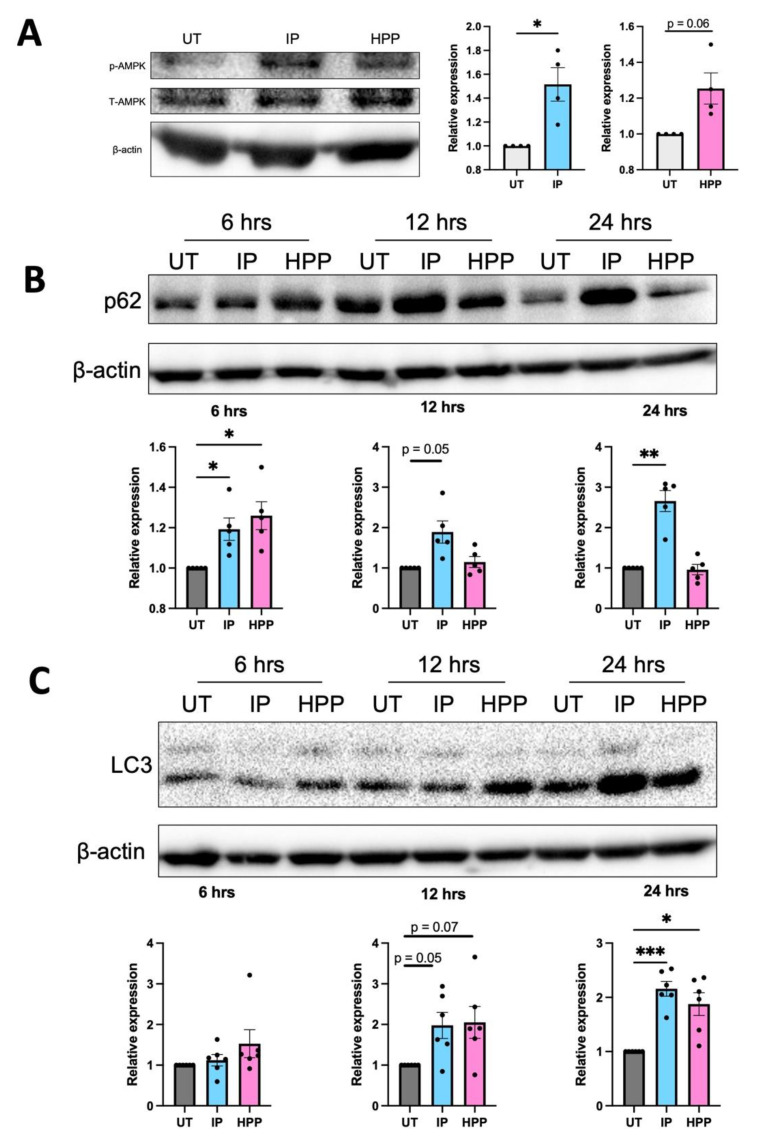
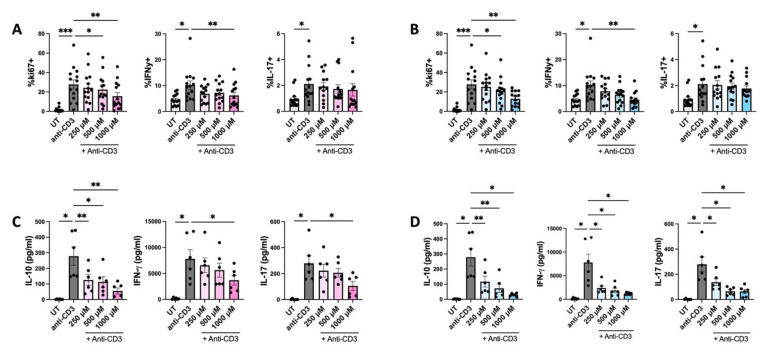
The extracellular parasite and causative agent of African sleeping sickness Trypanosoma brucei (T. brucei) has evolved a number of strategies to avoid immune detection in the host. One recently described mechanism involves the conversion of host-derived amino acids to aromatic ketoacids, which are detected at relatively high concentrations in the bloodstream of infected individuals. These ketoacids have been shown to directly suppress inflammatory responses in murine immune cells, as well as acting as potent inducers of the stress response enzyme, heme oxygenase 1 (HO-1), which has proven anti-inflammatory properties. The aim of this study was to investigate the immunomodulatory properties of the T. brucei-derived ketoacids in primary human immune cells and further examine their potential as a therapy for inflammatory diseases. We report that the T. brucei-derived ketoacids, indole pyruvate (IP) and hydroxyphenylpyruvate (HPP), induce HO-1 expression through Nrf2 activation in human dendritic cells (DC). They also limit DC maturation and suppress the production of pro-inflammatory cytokines, which, in turn, leads to a reduced capacity to differentiate adaptive CD4+ T cells. Furthermore, the ketoacids are capable of modulating DC cellular metabolism and suppressing the inflammatory profile of cells isolated from patients with inflammatory bowel disease. This study therefore not only provides further evidence of the immune-evasion mechanisms employed by T. brucei, but also supports further exploration of this new class of HO-1 inducers as potential therapeutics for the treatment of inflammatory conditions.

Keywords: Trypanosoma brucei; anti-inflammatory therapies; aromatic ketoacids; dendritic cells; heme oxygenase 1; immunomodulation; inflammatory bowel disease.


Conflict of interest statement

The authors declare no conflict of interest.

Figures

Figure 1
Figure 1
Hydroxyphenylpyruvate (HPP) and indole pyruvate (IP) upregulate HO-1 in primary human dendritic cells (DC). (A) Primary human DC were left untreated (UT) or incubated with HPP or IP (250–1000 μM) for 24 h. HO-1 expression was detected by western blot. Densitometry results shown are mean ± SEM of the relative expression of HO-1: β-actin from five healthy donors. (B) DC were left UT or incubated with HPP or IP at 1000 μM for 3, 6, or 24 h. HO-1 expression was detected by western blot. Densitometry results shown are mean ± SEM of the relative expression of HO-1: β-actin from seven healthy donors. (C) Primary human DC were left UT or incubated with HPP or IP at 1000 μM, or carnosol or curcumin (both 10 μM), for 1 h. Total antioxidant capacity of the cells was determined and expressed as an equivalent concentration of Trolox (μM). Pooled data showing the mean (±SEM) from five healthy donors. Repeated measures one-way ANOVA, with Dunnett’s multiple comparisons post hoc test, was used to determine statistical significance by comparing means of treatment groups against the mean of the control group (** p < 0.01, * p < 0.05). ImageLab (Bio-Rad) software was used to perform densitometric analysis.
Figure 2
Figure 2
HPP and IP induce HO-1 through Nrf2 activation. (A) Primary human DC were left untreated (UT) or incubated with HPP or IP at 1000 μM for 6 or 24 h. Nrf2 expression was measured by western blot. Densitometry results shown are mean ± SEM of the relative expression of Nrf2: β-actin from five healthy donors. (B) Primary human DC were left UT or incubated with HPP or IP at 1000 µM for 24 h. mRNA expression of the Nrf2-dependent genes, NQO-1 and GSR, were measured by RT-PCR. Results show mean (±SEM) for six healthy donors. (C) Primary human DC were pre-treated either with or without the Nrf2 inhibitor ML385 (10 μM) for 1 h, prior to incubation with HPP or IP at 1000 μM for 24 h. HO-1 expression was measured by western blot. Densitometry results shown are mean ± SEM of the relative expression of HO-1: β-actin from five healthy donors. (A) One-way ANOVA, with Dunnett’s multiple comparisons post hoc test, was used to determine statistical significance. (B) Two-way ANOVA, with Šídák’s multiple comparisons post hoc test, was used to determine statistical significance. (C) One-way ANOVA, with Šídák’s multiple comparisons post hoc test, was used to determine statistical significance (**** p < 0.0001, *** p < 0.001, ** p < 0.01, * p < 0.05). ImageLab (Bio-Rad) software was used to perform densitometric analysis.
Figure 3
Figure 3
HPP and IP reduce the production of pro-inflammatory cytokines in LPS-stimulated human DC. Primary human DC were left untreated (UT) or incubated with IP (A,C,E,G,I) or HPP (B,D,F,H,J) (500–1000 µM) for 6 h prior to stimulation with LPS (100 ng/mL) for 24 h. Cell supernatants were assessed for TNF, IL-6, IL-23, IL-12p70, and IL-10 secretion by ELISA. Pooled data depict mean (±SEM) cytokine concentrations for four to seven healthy donors (means of three technical replicates per donor). Repeated measures one-way ANOVA, with Dunnett’s multiple comparisons post hoc test, was used to determine statistical significance, by comparing means of treatment groups against the mean of the control group (** p < 0.01, * p < 0.05).
Figure 4
Figure 4
HPP treatment reduces DC maturation and subsequent CD4+ T cell activation. Primary human DC were left untreated (UT) or incubated with HPP (500–1000 μM) for 6 h prior to stimulation with LPS (100 ng/mL) for 24 h. (A) Cells were stained for CD40, CD80, CD86, and CD83 and analysed by flow cytometry. Histograms showing the expression of maturation markers for HPP-treated, LPS-stimulated DC compared to unstimulated cells or LPS stimulation alone from one representative experiment. Pooled data showing the mean (±SEM) MFI for each marker expressed as a percentage of control (LPS stimulation alone) from six to seven healthy donors. (B) DC were incubated with FITC-conjugated DQ-Ovalbumin (DQ-Ova; 500 ng/mL) for 20 min and were immediately acquired by flow cytometry. Dot plots depicting DQ-Ova uptake from one representative experiment. Pooled data showing the mean (±SEM) DQ-Ova uptake as a percentage of total cells from nine healthy donors. (C) DC were pre-treated with HPP prior to stimulation with LPS, and subsequently cultured with CD4+ T cells for five days. Dot plots depicting ki67 expression (as a measure of proliferation) and IFNγ expression from one representative experiment. Pooled data showing the mean (±SEM) of ki67+ and IFNγ+ cells as a percentage of CD3+CD8 cells from four healthy donors. (D) Cell supernatants were assessed for IL-10 secretion by ELISA. Pooled data depict mean (±SEM) cytokine concentrations for four healthy donors (means of three technical replicates per donor). Repeated measures one-way ANOVA, with Dunnett’s multiple comparisons post hoc test, was used to determine statistical significance by comparing means of treatment groups against the mean of the control group (*** p < 0.001, ** p < 0.01, * p < 0.05).
Figure 5
Figure 5
HPP and IP modulate metabolic reprogramming in LPS-stimulated DC. Primary human DC were pre-treated with either HPP or IP at 1000 μM for 6 h before stimulation with LPS (100 ng/mL) for 12 h. The extracellular acidification rate (ECAR) and the oxygen consumption rate (OCR) were measured using a Seahorse XFe96 analyser before and after the injections of oligomycin (1 mM), FCCP (1 mM), antimycin A (500 nM) and rotenone (500 nM), and 2-DG (25 mM). Bioenergetic profiles from one representative experiment depicting (A) ECAR and (E) OCR measurements over time. Pooled data (N = 6) depicts the calculated mean (±SEM) of (B) basal glycolytic rate, (C) max glycolytic rate, (D) glycolytic reserve, (F) basal respiratory rate, (G) max respiratory rate, and (H) respiratory reserve for each treatment group. (I) HK2 expression was measured by western blot. Densitometry results shown are mean ± SEM of the relative expression of HK2: β-actin from five to seven healthy donors. (J) FLIM images of DC measuring intracellular NADH. Pooled data (N = 4) depicts the mean (±SEM) of the ratio of bound:free NADH, represented by the τ average. Repeated measures one-way ANOVA, with Dunnett’s multiple comparisons post hoc test, was used to determine statistical significance by comparing means of treatment groups against the mean of the control group (** p < 0.01, * p < 0.05). ImageLab (Bio-Rad) software was used to perform densitometric analysis.
Figure 6
Figure 6
HPP and IP modulate autophagy-related proteins. (A) Primary human DC were left untreated (UT) or incubated with IP or HPP at 1000 µM for 15 min. Phosphorylation of AMPK was measured by western blot. Densitometry results shown are mean ± SEM of the relative expression of p-AMPK: β-actin from four healthy donors. (B,C) Primary human DC were left UT or incubated with IP or HPP at 1000 µM for 6, 12, or 24 h. Expression of (B) p62 and (C) LC3 were measured by western blot. Densitometry results shown are mean ± SEM of the relative expression of (B) p62: β-actin from five healthy donors and (C) LC3 II: β-actin from six healthy donors. (A) Statistical significance was determined using a Paired t-test. (B,C) Statistical significance was determined by repeated measures one-way ANOVA with Dunnett’s multiple comparisons post hoc test to compare means of treatment groups to the control group (*** p < 0.001, ** p < 0.01, * p < 0.05). ImageLab (Bio-Rad) software was used to perform densitometric analysis.
Figure 7
Figure 7
HPP and IP reduce proliferation and cytokine expression in ex vivo stimulated PBMC from patients with Inflammatory Bowel Disease. PBMC isolated from IBD patients were treated with (A,C) HPP or (B,D) IP (250 µM–1000 µM) for 6 h prior to stimulation with anti-CD3 for 12 h. After 18 h, culture media was replaced with fresh media and cells were incubated for a further 4 days with anti-CD3 stimulation. Supernatants were removed for analysis of cytokine concentration by ELISA. (A,B) Proliferation and cytokine production by CD3+CD8 cells was analysed by flow cytometry. Pooled data (N = 14) depicting the mean ± SEM of ki67 (as a measure of proliferation), IFNγ, and IL-17 in CD3+CD8 T cells. (C,D) Cell supernatants were assessed for concentrations of IL-10, IFNγ, and IL-17 by ELISA. Pooled data depicts mean (±SEM) cytokine concentrations for six IBD patients (means of three technical replicates per donor). Statistical significance was determined by repeated measures one-way ANOVA with Dunnett’s multiple comparisons post hoc test to compare means of treatment groups to the control group (*** p < 0.001, ** p < 0.01, * p < 0.05).

References

    1. Stijlemans B., Caljon G., Van Den Abbeele J., Van Ginderachter J.A., Magez S., De Trez C. Immune Evasion Strategies of Trypanosoma brucei within the Mammalian Host: Progression to Pathogenicity. Front. Immunol. 2016;7:233. doi: 10.3389/fimmu.2016.00233. - DOI - PMC - PubMed
    1. Berger B.J., Dai W.W., Wang H., Stark R.E., Cerami A. Aromatic amino acid transamination and methionine recycling in trypanosomatids. Proc. Natl. Acad. Sci. USA. 1996;93:4126–4130. doi: 10.1073/pnas.93.9.4126. - DOI - PMC - PubMed
    1. Marciano D., Llorente C., Maugeri D.A., de la Fuente C., Opperdoes F., Cazzulo J.J., Nowicki C. Biochemical characterization of stage-specific isoforms of aspartate aminotransferases from Trypanosoma cruzi and Trypanosoma brucei. Mol. Biochem. Parasitol. 2008;161:12–20. doi: 10.1016/j.molbiopara.2008.05.005. - DOI - PubMed
    1. McGettrick A.F., Corcoran S.E., Barry P.J.G., McFarland J., Crès C., Curtis A.M., Franklin E., Corr S.C., Mok K.H., Cummins E.P., et al. Trypanosoma brucei metabolite indolepyruvate decreases HIF-1α and glycolysis in macrophages as a mechanism of innate immune evasion. Proc. Natl. Acad. Sci. USA. 2016;113:E7778–E7787. doi: 10.1073/pnas.1608221113. - DOI - PMC - PubMed
    1. Campbell N.K., Williams D.G., Fitzgerald H.K., Barry P.J., Cunningham C.C., Nolan D.P., Dunne A. Trypanosoma brucei Secreted Aromatic Ketoacids Activate the Nrf2/HO-1 Pathway and Suppress Pro-inflammatory Responses in Primary Murine Glia and Macrophages. Front. Immunol. 2019;10:2137. doi: 10.3389/fimmu.2019.02137. - DOI - PMC - PubMed