. 2021 Dec 22;10(1):16.
doi: 10.3390/biomedicines10010016.

Characterization of the Gut Microbiota in Individuals with Overweight or Obesity during a Real-World Weight Loss Dietary Program: A Focus on the Bacteroides 2 Enterotype

Affiliations

Characterization of the Gut Microbiota in Individuals with Overweight or Obesity during a Real-World Weight Loss Dietary Program: A Focus on the Bacteroides 2 Enterotype

Rohia Alili et al. Biomedicines. .

Abstract

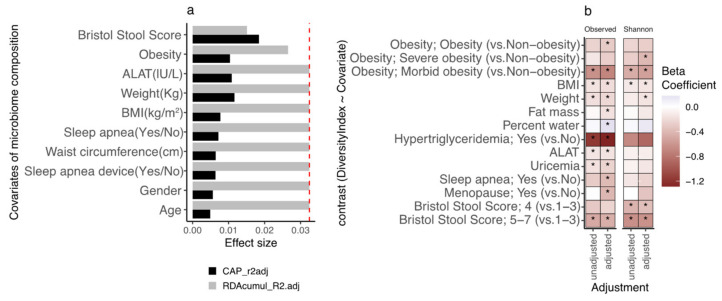
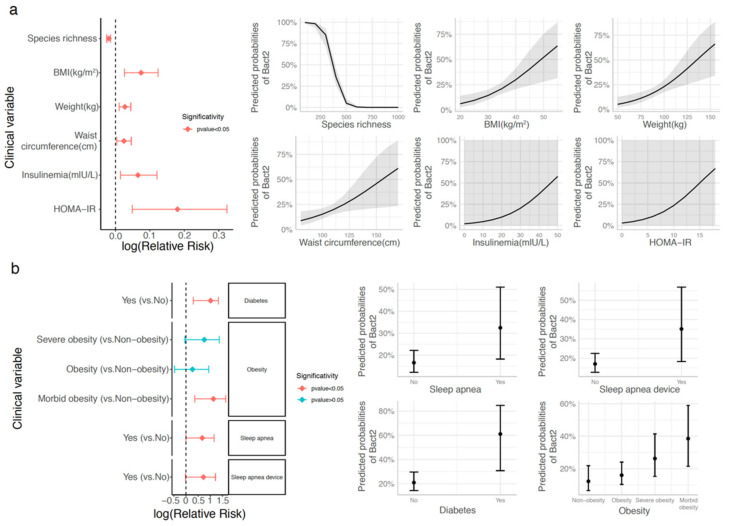
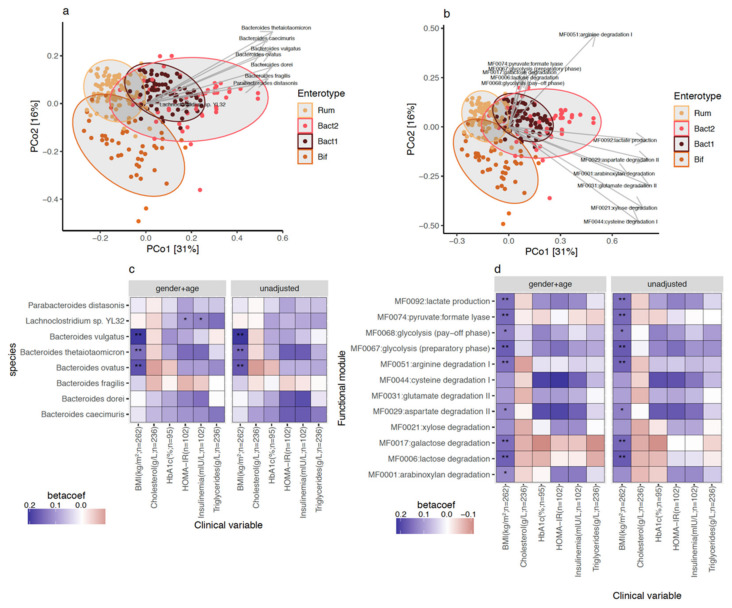
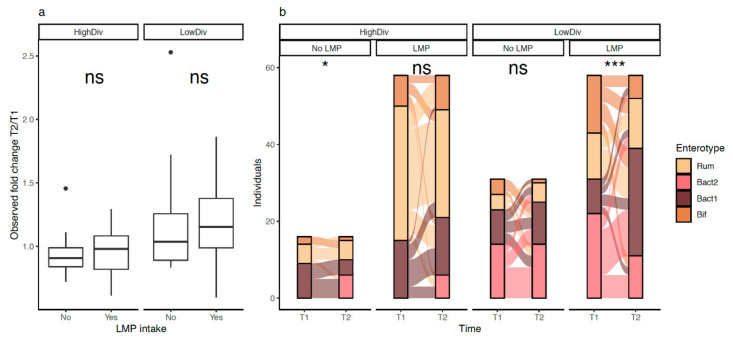
Background: Dietary intervention is a cornerstone of weight loss therapies. In obesity, a dysbiotic gut microbiota (GM) is characterized by high levels of Bacteroides lineages and low diversity. We examined the GM composition changes, including the Bacteroides 2 enterotype (Bact2), in a real-world weight loss study in subjects following a high-protein hypocaloric diet with or without a live microorganisms (LMP) supplement.

Method: 263 volunteers were part of this real-world weight loss program. The first phase was a high-protein low-carbohydrate calorie restriction diet with or without LMP supplements. Fecal samples were obtained at baseline and after 10% weight loss for 163 subjects. Metagenomic profiling was obtained by shotgun sequencing.

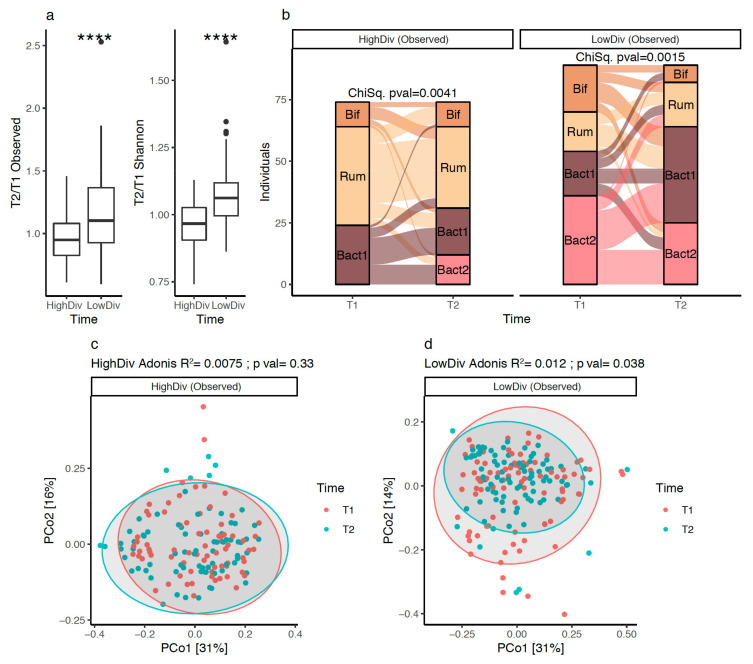
Results: At baseline, the Bact2 enterotype was more prevalent in subjects with aggravated obesity and metabolic alterations. After weight loss, diversity increased and Bact2 prevalence decreased in subjects with lower GM diversity at baseline, notably in LMP consumers. Significant increases in Akkermansia muciniphila and Parabacteroides distasonis and significant decreases of Eubacterium rectale, Streptococcus thermophilus and Bifidobacterial lineages were observed after weight loss.

Conclusions: Baseline microbiome composition is associated with differential changes in GM diversity and Bact2 enterotype prevalence after weight loss. Examining these signatures could drive future personalized nutrition efforts towards more favorable microbiome compositions.

Keywords: Bacteroides 2 enterotype; gut microbiota; nanopore technology; obesity; real-world dietary intervention; weight loss.


Conflict of interest statement

T.D.S., N.G. and E.B. work at Integrative Phenomics (Paris, France). K.C. has received grants from Danone Research (Palaiseau, France), Ysopia (Bordeaux, France), and CONFO therapeutics (Gent, Belgium); however, for work not associated with this study.

Figures

Figure 1
Figure 1
Links between clinical covariates, microbiome composition, and microbiome diversity on the GutInside baseline cohort (n = 263). (a) Variables explaining the microbiome compositional variation (distance-based redundancy analyzes, dbRDA; genus-level Bray–Curtis dissimilarity), either independently (univariate effect sizes in black; features with p-value < 0.05 in dbRDA) or in a multivariate model (cumulative effect sizes in grey). The cut-off for significant non-redundant contribution to the multivariate model is represented by the red line (p-value < 0.05 in stepwise model building). (b) Heatmap of beta-coefficients product of linear regression of species richness and Shannon evenness (dependent variable) vs. clinical covariates (dependent variable; y-axis) under unadjusted and adjusted design by age, gender, and center of recruitment (x-axis). Only significant contrasts are included in the figure (* = p-value < 0.05; Obesity: 4-level variable based on BMI ranges < 30 (non-obesity), 30 ≤ BMI < 35 (obesity); 35 ≤ BMI < 40 (severe obesity); BMI ≥ 40 (Morbid obesity)).
Figure 2
Figure 2
Association between Bact2 enterotype and clinical covariates in the GutInside baseline cohort (n = 263). Clinical covariates with significant association with Bact2 status over baseline cohort based on logistic regression analyses adjusted by age, gender, and center of recruitment. Results are represented as relative risk score intervals of Bact2 status (left side plots) for numerical (a) and categorical variables (b) with significant associations (p-value < 0.05). Panels on the right represent the predicted probability of Bact2 status based on logistic regression models of each clinical covariate in relative risk score panels (p-value < 0.05; adjusted by age, gender, and center of recruitment; Obesity = 30 ≤ BMI < 35; Severe obesity = 35 ≤ BMI < 40; Morbid Obesity = BMI ≥ 40; non-obesity = BMI < 30).
Figure 3
Figure 3
Taxonomic and functional features enriched in Bact2 microbiome composition and association with clinical variables on GutInside baseline cohort (n = 263). Principal coordinate analyses (PCoA) of 263 individuals of GutInside cohort colored by microbiome enterotypes with abundance vectors of bacterial species (a) and functional modules (b) enriched in Bact2 microbiome composition (FDR < 0.05, Kruskal–Wallis test of microbiome enterotypes vs. feature abundance; Cliff’s delta effect size >0 in pairwise comparisons of feature abundance in Bact2 samples vs. samples from other 3 enterotypes) fitted on the ordination plot. (c) Heatmap of standardized beta-coefficients showing the associations between the abundance of the 8 bacterial species enriched in Bact2 microbiome composition and clinical variables in 263 individuals of the GutInside baseline cohort based on linear regression models adjusted by different cofounding variables (* = p-value < 0.05; ** = FRD < 0.05; linear regression models of each bacterial specie (y-axis) vs. clinical variables (x-axis) adjusted by cofounding variables in the top of each facet). (d) Same as (c) with the 12 functional modules enriched in Bact2 microbiome composition.
Figure 4
Figure 4
Evolution of microbiome diversity and composition at 10% weight loss in 163 individuals of GutInside study (follow-up cohort): (a) Boxplots of species richness and Shannon evenness fold changes distributions (10% weight loss vs. baseline; y-axis) between high and low diversity groups defined from the median of the entire baseline population (n = 263 individuals; 490 species). **** = p-value < 0.001; Wilcoxon signed-rank test). (b) Alluvial plots showing the evolution of enterotype composition of 163 individuals of the follow-up cohort (y-axis) between baseline (T1) and 10% weight loss (T2; x-axis) stratified by the baseline microbiome diversity of individuals (high vs. low diversity based on species richness index). p-value of Chi-Square test individuals within each diversity group showed in the top of each plot. (c) PCoA (genus-level Bray–Curtis beta-diversity) of inter-sample composition of 74 individuals in the High-diversity group between baseline (T1) and 10% weight loss (T2). Results of the PERMANOVA test to evaluate the impact of dietary intervention on microbiome composition shown on the top of the plot. (d) PCoA (genus-level Bray–Curtis beta-diversity) of inter-sample composition of 89 individuals in the Low-diversity group between baseline (T1) and 10% weight loss (T2). Results of the PERMANOVA test to evaluate the impact of dietary intervention on microbiome composition shown on the top of the plot.
Figure 5
Figure 5
Effect of LMP supplement intake on microbiome diversity and enterotype composition across individuals of the GutInside follow-up cohort (n = 163). (a) Boxplots of species richness fold changes distributions (10% weight loss vs. baseline; y-axis) between individuals taking or not the LMP supplement stratified by the baseline microbiome diversity of individuals (high vs. low diversity) (ns = non-significant). (b) Alluvial plots showing the evolution of enterotype composition of 163 individuals of the follow-up cohort (y-axis) between baseline (V1) and 10% weight loss (V2; x-axis) stratified by the baseline microbiome diversity of individuals (high vs. low diversity) and the intake of LMP supplement. p-value of chi-square test within each diversity group showed in the top of each plot (ns = non-significant; * = p-value < 0.05; *** = p-value < 0.001). n = 16 (HighDiv-No LMP intake), n = 31 (LowDiv No LMP intake), n = 58 (HighDiv-LMP intake), n = 58 (LowDiv-LMP intake).

References

    1. World Health Organization (WHO) [(accessed on 10 October 2021)]. Available online: https://www.who.int/news-room/fact-sheets/detail/obesity-and-overweight.
    1. Kolb R., Sutterwala F.S., Zhang W. Obesity and cancer: Inflammation bridges the two. Curr. Opin. Pharmacol. 2016;29:77–89. doi: 10.1016/j.coph.2016.07.005. - DOI - PMC - PubMed
    1. Martin-Rodriguez E., Guillen-Grima F., Martí A., Brugos-Larumbe A. Comorbidity associated with obesity in a large population: The APNA study. Obes. Res. Clin. Pr. 2015;9:435–447. doi: 10.1016/j.orcp.2015.04.003. - DOI - PubMed
    1. Ryan D.H., Kahan S. Guideline Recommendations for Obesity Management. Med. Clin. N. Am. 2018;102:49–63. doi: 10.1016/j.mcna.2017.08.006. - DOI - PubMed
    1. Beam A., Clinger E., Hao L. Effect of Diet and Dietary Components on the Composition of the Gut Microbiota. Nutrients. 2021;13:2795. doi: 10.3390/nu13082795. - DOI - PMC - PubMed

LinkOut - more resources