. 2022 Jan 7;10(1):125.
doi: 10.3390/biomedicines10010125.

Definition of an Inflammatory Biomarker Signature in Plasma-Derived Extracellular Vesicles of Glioblastoma Patients

Affiliations

Definition of an Inflammatory Biomarker Signature in Plasma-Derived Extracellular Vesicles of Glioblastoma Patients

Chiara Cilibrasi et al. Biomedicines. .

Abstract

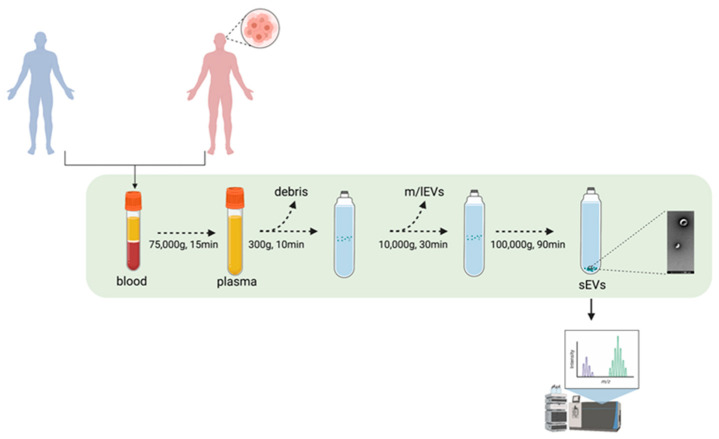
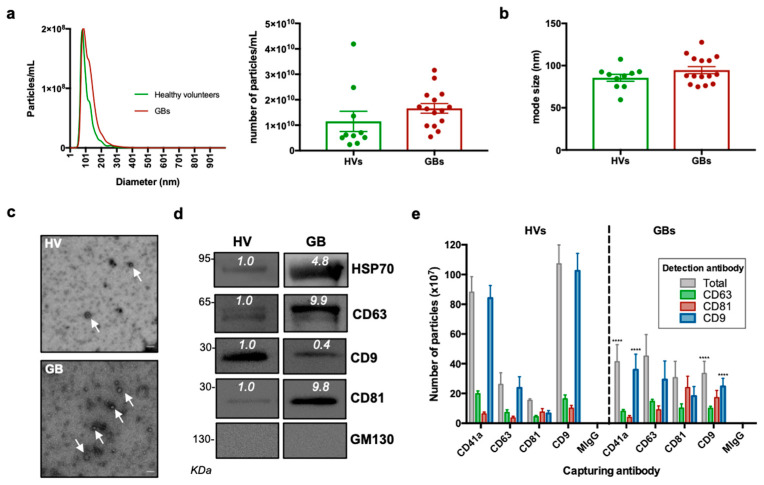
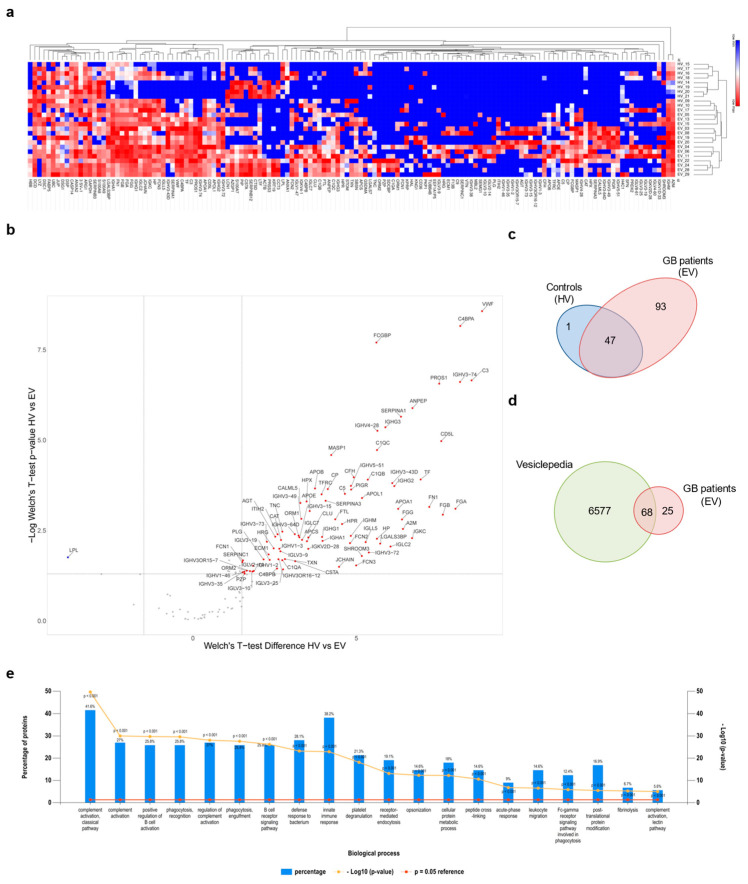
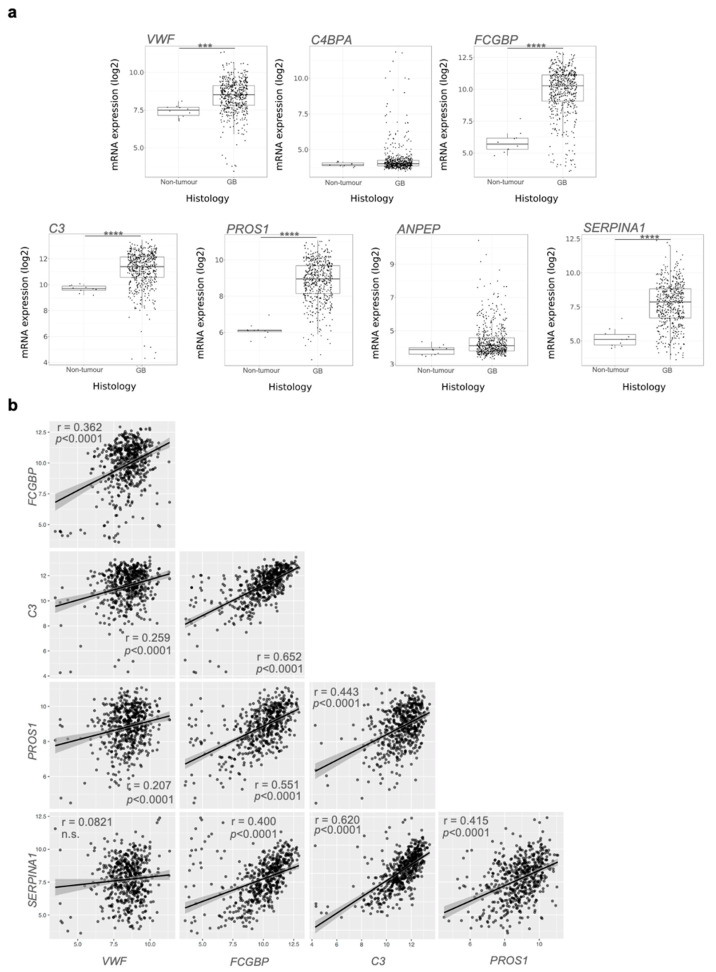
Glioblastoma (GB) is an aggressive type of tumour for which therapeutic options and biomarkers are limited. GB diagnosis mostly relies on symptomatic presentation of the tumour and, in turn, brain imaging and invasive biopsy that can delay its diagnosis. Description of easily accessible and effective biomarkers present in biofluids would thus prove invaluable in GB diagnosis. Extracellular vesicles (EVs) derived from both GB and stromal cells are essential to intercellular crosstalk in the tumour bulk, and circulating EVs have been described as a potential reservoir of GB biomarkers. Therefore, EV-based liquid biopsies have been suggested as a promising tool for GB diagnosis and follow up. To identify GB specific proteins, sEVs were isolated from plasma samples of GB patients as well as healthy volunteers using differential ultracentrifugation, and their content was characterised through mass spectrometry. Our data indicate the presence of an inflammatory biomarker signature comprising members of the complement and regulators of inflammation and coagulation including VWF, FCGBP, C3, PROS1, and SERPINA1. Overall, this study is a step forward in the development of a non-invasive liquid biopsy approach for the identification of valuable biomarkers that could significantly improve GB diagnosis and, consequently, patients' prognosis and quality of life.

Keywords: extracellular vesicles; glioblastoma; liquid biopsy.


Conflict of interest statement

Georgios Giamas is the Founder/Chief Scientific Officer of StingrayBio. No other conflicts are declared.

Figures

Figure 1
Figure 1
Experimental pipeline. sEVs from GB patients and healthy volunteers’ blood samples were isolated through UC. The proteomic content of the sEVs were deciphered using mass spectrometry. Figure was created using BioRender.com.
Figure 2
Figure 2
Characterisation of sEVs isolated from GB patients and healthy volunteers. (a) NTA of sEVs. The sEV suspensions from healthy volunteers (HV) (n = 10) and GB patients (n = 15) were diluted 1:50 and infused into a NanoSight NS300 instrument. Five captures of 60 s each were recorded. Particle concentration (particles/mL) and size (nm) were measured. The mean number of particles/mL ± SEM is shown. (b) Mode size (nm) ± SEM of sEVs is shown (healthy volunteers = 10; GB patients = 15). (c) Representative electron microscopy images of GB patient- and healthy volunteer-derived sEVs; 30k magnification was used. White arrows show sEVs. Scale bar = 100 nm. (d) Representative Western blots of GB patient- and healthy volunteer-derived sEVs, showing the presence of protein markers commonly associated with sEV subpopulations. The absence of the Golgi protein marker, GM130, indicates that non-EV cellular components were below the detection threshold. The same protein amounts of sEVs (10 μg) were loaded per lane. (e). ExoView analysis of sEV markers. sEV samples were incubated on microarray chips coated with the indicated antibodies. CD9-, CD63- and CD81-positive particles were detected after probing with a cocktail of fluorescent tetraspanin antibodies using the ExoView R100 platform. Results are the average of 2 healthy volunteer- and 2 GB patient-derived samples. For each sample, three technical replicates were performed. All data were adjusted for the dilution of the sample onto the chip. **** p < 0.0001.
Figure 3
Figure 3
Proteomic analysis of sEV cargo. (a) Hierarchical clustering of protein expression in all experimental samples (i.e., healthy volunteers (HVs) and GB patients (EVs)) using Euclidian distance and average linkage, showing a heat map of protein expression for the respective samples (no protein expression in blue to high protein expression in red) and dendrograms for the hierarchical clustering of samples (horizontal dendrogram) and for proteins (vertical dendrogram), respectively. Cluster analysis was performed with the Morpheus online tool. (https://software.broadinstitute.org/morpheus, last accessed 22 November 2021) [42]. (b) Volcano plot showing the differentially expressed proteins between HVs and EVs with Welch’s t-test p-values < 0.05 and a log2 Welch’s t-test difference of at least 1.5 for upregulated proteins (red dots) and −1.5 for downregulated proteins (blue dots). A volcano plot was created with VolcaNoseR [43]. (c) Venn diagram showing the repartition of the identified MS hits between HVs and EVs. (d) Venn diagram of proteins enriched in GB-derived sEVs compared with proteins annotated in the Vesiclepedia database. (e) Gene enrichment analysis for “biological process” was performed based on MS hits using the FunRich platform. The 20 most significant processes identified are reported.
Figure 4
Figure 4
mRNA evaluation from The Cancer Genome Atlas data: (a) VWF, FCGBP, C3, PROS1, and SERPINA1 showed significant mRNA upregulation in GB compared to healthy-derived samples. Pairwise t-test: *** p < 0.001, **** p < 0.0001. (b) Correlation of mRNA levels between the indicated genes. n.s.: statistically not significant.

References

    1. Louis D.N., Perry A., Reifenberger G., von Deimling A., Figarella-Branger D., Cavenee W.K., Ohgaki H., Wiestler O.D., Kleihues P., Ellison D.W. The 2016 World Health Organization Classification of Tumors of the Central Nervous System: A summary. Acta Neuropathol. 2016;131:803–820. doi: 10.1007/s00401-016-1545-1. - DOI - PubMed
    1. Louis D.N., Perry A., Wesseling P., Brat D.J., Cree I.A., Figarella-Branger D., Hawkins C., Ng H.K., Pfister S.M., Reifenberger G., et al. The 2021 WHO Classification of Tumors of the Central Nervous System: A summary. Neuro Oncol. 2021;23:1231–1251. doi: 10.1093/neuonc/noab106. - DOI - PMC - PubMed
    1. Wesseling P., Capper D. WHO 2016 Classification of gliomas. Neuropathol. Appl. Neurobiol. 2018;44:139–150. doi: 10.1111/nan.12432. - DOI - PubMed
    1. Verhaak R.G., Hoadley K.A., Purdom E., Wang V., Qi Y., Wilkerson M.D., Miller C.R., Ding L., Golub T., Mesirov J.P., et al. Integrated genomic analysis identifies clinically relevant subtypes of glioblastoma characterized by abnormalities in PDGFRA, IDH1, EGFR, and NF1. Cancer Cell. 2010;17:98–110. doi: 10.1016/j.ccr.2009.12.020. - DOI - PMC - PubMed
    1. Cruickshanks N., Zhang Y., Yuan F., Pahuski M., Gibert M., Abounader R. Role and Therapeutic Targeting of the HGF/MET Pathway in Glioblastoma. Cancers. 2017;9:87. doi: 10.3390/cancers9070087. - DOI - PMC - PubMed