Metabolic Status of Lean and Obese Zucker Rats Based on Untargeted and Targeted Metabolomics Analysis of Serum
- PMID: 35052832
- PMCID: PMC8773868
- DOI: 10.3390/biomedicines10010153
Metabolic Status of Lean and Obese Zucker Rats Based on Untargeted and Targeted Metabolomics Analysis of Serum
Abstract
Obesity is growing worldwide epidemic. Animal models can provide some clues about the etiology, development, prevention, and treatment of obesity. We examined and compared serum metabolites between seven lean (L) and seven obese (O) female Zucker rats to investigate the individual serum metabolic profile. A combination of HPLC-UV, HPLC-ECD, and LC-MS revealed more than 400 peaks. The 50 highest quality peaks were selected as the focus of our study. Untargeted metabolomics analysis showed significantly higher mean peak heights for 20 peaks in L rats, generally distributed randomly, except for a cluster (peaks 44-50) where L showed stable dominancy over O. Only eight peaks were significantly higher in O rats. Peak height ratios between pairs of L and O rats were significantly higher at 199 positions in L rats and at 123 positions in O rats. Targeted metabolomics analysis showed significantly higher levels of methionine, cysteine, tryptophan, kynurenic acid, and cysteine/cystine ratio in L rats and significantly higher levels of cystine and tyrosine in O rats. These results contribute to a better understanding of systemic metabolic perturbations in the obese Zucker rat model, emphasizing the value of both whole metabolome and individual metabolic profiles in the design and interpretation of studies using animal models.
Keywords: obesity; serum metabolomics.
Conflict of interest statement
The authors declare no conflict of interest.
Figures

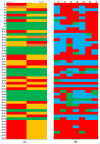
 Significantly (p > 0.05) higher average peak intensity in the group.
  Significantly (p > 0.05) lower average peak intensity in the group.
  No difference between groups.
  Marginal (0.1 < p > 0.05) difference between groups. (Panel B): Pairs of 50 peaks intensity ratio between L and O groups.
  Peak ratio at least 50% higher in the L group.
  Peak ratio at least 50% higher in the O group.
  No difference between groups.
Similar articles
-
Effect of Metformin Treatment on Serum Metabolic Profile Changes in Lean and Obese Zucker Rat Model for Fatty Liver Disease.Biomolecules. 2023 Aug 10;13(8):1234. doi: 10.3390/biom13081234. Biomolecules. 2023. PMID: 37627299 Free PMC article.
-
Systemic Characterization of an Obese Phenotype in the Zucker Rat Model Defining Metabolic Axes of Energy Metabolism and Host-Microbial Interactions.J Proteome Res. 2016 Jun 3;15(6):1897-906. doi: 10.1021/acs.jproteome.6b00090. Epub 2016 May 3. J Proteome Res. 2016. PMID: 27087596
-
Kynurenic acid, an aryl hydrocarbon receptor ligand, is elevated in serum of Zucker fatty rats.Integr Mol Med. 2016;3(4):761-763. Epub 2016 Aug 29. Integr Mol Med. 2016. PMID: 27738521 Free PMC article.
-
Abnormal polyunsaturated lipid metabolism in the obese Zucker rat, with partial metabolic correction by gamma-linolenic acid administration.Metabolism. 1993 Sep;42(9):1127-40. doi: 10.1016/0026-0495(93)90270-x. Metabolism. 1993. PMID: 8412765
-
Effects of a fat substitute, sucrose polyester, on food intake, body composition, and serum factors in lean and obese Zucker rats.Obes Res. 1994 May;2(3):271-8. doi: 10.1002/j.1550-8528.1994.tb00057.x. Obes Res. 1994. PMID: 16353428
Cited by
-
Obesity-Associated NAFLD Coexists with a Chronic Inflammatory Kidney Condition That Is Partially Mitigated by Short-Term Oral Metformin.Nutrients. 2025 Jun 26;17(13):2115. doi: 10.3390/nu17132115. Nutrients. 2025. PMID: 40647220 Free PMC article.
-
Metabolomic Study of Aging in fa/fa Rats: Multiplatform Urine and Serum Analysis.Metabolites. 2023 Apr 12;13(4):552. doi: 10.3390/metabo13040552. Metabolites. 2023. PMID: 37110210 Free PMC article.
-
Determination of the Minimum Sample Amount for Capillary Electrophoresis-Fourier Transform Mass Spectrometry (CE-FTMS)-Based Metabolomics of Colorectal Cancer Biopsies.Biomedicines. 2023 Jun 13;11(6):1706. doi: 10.3390/biomedicines11061706. Biomedicines. 2023. PMID: 37371800 Free PMC article.
-
Intestinal Effects of Filtered Alkalinized Water in Lean and Obese Zucker Rats.Microorganisms. 2024 Feb 2;12(2):316. doi: 10.3390/microorganisms12020316. Microorganisms. 2024. PMID: 38399722 Free PMC article.
-
Effect of Metformin Treatment on Serum Metabolic Profile Changes in Lean and Obese Zucker Rat Model for Fatty Liver Disease.Biomolecules. 2023 Aug 10;13(8):1234. doi: 10.3390/biom13081234. Biomolecules. 2023. PMID: 37627299 Free PMC article.
References
-
- [(accessed on 5 October 2021)]. Available online: https://www.who.int/news-room/fact-sheets/detail/obesity-and-overweight.
-
- Overweight & Obesity. Center for Disease Control and Prevention Website. Updated 18 June 2019. [(accessed on 19 June 2019)]; Available online: http://www.cdc.gov/obesity/index.html.
-
- [(accessed on 5 October 2021)]; Available online: https://www.cdc.gov/obesity/data/adult.html.
-
- Apovian C.M. Obesity: Definition, comorbidities, causes, and burden. Am. J. Manag. Care. 2016;22((Suppl. 7)):s176–s185. - PubMed
LinkOut - more resources
Full Text Sources

