. 2022 Jan 13;10(1):169.
doi: 10.3390/biomedicines10010169.

Diagnostic Blood Biomarkers in Alzheimer's Disease

Affiliations

Diagnostic Blood Biomarkers in Alzheimer's Disease

Jung Eun Park et al. Biomedicines. .

Abstract

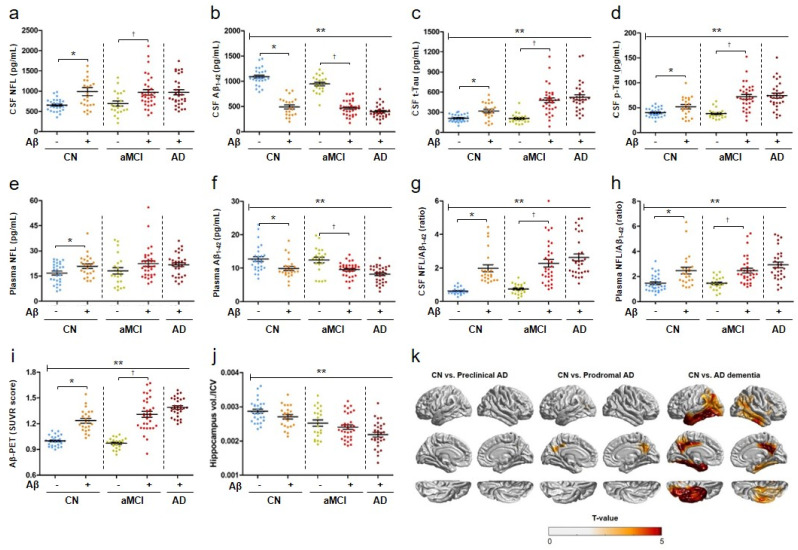
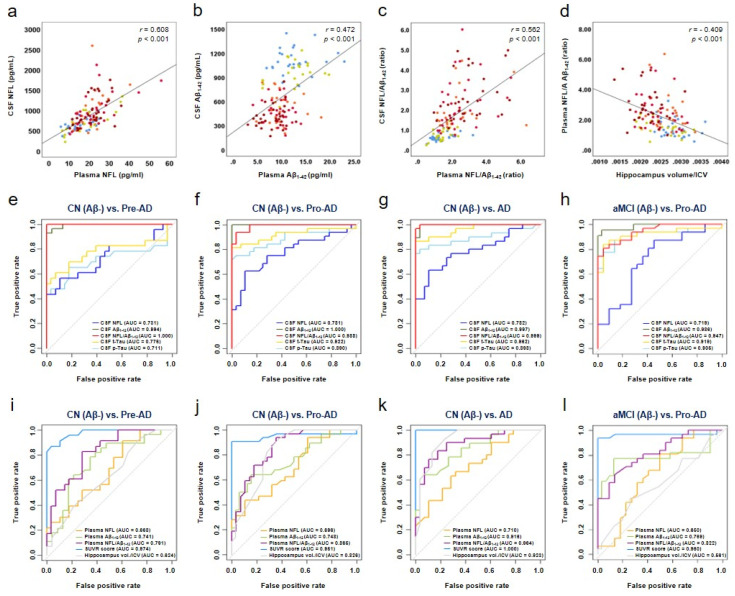
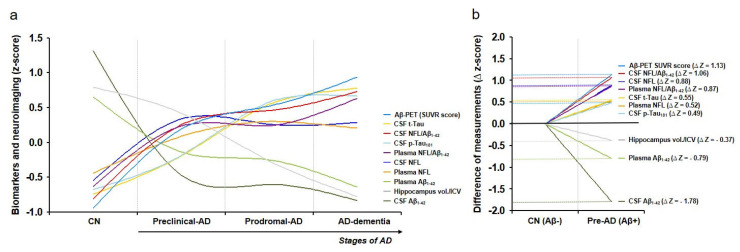
Potential biomarkers for Alzheimer's disease (AD) include amyloid β1-42 (Aβ1-42), t-Tau, p-Tau181, neurofilament light chain (NFL), and neuroimaging biomarkers. Their combined use is useful for diagnosing and monitoring the progress of AD. Therefore, further development of a combination of these biomarkers is essential. We investigated whether plasma NFL/Aβ1-42 can serve as a plasma-based primary screening biomarker reflecting brain neurodegeneration and amyloid pathology in AD for monitoring disease progression and early diagnosis. We measured the NFL and Aβ1-42 concentrations in the CSF and plasma samples and performed correlation analysis to evaluate the utility of these biomarkers in the early diagnosis and monitoring of AD spectrum disease progression. Pearson's correlation analysis was used to analyse the associations between the fluid biomarkers and neuroimaging data. The study included 136 participants, classified into five groups: 28 cognitively normal individuals, 23 patients with preclinical AD, 22 amyloid-negative patients with amnestic mild cognitive impairment, 32 patients with prodromal AD, and 31 patients with AD dementia. With disease progression, the NFL concentrations increased and Aβ1-42 concentrations decreased. The plasma and CSF NFL/Aβ1-42 were strongly correlated (r = 0.558). Plasma NFL/Aβ1-42 was strongly correlated with hippocampal volume/intracranial volume (r = 0.409). In early AD, plasma NFL/Aβ1-42 was associated with higher diagnostic accuracy than the individual biomarkers. Moreover, in preclinical AD, plasma NFL/Aβ1-42 changed more rapidly than the CSF t-Tau or p-Tau181 concentrations. Our findings highlight the utility of plasma NFL/Aβ1-42 as a non-invasive plasma-based biomarker for early diagnosis and monitoring of AD spectrum disease progression.

Keywords: Alzheimer’s disease; Aβ1–42; NFL; combinatorial biomarkers; plasma biomarkers.


Conflict of interest statement

The authors have no conflict of interest to declare.

Figures

Figure 1
Figure 1
Biomarker concentrations in the CSF, plasma, and neuroimaging data. Data are presented as mean values of ATN (amyloid, tau, and neurodegeneration) biomarker concentrations in the CSF (ad), plasma neurofilament light chain (NFL) concentrations (e), plasma Aβ1–42 concentrations (f), CSF NFL/Aβ1–42 (g), plasma NFL/Aβ1–42 (h), standard uptake value ratio (SUVR) scores (i), and value of hippocampal volume/intracranial volume (ICV) (j). Statistical analysis was performed using SPSS version 25. ** p < 0.001, statically significant group effect by ANOVA [groups: cognitively normal (CN) (n = 51), amnestic mild cognitive impairment (aMCI) (n = 54), and Alzheimer’s disease (AD) dementia (n = 31)]. * p < 0.005, p < 0.05, significant difference between two indicated groups using ANCOVA adjusted for age and sex. (k) Brain cortical atrophy patterns as t-value maps in the preclinical AD, prodromal AD, and AD dementia groups. Preclinical AD (CN Aβ+) (n = 23), prodromal AD (aMCI Aβ+) (n = 32), and AD dementia (AD Aβ+) (n = 30) groups were compared with the CN Aβ− (n = 28) group to observe differences in point-wise cortical thickness using a general linear model with adjustments for age, sex, and field strength as covariates. Greater cortical atrophy was observed in the AD dementia group.
Figure 2
Figure 2
Correlation analysis, ROC curves, and biomarker dynamics. Pearson’s correlation analysis was used to analyse the correlations among CSF neurofilament light chain (NFL) and plasma NFL concentrations (a), CSF Aβ1–42 and plasma Aβ1–42 concentrations (b), CSF NFL/Aβ1–42 and plasma NFL/Aβ1–42 (c), and plasma NFL/Aβ1–42 and hippocampal volume/intracranial volume (ICV) (d). Representative ROC curves and AUC values are shown for indicated diagnostic groups (el). CSF and plasma biomarkers and neuroimaging dynamics as the standard uptake value ratio (SUVR) scores. Symbols: sky blue circle, CN(Aβ−); orange circle, Pre-AD; light green circle, aMCI(Aβ−); red circle, Pro-AD; dark red circle, AD.
Figure 3
Figure 3
Dynamics of measurement. To compare biomarkers and neuroimaging data with different dynamic ranges, measurements were converted to z-scores (mean values of normalized biomarker levels of each group) based on the distribution in this study cohort. The plot indicates the mean z-scores for a given biomarker connected across progressively more affected diagnostic groups by a smoothing spin line using SigmaPlot 10.0 (a). The ∆z-score was calculated to compare the z-score differences between the cognitively normal (CN Aβ− and preclinical AD (CN Aβ+) groups (b).

References

    1. Bureau USC An Aging World: 2020. [(accessed on 1 March 2021)]; Available online: https://mtgis-portal.geo.census.gov/arcgis/apps/MapSeries/index.html?app....
    1. Bronzuoli M.R., Iacomino A., Steardo L., Scuderi C. Targeting neuroinflammation in Alzheimer’s disease. J. Inflamm. Res. 2016;9:199–208. doi: 10.2147/JIR.S86958. - DOI - PMC - PubMed
    1. Ballard C., Gauthier S., Corbett A., Brayne C., Aarsland D., Jones E. Alzheimer’s disease. Lancet. 2011;377:1019–1031. doi: 10.1016/S0140-6736(10)61349-9. - DOI - PubMed
    1. Duong S., Patel T., Chang F. Dementia: What pharmacists need to know. Can. Pharm. J. 2017;150:118–129. doi: 10.1177/1715163517690745. - DOI - PMC - PubMed
    1. Huang L.K., Chao S.P., Hu C.J. Clinical trials of new drugs for Alzheimer disease. J. Biomed. Sci. 2020;27:18. doi: 10.1186/s12929-019-0609-7. - DOI - PMC - PubMed

LinkOut - more resources