Environment-Dependent Heterosis and Transgressive Gene Expression in Reciprocal Hybrids between the Channel Catfish Ictalurus punctatus and the Blue Catfish Ictalurus furcatus
- PMID: 35053114
- PMCID: PMC8772901
- DOI: 10.3390/biology11010117
Environment-Dependent Heterosis and Transgressive Gene Expression in Reciprocal Hybrids between the Channel Catfish Ictalurus punctatus and the Blue Catfish Ictalurus furcatus
Abstract
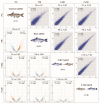
The hybrid between female channel catfish (Ictalurus punctatus) and male blue catfish (Ictalurus furcatus) is superior in feed conversion, disease resistance, carcass yield, and harvestability compared to both parental species. However, heterosis and heterobeltiosis only occur in pond culture, and channel catfish grow much faster than the other genetic types in small culture units. This environment-dependent heterosis is intriguing, but the underlying genetic mechanisms are not well understood. In this study, phenotypic characterization and transcriptomic analyses were performed in the channel catfish, blue catfish, and their reciprocal F1s reared in tanks. The results showed that the channel catfish is superior in growth-related morphometrics, presumably due to significantly lower innate immune function, as investigated by reduced lysozyme activity and alternative complement activity. RNA-seq analysis revealed that genes involved in fatty acid metabolism/transport are significantly upregulated in channel catfish compared to blue catfish and hybrids, which also contributes to the growth phenotype. Interestingly, hybrids have a 40-80% elevation in blood glucose than the parental species, which can be explained by a phenomenon called transgressive expression (overexpression/underexpression in F1s than the parental species). A total of 1140 transgressive genes were identified in F1 hybrids, indicating that 8.5% of the transcriptome displayed transgressive expression. Transgressive genes upregulated in F1s are enriched for glycan degradation function, directly related to the increase in blood glucose level. This study is the first to explore molecular mechanisms of environment-dependent heterosis/heterobeltiosis in a vertebrate species and sheds light on the regulation and evolution of heterosis vs. hybrid incompatibility.
Keywords: RNA-Seq; aquaculture; environment; heterobeltiosis; heterosis; transcriptomics; transgressive genes.
Conflict of interest statement
The authors declare no conflict of interest.
Figures


Similar articles
-
Chromosome-level assembly and annotation of the blue catfish Ictalurus furcatus, an aquaculture species for hybrid catfish reproduction, epigenetics, and heterosis studies.Gigascience. 2022 Jul 9;11:giac070. doi: 10.1093/gigascience/giac070. Gigascience. 2022. PMID: 35809049 Free PMC article.
-
Transcriptome analysis revealed potential mechanisms of channel catfish growth advantage over blue catfish in a tank culture environment.Front Genet. 2024 Apr 29;15:1341555. doi: 10.3389/fgene.2024.1341555. eCollection 2024. Front Genet. 2024. PMID: 38742167 Free PMC article.
-
Growth of channel catfish (Ictalurus punctatus), blue catfish (I. furcatus), and their F1, F2, F3, and F1 reciprocal backcross hybrids in earthen ponds.J Anim Sci. 2014 Oct;92(10):4297-305. doi: 10.2527/jas.2013-7549. Epub 2014 Aug 22. J Anim Sci. 2014. PMID: 25149342
-
From heterosis to outbreeding depression: genotype-by-environment interaction shifts hybrid fitness in opposite directions.Genetics. 2024 Aug 7;227(4):iyae090. doi: 10.1093/genetics/iyae090. Genetics. 2024. PMID: 38809057
-
Transcriptome Analysis Reveals Key Gene Expression Changes in Blue Catfish Sperm in Response to Cryopreservation.Int J Mol Sci. 2022 Jul 10;23(14):7618. doi: 10.3390/ijms23147618. Int J Mol Sci. 2022. PMID: 35886966 Free PMC article.
Cited by
-
The diverse effects of phenotypic dominance on hybrid fitness.Evolution. 2022 Dec;76(12):2846-2863. doi: 10.1111/evo.14645. Epub 2022 Oct 27. Evolution. 2022. PMID: 36221216 Free PMC article.
-
Transcriptome and Genome Analyses Applied to Aquaculture Research.Biology (Basel). 2022 Sep 4;11(9):1312. doi: 10.3390/biology11091312. Biology (Basel). 2022. PMID: 36138791 Free PMC article.
-
Chromosome-level assembly and annotation of the blue catfish Ictalurus furcatus, an aquaculture species for hybrid catfish reproduction, epigenetics, and heterosis studies.Gigascience. 2022 Jul 9;11:giac070. doi: 10.1093/gigascience/giac070. Gigascience. 2022. PMID: 35809049 Free PMC article.
-
Transcriptome analysis revealed potential mechanisms of channel catfish growth advantage over blue catfish in a tank culture environment.Front Genet. 2024 Apr 29;15:1341555. doi: 10.3389/fgene.2024.1341555. eCollection 2024. Front Genet. 2024. PMID: 38742167 Free PMC article.
-
Growth Superiority and Genetic Characterization of the Hybrid from Female Ussuri Catfish (Pseudobagrus ussuriensis) and Male Longsnout Catfish (Leiocassis longirostris).Animals (Basel). 2024 Dec 15;14(24):3617. doi: 10.3390/ani14243617. Animals (Basel). 2024. PMID: 39765521 Free PMC article.
References
-
- Darwin C. The Works of Charles Darwin, Volume 25: The Effects of Cross and Self Fertilization in the Vegetable Kingdom. NYU Press; New York, NY, USA: 2010.
-
- Dunham R.A., Smitherman R.O. Crossbreeding channel catfish for improvement of body weight in earthen ponds. Growth. 1983;47:97–103. - PubMed
-
- Dunham R.A. Aquaculture and Fisheries Biotechnology: Genetic Approaches. 2nd ed. CABI; Wallingford, UK: 2011. pp. 1–495.
Grants and funding
LinkOut - more resources
Full Text Sources
Molecular Biology Databases

