Review
. 2022 Jan 17;11(1):149.
doi: 10.3390/biology11010149.

Breeding for Economically and Environmentally Sustainable Wheat Varieties: An Integrated Approach from Genomics to Selection

Affiliations
Review

Breeding for Economically and Environmentally Sustainable Wheat Varieties: An Integrated Approach from Genomics to Selection

Etienne Paux et al. Biology (Basel). .

Abstract

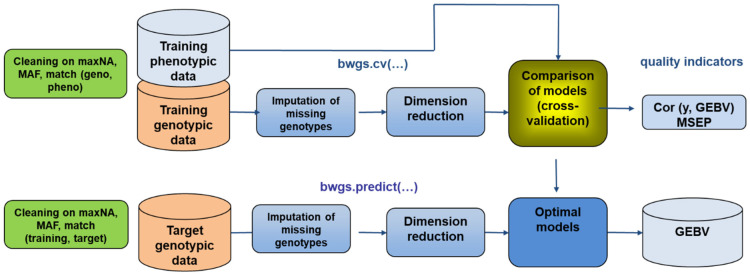
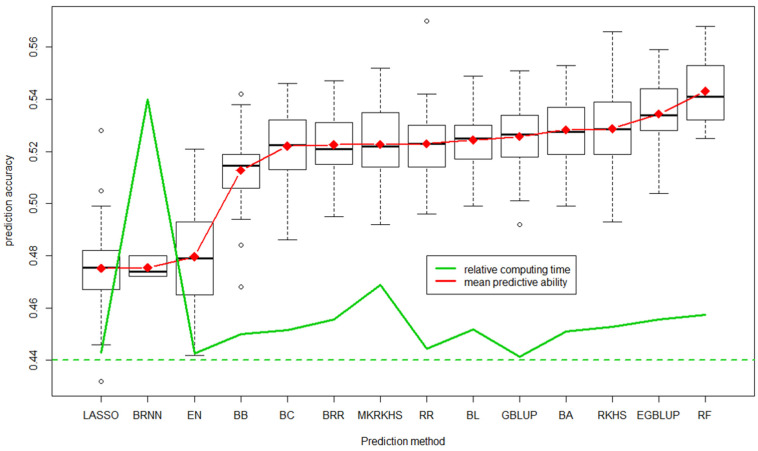
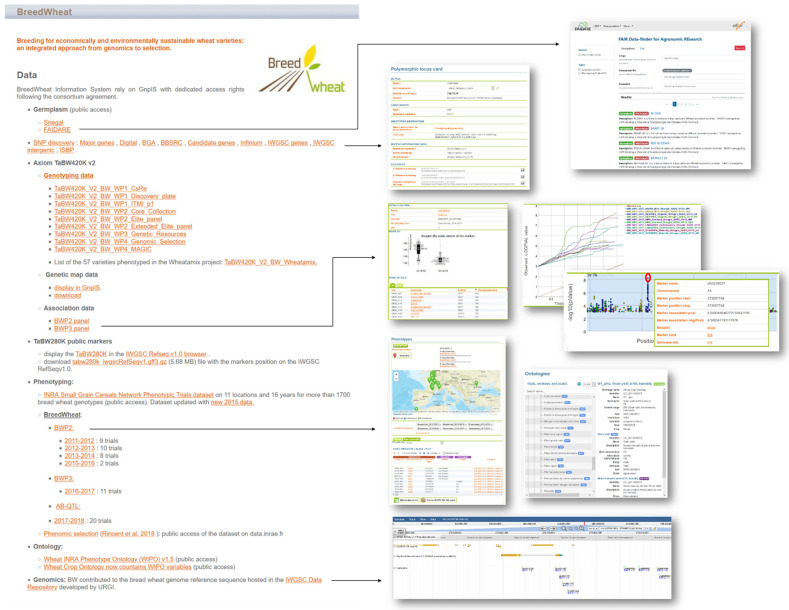
There is currently a strong societal demand for sustainability, quality, and safety in bread wheat production. To address these challenges, new and innovative knowledge, resources, tools, and methods to facilitate breeding are needed. This starts with the development of high throughput genomic tools including single nucleotide polymorphism (SNP) arrays, high density molecular marker maps, and full genome sequences. Such powerful tools are essential to perform genome-wide association studies (GWAS), to implement genomic and phenomic selection, and to characterize the worldwide diversity. This is also useful to breeders to broaden the genetic basis of elite varieties through the introduction of novel sources of genetic diversity. Improvement in varieties particularly relies on the detection of genomic regions involved in agronomical traits including tolerance to biotic (diseases and pests) and abiotic (drought, nutrient deficiency, high temperature) stresses. When enough resolution is achieved, this can result in the identification of candidate genes that could further be characterized to identify relevant alleles. Breeding must also now be approached through in silico modeling to simulate plant development, investigate genotype × environment interactions, and introduce marker-trait linkage information in the models to better implement genomic selection. Breeders must be aware of new developments and the information must be made available to the world wheat community to develop new high-yielding varieties that can meet the challenge of higher wheat production in a sustainable and fluctuating agricultural context. In this review, we compiled all knowledge and tools produced during the BREEDWHEAT project to show how they may contribute to face this challenge in the coming years.

Keywords: Triticum aestivum; diversity; genomic selection; high throughput phenotyping; molecular tools; wheat; wheat breeding; wheat database.


Conflict of interest statement

The authors declare no conflict of interest.

Figures

Figure 1
Figure 1
Evolution of bread wheat grain yield from 1960 to 2021 in France. A bi-linear regression model was fitted (blue dotted line) for grain yield using the segmented R package [7] with default settings. The value of the breaking point and the values of slope and standard deviation of the residuals (RSD) are indicated for each period. Data were from the Agreste database (https://agreste.agriculture.gouv.fr/agreste-web/accueil/ (accessed on 31 October 2021)).
Figure 2
Figure 2
Temporal evolution of worldwide genetic diversity. PCoA calculated with 8741 haplotypes (A) on 4403 accessions, (B) on 139 Southeast Asia and Indian Peninsula landraces, (C) on 632 landraces, (D) on 947 traditional cultivars, and (E) on 2210 modern varieties. The different colors correspond to the 11 groups defined with a phylogenetic analysis [16]. Group I: modern lines, Southeast Europe; Group II: Northwest Europe, North America; Group III: North America, Southeast Europe; Group IV: Northwest Mediterranean; Group V: modern lines, China, Italy; Group VI: modern lines, CIMMYT, Northwest China; Group VII: modern lines, Canada, China, USA; Group VIII: Southeast Asia, India, Pakistan; Group IX: China, Japan; Group X: modern lines, France, UK; Group XI: France, Germany. (F) Geographical projection of the first axis of the PCoA for 2210 modern varieties.
Figure 3
Figure 3
Principal coordinate analysis (PCoA) of bread wheat accessions calculated with TaBW410 SNP markers. (A) in grey, 4506 worldwide accessions of the INRAE Biological Resource Center, in red, 220 elite European winter varieties (BWP2 panel). (B) in grey, 4506 worldwide accessions of the INRAE Biological Resource Center, in black, a sub-sample of 450 winter wheat accessions selected based on plant height, heading date, and SNP markers, designed for association studies (BWP3 panel).
Figure 4
Figure 4
Different phenotyping systems used within the BREEDWHEAT project. From left to right: UAV equipped with a multispectral camera; Phenomobile V1 for crops lower than 1.2 m in height; Phenomobile V2 for crops up to 3 m in height; and the gantry system set up on PhenoField [95].
Figure 5
Figure 5
Workflow of the two main functions of the BREEDWHEAT Genomic Selection (BWGS) software. Function bwgs.cv() derives model cross-validation on a training set and function bwgs.predict() conducts model calibration on a training set and GEBV prediction of a target set of genotypes. MAF: minor allele frequency, maxNA: maximum % of marker missing data, MSEP: mean square error of prediction, GEBV: genomic estimated breeding value.
Figure 6
Figure 6
Distribution of predictive ability of the 100 replicates for each of the 14 methods ordered based on average predictive accuracy [120]. Average is shown in red and relative computing time in green. LASSO: least absolute shrinkage and selection operator, BRNN: Bayesian regularization for feed-forward neural network, EN: elastic net, BB: Bayes B, BC: Bayes C, BRR: Bayesian ridge regression, MRKHS: multiple RKHS, RR: ridge regression, BL: Bayesian LASSO, GBLUP: genomic best linear unbiased prediction, BA: Bayes A, RKHS: reproductive Kernel Hilbert space, EGBLUP: epistatic GBLUP, RF: random forest. The box are interquartile limits, dashed traits the 95% distribution and ° the outliers.
Figure 7
Figure 7
BREEDWHEAT data summary webpage (https://wheat-urgi.versailles.inrae.fr/Projects/BreedWheat (accessed on 16 December 2021)) with some examples of GnpIS web interface results.

References

    1. Godfray H.C.J., Beddington J.R., Crute I.R., Haddad L., Lawrence D., Muir J.F., Pretty J., Robinson S., Thomas S.M., Toulmin C. Food security: The challenge of feeding 9 billion people. Science. 2010;327:812–818. doi: 10.1126/science.1185383. - DOI - PubMed
    1. . Wheat lag. Nature. 2014;507:399–400. doi: 10.1038/507399b. - DOI - PubMed
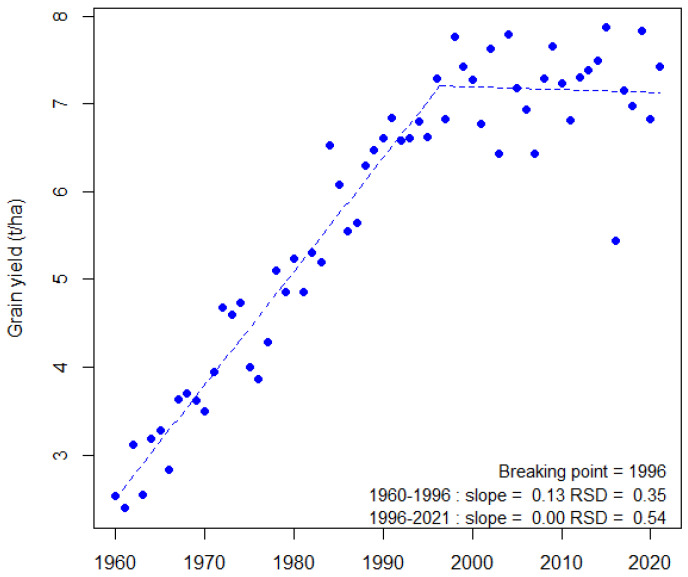
    1. Brisson N., Gate G., Gouache D., Charmet G., Oury F.-X., Huard F. Why are wheat yields stagnating in Europe? A comprehensive data analysis for France. Field Crops Res. 2010;119:201–212. doi: 10.1016/j.fcr.2010.07.012. - DOI
    1. Porter J.R., Semenov M.A. Crop responses to climatic variation. Philos. Trans. R. Soc. B-Biol. Sci. 2005;360:2021–2035. doi: 10.1098/rstb.2005.1752. - DOI - PMC - PubMed
    1. Tester M., Langridge P. Breeding technologies to increase crop production in a changing world. Science. 2010;327:818–822. doi: 10.1126/science.1183700. - DOI - PubMed

LinkOut - more resources