. 2022 Jan 11;11(2):227.
doi: 10.3390/cells11020227.

Evolutionary Origin of Insulin-Degrading Enzyme and Its Subcellular Localization and Secretion Mechanism: A Study in Microglial Cells

Affiliations

Evolutionary Origin of Insulin-Degrading Enzyme and Its Subcellular Localization and Secretion Mechanism: A Study in Microglial Cells

Miriam Corraliza-Gómez et al. Cells. .

Abstract

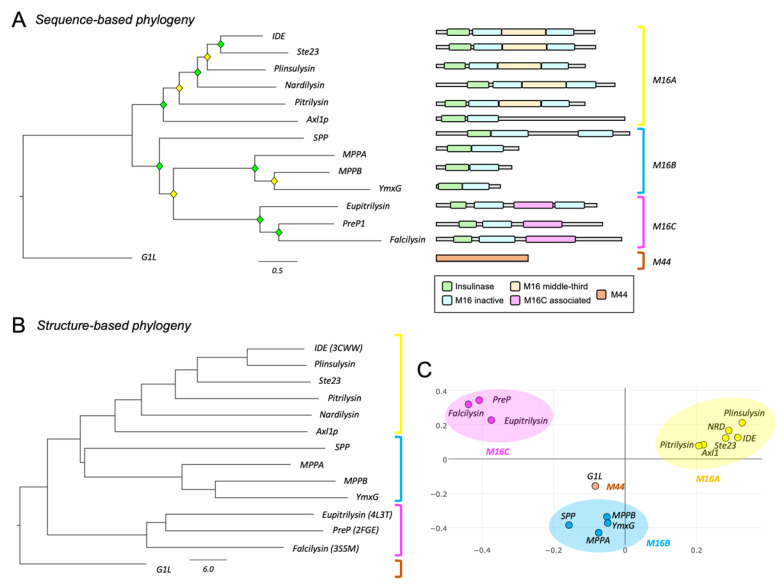
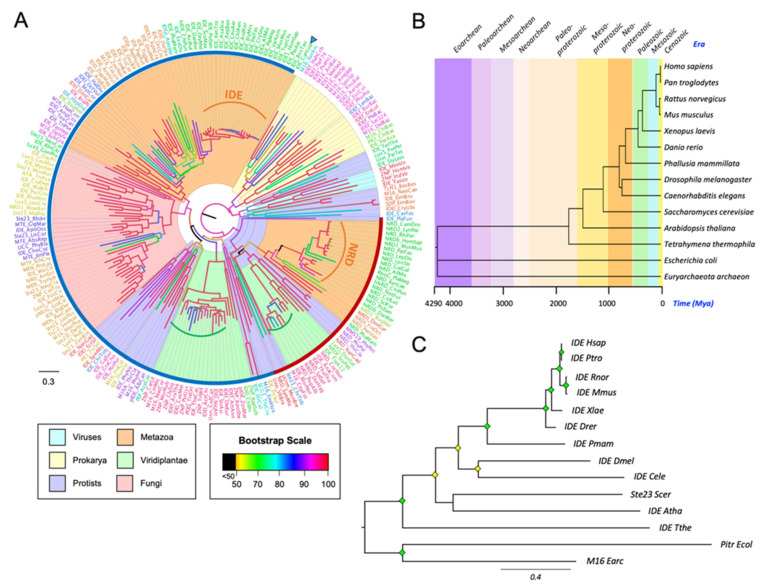
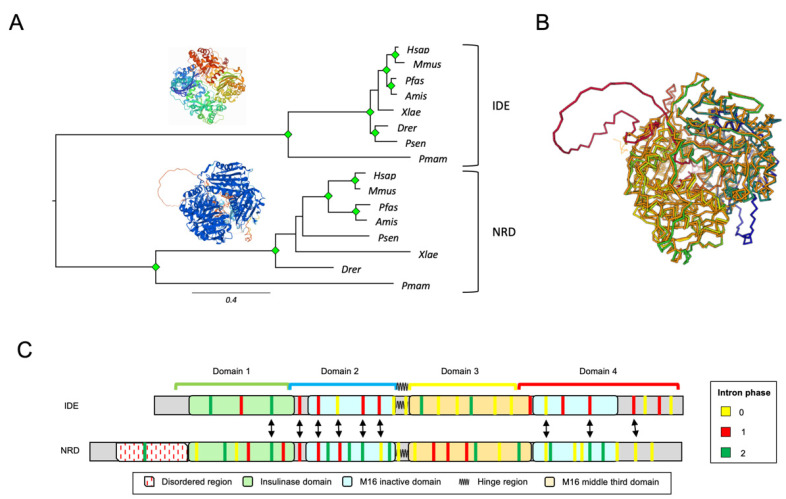
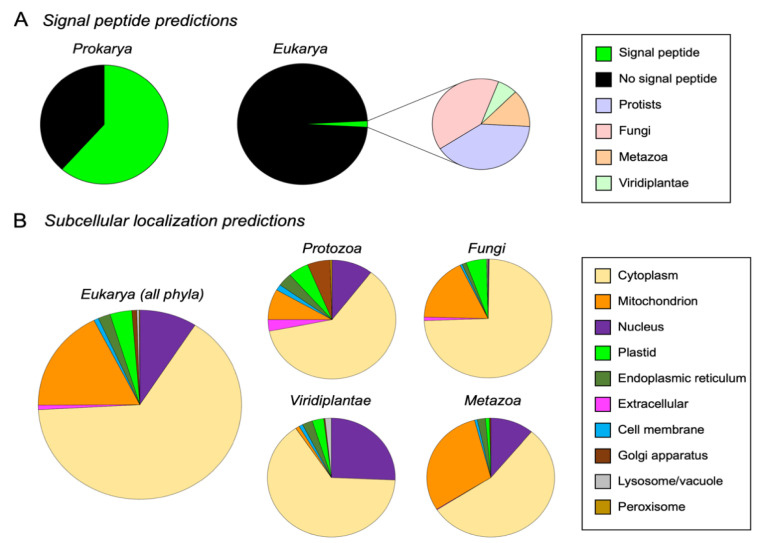
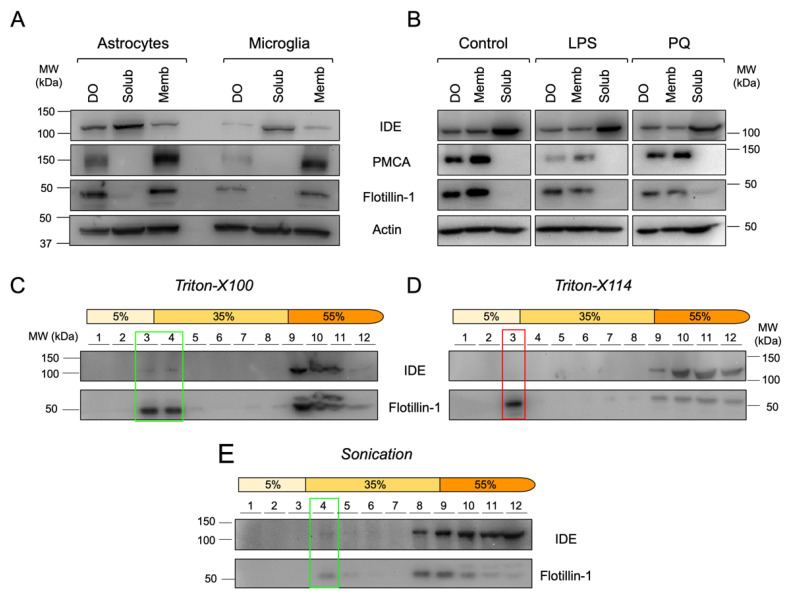
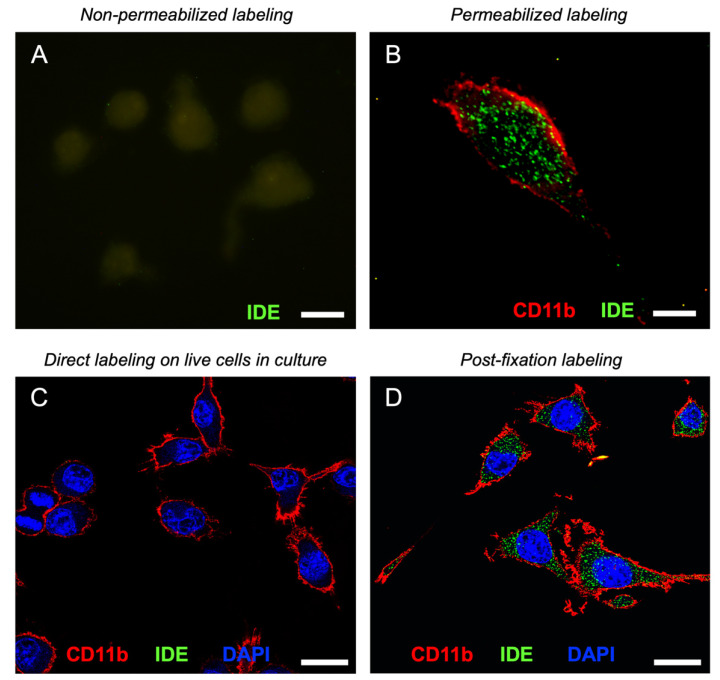
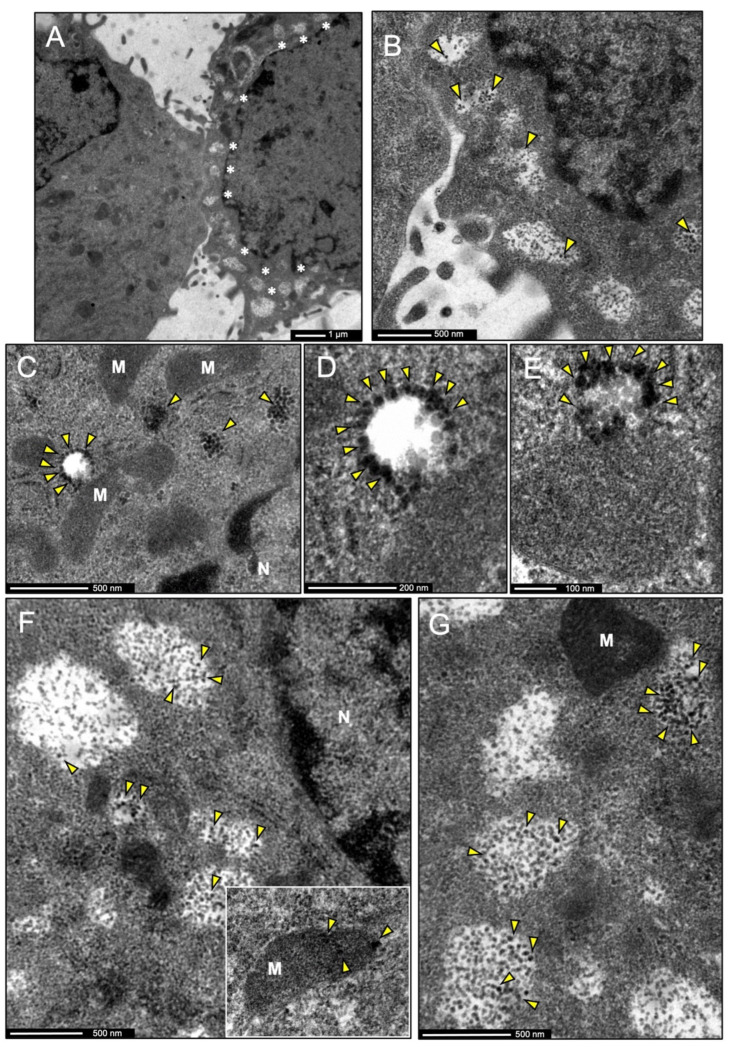
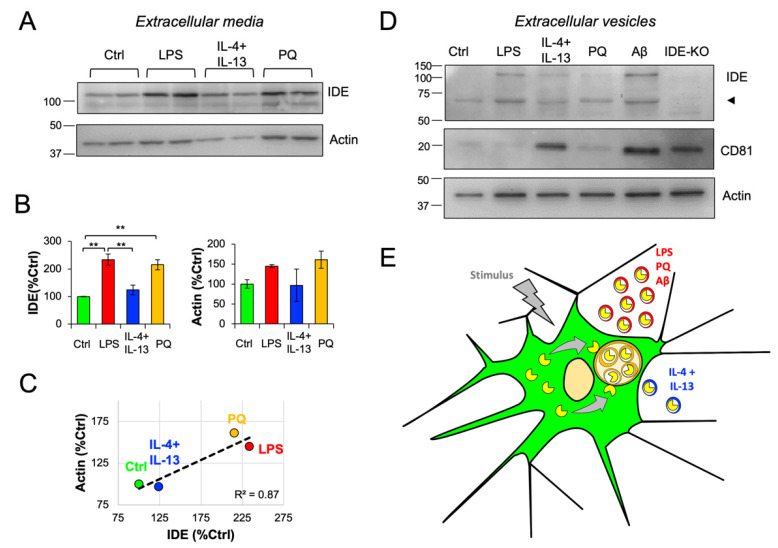
The insulin-degrading enzyme (IDE) is a zinc-dependent metalloendopeptidase that belongs to the M16A metalloprotease family. IDE is markedly expressed in the brain, where it is particularly relevant due to its in vitro amyloid beta (Aβ)-degrading activity. The subcellular localization of IDE, a paramount aspect to understand how this enzyme can perform its proteolytic functions in vivo, remains highly controversial. In this work, we addressed IDE subcellular localization from an evolutionary perspective. Phylogenetic analyses based on protein sequence and gene and protein structure were performed. An in silico analysis of IDE signal peptide suggests an evolutionary shift in IDE exportation at the prokaryote/eukaryote divide. Subcellular localization experiments in microglia revealed that IDE is mostly cytosolic. Furthermore, IDE associates to membranes by their cytoplasmatic side and further partitions between raft and non-raft domains. When stimulated, microglia change into a secretory active state, produces numerous multivesicular bodies and IDE associates with their membranes. The subsequent inward budding of such membranes internalizes IDE in intraluminal vesicles, which later allows IDE to be exported outside the cells in small extracellular vesicles. We further demonstrate that such an IDE exportation mechanism is regulated by stimuli relevant for microglia in physiological conditions and upon aging and neurodegeneration.

Keywords: amyloid β; extracellular vesicles; inflammatory state; insulin-degrading enzyme; intron-exon structure; lipid rafts; microglia; molecular evolution; oxidative stress; phylogeny.


Conflict of interest statement

The authors declare no conflict of interest.

Figures

Figure 1
Figure 1
Phylogenetic analyses of the clan ME of metallopeptidases. (A) Phylogenetic relationships based on protein sequence alignments. A Maximum Likelihood (ML) phylogenetic tree was constructed with 14 representative metallopeptidases of clan ME, using a substitution model LG + F + I + G4, according to Bayesian Information Criterion (BIC). Diamonds label nodes with a bootstrap value >60% (yellow) and >80% (green). Scale branch length represents number of amino acid substitutions per site. Domain arrangement for each protein, retrieved from Pfam and HMMER databases, is shown on the right. (B) Phylogenetic relationships of clan ME proteins based on protein structure. Structures were retrieved from Protein Data Bank (PDB) or predicted using either AlphaFold or SwissProt 3D online servers. Dendrogram depicts the relationships of clan ME metallopeptidases structurally aligned. Scale branch represents distances obtained from the Dali similarity matrix. (C) Correspondence analysis clustering proteins with the most similar structural neighbor near each other.
Figure 2
Figure 2
Global phylogeny of M16A proteins. (A) A phylogenetic tree was reconstructed from a protein sequence-based MSA of 216 IDE homologs. The substitution model LG + I + G4 was chosen according to BIC, and the tree was inferred using an ML method. Major species groups are highlighted by different colors as indicated. Arrowhead points to the only Archaea representative. Brown and blue arches encompass NRD and IDE monophyletic clades, respectively. Curved brackets highlight clades with short branches (low divergence) for some M16A plant proteins (green brackets) and for some members of the IDE and NRD clades (orange brackets). (B) Phylogeny and evolution timescale of the 14 organisms selected for IDE phylogeny. (C) Phylogenetic tree of 14 IDE-like proteins reconstructed from a protein sequence-based Multiple Sequence Alignment (MSA) and an ML method (substitution model LG + I + G4, chosen according to BIC). Diamonds label nodes with a bootstrap value >60% (yellow) and >80% (green). Scale branch length represents number of amino acid substitutions per site. Members of the prokaryote kingdom were selected as the outgroup.
Figure 3
Figure 3
IDE and NRD comparison in chordates. (A) Phylogenetic relationships of IDE and NRD in 8 selected species of Chordata. The tree was built from protein sequence-based MSAs and an ML method (substitution model: LG + G4). Protein structures depicted are 3CWW for IDE and a prediction from the AlphaFold database for NRD. Green diamonds label nodes with a bootstrap value >80%. (B) Superimposition of 3D structures of IDE (in orange) and NRD (rainbow colors) resultant from a structural alignment on the Dali Server. (C) Intronic architecture of IDE and NRD genes mapped onto a multiple protein sequence alignment in which proteins are represented by their constituent domains. Equivalent introns (with a distance less than 5 residues) are pointed out by arrows.
Figure 4
Figure 4
Bioinformatic predictions on M16A cellular localization. (A) N-terminal signal peptide predictions in prokaryotic and eukaryotic M16A sequences. A total of 61.5% of IDE-like sequences have signal peptide in prokaryotes, while only 1.7% of eukaryotic sequences possess this protein trait. (B) Subcellular localization predictions for IDE-like eukaryotic proteins, depicted collectively in all phyla (left graph) or individually in each phylum (right graphs).
Figure 5
Figure 5
IDE is stably associated to membranes of primary glial cells and to membrane microdomains with specific physicochemical properties in the microglial cell line BV-2. (A) Immunoblot analyses of primary glial cells upon centrifugal fractionation in dense organelles (DO), membrane (Memb) and soluble (Solub) fractions. (B) Immunoblot analyses of BV-2 microglial cells treated with different stimuli (100 ng/mL LPS or 25 μM PQ for 24 h) and fractionated in DO, Memb and Solub fractions. (CE) Immunoblot analyses of membrane fractionation into lipid rafts and non-raft domains using different methods: Triton-X100 (C), Triton-X114 (D) and sonication (E). Flot-1 was used as a lipid raft marker. Rectangles highlight the lipid raft fractions.
Figure 6
Figure 6
IDE associates to membranes only at the cytoplasmic side. (A,B) Representative fluorescence microscopy images of IDE signal in non-permeabilized (A) and permeabilized (B) BV-2 cells. Only background autofluorescence can be detected in (A). Image (B) shows a deconvolved projection of a Z-stack. (C,D) Representative confocal sections of IDE and CD11b signal after direct labeling of live cells in culture (C) and in post-fixation and permeabilization labeled cells (D). Calibration bars in (A,B): 10 µm, (C,D): 20 µm.
Figure 7
Figure 7
Immunoelectron microscopy micrographs of the subcellular localization of IDE in BV-2 microglial cells. IDE labeling is shown by means of silver-enhanced gold particles. (A) Representative image of the two types of BV-2 cells found in EM sections, some with scarce vesicles (left) and others with numerous vesicles (right, pointed out by white asterisks). IDE labeling was only detected in cells with multiple vesicles. (B) Inset from (A), showing a closer view of the vesicles and the IDE signal (arrowheads). (CE) Representative images of immunogold labeling of IDE in small multivesicular bodies (MVBs) and their nascent and internal microvesicles (arrowheads). (F,G) Images showing larger MVBs, generally found closer to the cell surface (as in B), with IDE labeling in microvesicles inside them (arrowheads). The inset in F shows the only example of mitochondrion with IDE signal found in our samples. Abbreviations: M = Mitochondria, N = Nucleus. IDE labeling is pointed by yellow arrowheads.
Figure 8
Figure 8
IDE exportation in extracellular vesicles is dependent on microglial activation state. Primary microglia were treated for 24 h with different stimuli, and conditioned media were collected and analyzed. (A) Immunoblot analyses of concentrated conditioned media. (B) Quantification of extracellular IDE and actin proteins from n = 3 independent experiments. Statistical differences were assessed by one-way ANOVA (IDE: p < 0.001 Actin: p = 0.25) followed by post-hoc Bonferroni t-tests. **, p < 0.01. (C) Scatterplot representing the amount of extracellular IDE and actin. Both proteins show a positive correlation (linear regression fit: y = 0.45x + 49.28; R2 = 0.87). (D) Immunoblot analyses of extracellular vesicles (EVs) preparations. Two pools of conditioned media originating from 4 independent cultures were analyzed. EVs from IDE-KO microglia were included as negative controls for the IDE antibody. The arrowhead points out a putative “half-IDE” form of 60 kDa. CD81 and actin were analyzed as EVs markers. (E) Proposed mechanism for IDE exportation in microglial cells. Under unstimulated conditions, IDE is mostly cytosolic. When stimulated, microglia changes into a “secretory active” state, produces numerous MVBs and IDE associates with their membrane and becomes internalized in microvesicles. This allows IDE to be exported outside the cells in small extracellular vesicles (exosomes). Such IDE exportation depends on stimuli relevant in physiological conditions and upon aging and neurodegeneration.

References

    1. Broh-Kahn R., Mirsky I. The Inactivation of Insulin by Tissue Extracts; the Effect of Fasting on the Insulinase Content of Rat Liver. Arch. Biochem. 1949;20:10–14. - PubMed
    1. Hooper N.M. Families of Zinc metalloproteases. FEBS Lett. 1994;354:1–6. doi: 10.1016/0014-5793(94)01079-X. - DOI - PubMed
    1. Rawlings N.D., Morton F.R., Kok C.Y., Kong J., Barrett A.J. MEROPS: The peptidase database. Nucleic Acids Res. 2007;36:D320–D325. doi: 10.1093/nar/gkm954. - DOI - PMC - PubMed
    1. Rawlings N.D., Barrett A.J. Handbook of Proteolytic Enzymes. Elsevier; Amsterdam, The Netherlands: 2013. Introduction: Metallopeptidases and Their Clans; pp. 325–370.
    1. Kuo W.L., Montag A.G., Rosner M.R. Insulin-degrading enzyme is differentially expressed and developmentally regulated in various rat tissues. Endocrinology. 1993;132:604–611. doi: 10.1210/endo.132.2.7678795. - DOI - PubMed

Publication types

LinkOut - more resources