. 2022 Jan 11;11(2):238.
doi: 10.3390/cells11020238.

Accelerated Aging Characterizes the Early Stage of Alzheimer's Disease

Affiliations

Accelerated Aging Characterizes the Early Stage of Alzheimer's Disease

Alessandro Leparulo et al. Cells. .

Abstract

For Alzheimer's disease (AD), aging is the main risk factor, but whether cognitive impairments due to aging resemble early AD deficits is not yet defined. When working with mouse models of AD, the situation is just as complicated, because only a few studies track the progression of the disease at different ages, and most ignore how the aging process affects control mice. In this work, we addressed this problem by comparing the aging process of PS2APP (AD) and wild-type (WT) mice at the level of spontaneous brain electrical activity under anesthesia. Using local field potential recordings, obtained with a linear probe that traverses the posterior parietal cortex and the entire hippocampus, we analyzed how multiple electrical parameters are modified by aging in AD and WT mice. With this approach, we highlighted AD specific features that appear in young AD mice prior to plaque deposition or that are delayed at 12 and 16 months of age. Furthermore, we identified aging characteristics present in WT mice but also occurring prematurely in young AD mice. In short, we found that reduction in the relative power of slow oscillations (SO) and Low/High power imbalance are linked to an AD phenotype at its onset. The loss of SO connectivity and cortico-hippocampal coupling between SO and higher frequencies as well as the increase in UP-state and burst durations are found in young AD and old WT mice. We show evidence that the aging process is accelerated by the mutant PS2 itself and discuss such changes in relation to amyloidosis and gliosis.

Keywords: Alzheimer’s disease; PS2APP; UP-DOWN states; amyloid-β; delta waves; functional connectivity; phase-amplitude-coupling; presenilin-2; slow oscillations; spikes.


Conflict of interest statement

The authors declare no conflict of interest.

Figures

Figure 1
Figure 1
Total power is reduced in young AD and old WT mice. Total power (mean + SEM) profiles of LFP signals, recorded with a linear probe that crosses the PPC and HPF in WT (A) and AD (B) mice at different ages. The dotted horizontal lines indicate the depths of the seven channels used for all the subsequent analyses. (C) Histogram of the total power (mean + SEM) measured at CA1 sr-lm (1500 µm) * p < 0.05; ** p < 0.01, numbers of mice: WT 13, 10, 7 and AD 16, 10, 7 at 3, 12 and 16 months of age, respectively.
Figure 2
Figure 2
Plaque deposition and astrogliosis increase in AD mice with age. (AL) Representative confocal images of immunostaining for APP/Aβ with 4G8 (red) and for astrogliosis with anti-GFAP (green) antibodies, of cortical (Cx) and hippocampal (HPF) regions from coronal slices of 3- (AD), 12- (EH), and 16- (IL) month-old AD and WT mice (20x, scale bar, 200 µm). Arrows indicate 4G8 intraneuronal staining; arrowheads indicate 4G8 staining of Aβ plaques. Confocal images of the entire slices are shown in Supplementary Figure S2 with quantification in Supplementary Figure S3D–G.
Figure 3
Figure 3
Loss of hippocampal SO relative power and power imbalances characterize young AD mice. Boxplots of the relative power of SO (0.1–1.7 Hz) (A) and delta (1.7–4.7 Hz) waves (B) in CA1 (sr-lm, 1500 µm) of WT and AD mice. At each frequency band, the relative power is the percentage of the total power at the specific depth. Boxplots of the power ratios between SO and delta waves (C), and between Low (0.1–4.7 Hz) and High (4.7–190 Hz) frequency bands (D), * p < 0.05; ** p < 0.01). In 12-month-old AD mice, there is a significant increase in SO (A) and SO/delta ratio (C) versus 3-month-old AD mice, o p < 0.05; oo p < 0.01.
Figure 4
Figure 4
PAC based on SO and delta waves is reduced in middle-aged and old AD as well as in old WT mice. PAC, i.e., the coupling between amplitude of low frequencies and phase of higher frequencies, is measured by the GLM index, as described in Supplementary Materials. Significant reduction was found for PAC occurring between SO (A) or delta (B) bands in CA1 (sr-lm, 1500 µm) and FG in L4/5 (600 µm) of the PPC, * p < 0.05; ** p < 0.01.
Figure 5
Figure 5
Altered SO cortico-hippocampal connectivity in young AD and middle-aged WT mice. SO connectivity was measured in terms of maximal cross-correlation coefficients and latencies of the instantaneous SO amplitude, as described in Supplementary Materials. Matrices of cross-correlation coefficients (upper–right) and latencies (lower–left) for 3-, 12- and 16-month-old WT (AC) and AD (DF) mice were obtained by comparing each recording channel with all the other channels. The matrices report the areas with significant changes with respect to 3-month-old WT mice (p < 0.05, black line).
Figure 6
Figure 6
Loss of SO but not delta connectivity anticipates aging in young AD mice. For quantitative analyses of regional changes, maximal cross-correlation coefficients and latencies of each mouse were averaged within (intraregional) and between (cross-regional) regions, according to the scheme overlaid to the matrices of SO (A) and delta (C) connectivity in 3-month-old WT mice. (B,D) Synoptic views of the regional changes occurring in maximal cross-correlations and latencies at different ages in AD and WT mice. Warm and cold colors indicate increase and decrease, respectively. The color intensity reflects the level of statistical significance. Changes in regional cross-correlation coefficients and latencies are shown as boxplots in Supplementary Figures S7 and S8.
Figure 7
Figure 7
Young AD mice show increase in UP-state duration and spike activity. (A,B) Representative LFP (upper panels) and spike (lower panels) traces, also indicating the UP-state durations (shaded areas), measured in CA1 (sr-lm, 1500 µm) of a 3-month-old WT (A) or AD (B) mouse, following the method shown in Supplementary Figure S11.
Figure 8
Figure 8
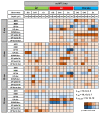
Alterations in UP-DOWN states and spiking activity are shared by mice expressing the mutant PS2. Synoptic views of cortical and hippocampal changes in UP-DOWN states and spiking activity of 3-, 6-, 12- and 16-month-old WT and AD mice, versus 3-month-old WT mice. The same parameters are presented also for the single transgenic PS2.30H mouse line, expressing only the mutant PS2-N141I. Warm and cold colors indicate increase and decrease, respectively. The color intensity reflects the level of statistical significance. With respect to previous analyses, few mice were discarded because of spike artifacts in the selected band region (0.3–3 kHz); n indicates the number of mice used for each genotype at 3, 6, 12 and 16 months of age; no mice were available for the16-month-old PS2.30H cohort. MFR, Mean Firing Rate; MBR, Mean Bursting Rate.
Figure 9
Figure 9
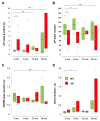
Changes in UP-DOWN states and burst duration in AD and WT mice across ages. Boxplots of UP-state duration (A), UP-state number (B), DOWN-state duration (C) and burst duration (D), measured in CA1 sr-lm (1500 µm) of AD and WT mice at different ages (* p < 0.05; ** p < 0.01; *** p < 0.001). The numbers of mice per genotype and age cohort are those indicated in Figure 8.

References

    1. Knopman D.S., Amieva H., Petersen R.C., Chételat G., Holtzman D.M., Hyman B.T., Nixon R.A., Jones D.T. Alzheimer disease. Nat. Rev. Dis. Prim. 2021;7:33. doi: 10.1038/s41572-021-00269-y. - DOI - PMC - PubMed
    1. D’Atri A., Scarpelli S., Gorgoni M., Truglia I., Lauri G., Cordone S., Ferrara M., Marra C., Rossini P.M., De Gennaro L. EEG alterations during wake and sleep in mild cognitive impairment and Alzheimer’s disease. iScience. 2021;24:102386. doi: 10.1016/j.isci.2021.102386. - DOI - PMC - PubMed
    1. Jelic V., Johansson S.E., Almkvist O., Shigeta M., Julin P., Nordberg A., Winblad B., Wahlund L.O. Quantitative electroencephalography in mild cognitive impairment: Longitudinal changes and possible prediction of Alzheimer’s disease. Neurobiol. Aging. 2000;21:533–540. doi: 10.1016/S0197-4580(00)00153-6. - DOI - PubMed
    1. Hamm V., Héraud C., Cassel J.-C., Mathis C., Goutagny R. Precocious Alterations of Brain Oscillatory Activity in Alzheimer’s Disease: A Window of Opportunity for Early Diagnosis and Treatment. Front. Cell. Neurosci. 2015;9:491. doi: 10.3389/fncel.2015.00491. - DOI - PMC - PubMed
    1. Prichep L.S., John E.R., Ferris S.H., Rausch L., Fang Z., Cancro R., Torossian C., Reisberg B. Prediction of longitudinal cognitive decline in normal elderly with subjective complaints using electrophysiological imaging. Neurobiol. Aging. 2006;27:471–481. doi: 10.1016/j.neurobiolaging.2005.07.021. - DOI - PubMed

Publication types

MeSH terms