. 2022 Jan 12;11(2):247.
doi: 10.3390/cells11020247.

Human Sensory Neuron-like Cells and Glycated Collagen Matrix as a Model for the Screening of Analgesic Compounds

Affiliations

Human Sensory Neuron-like Cells and Glycated Collagen Matrix as a Model for the Screening of Analgesic Compounds

Michelle Cristiane Bufalo et al. Cells. .

Erratum in

Abstract

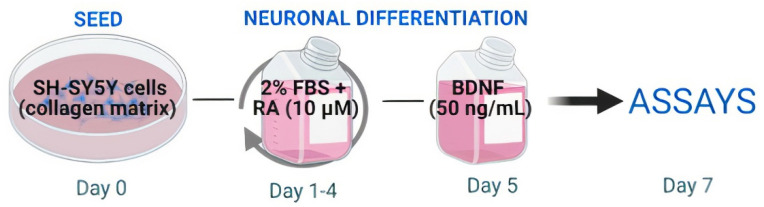
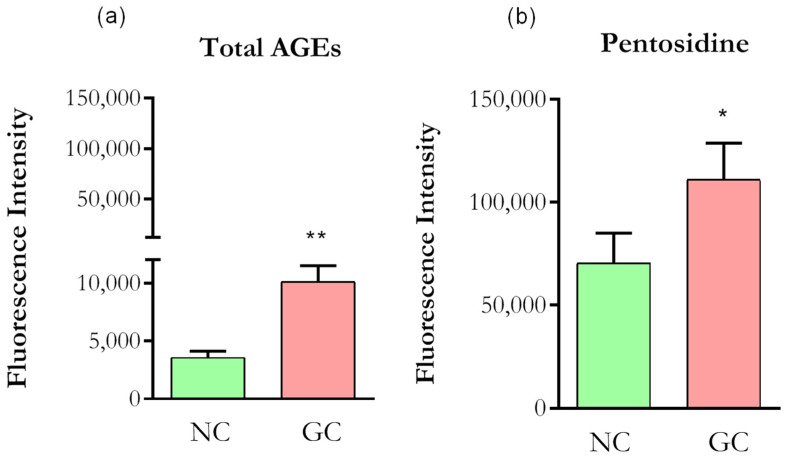
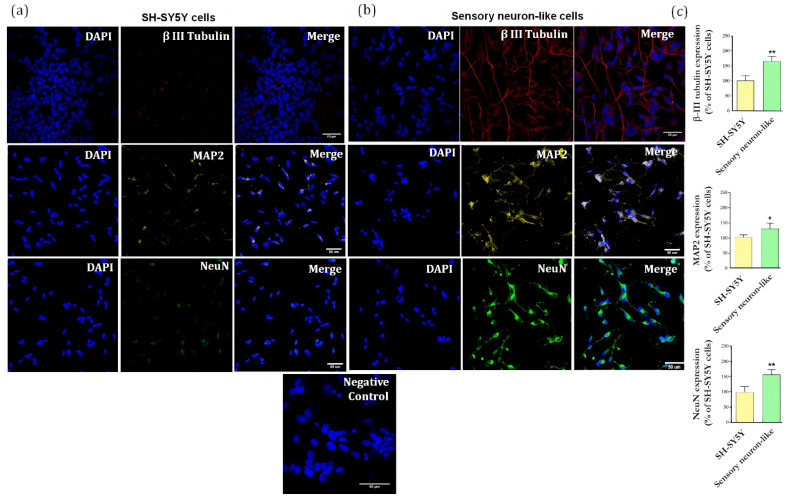
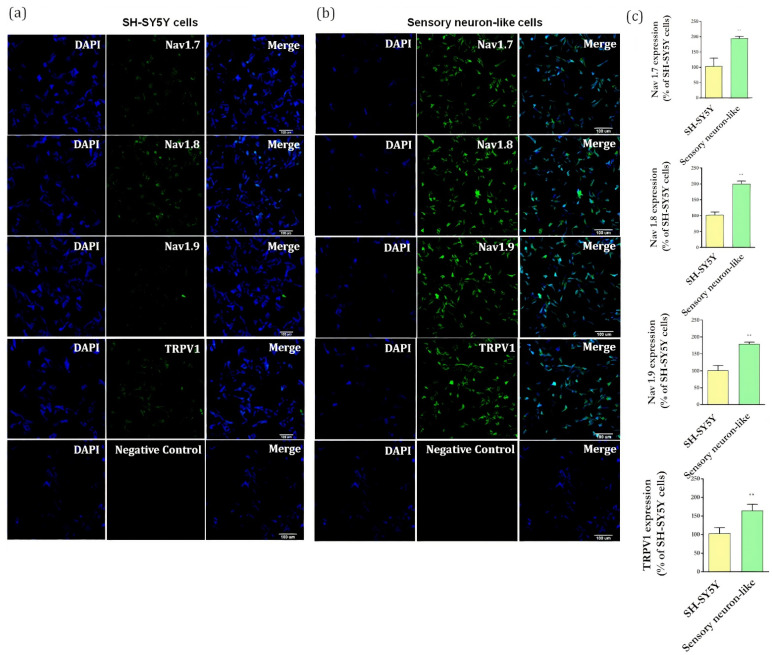
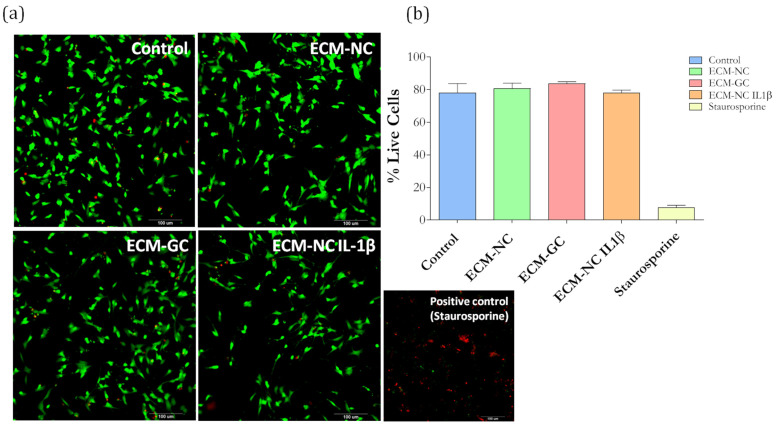
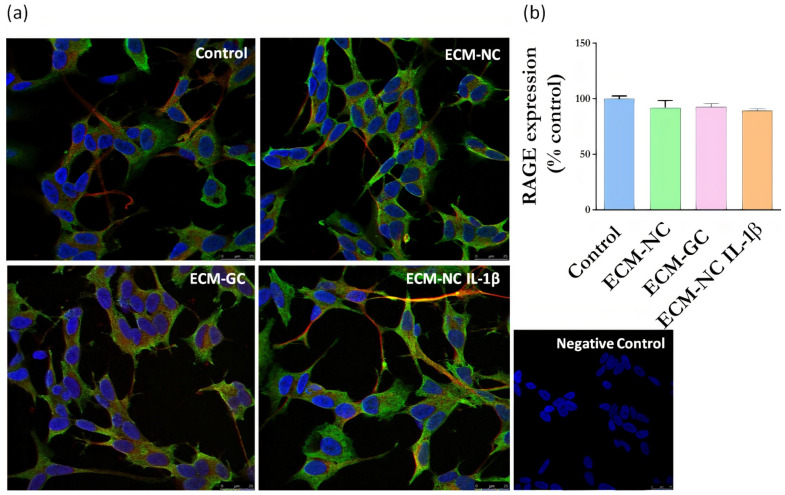
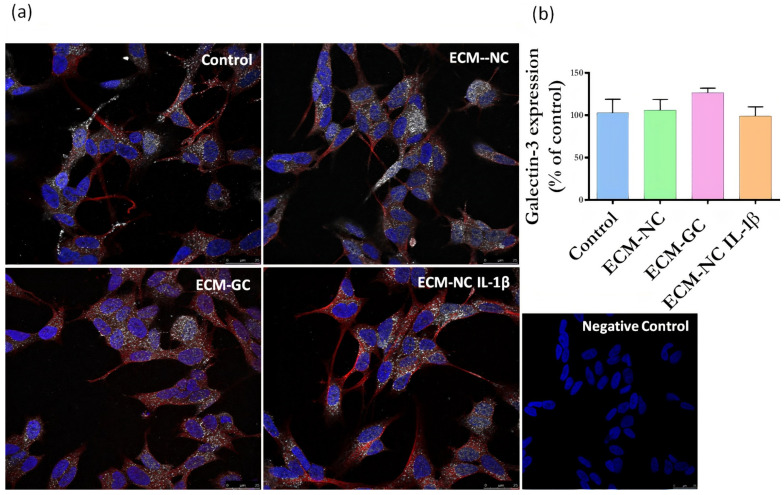
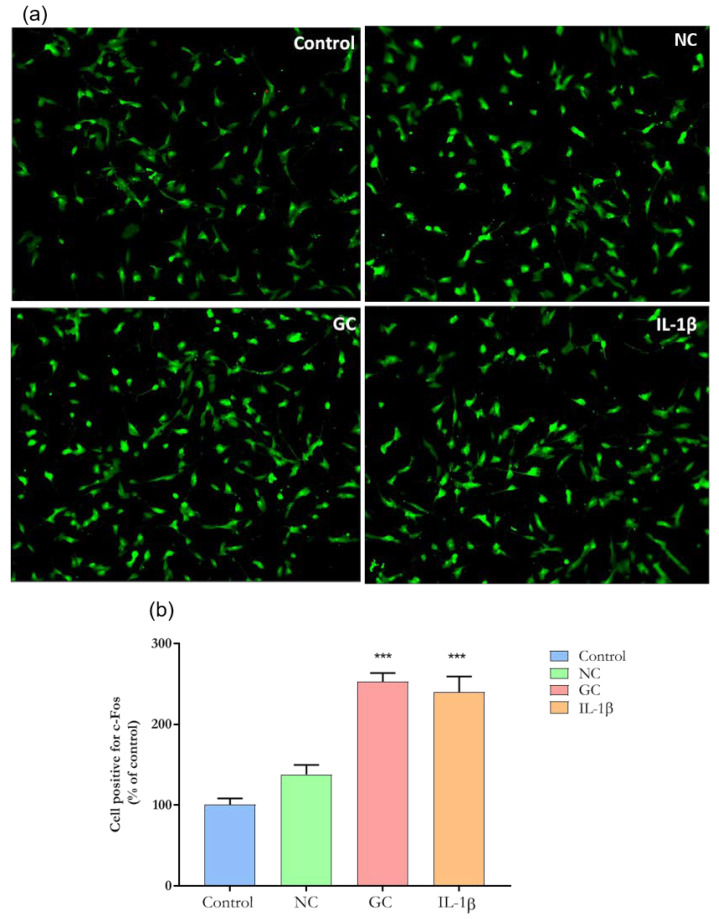
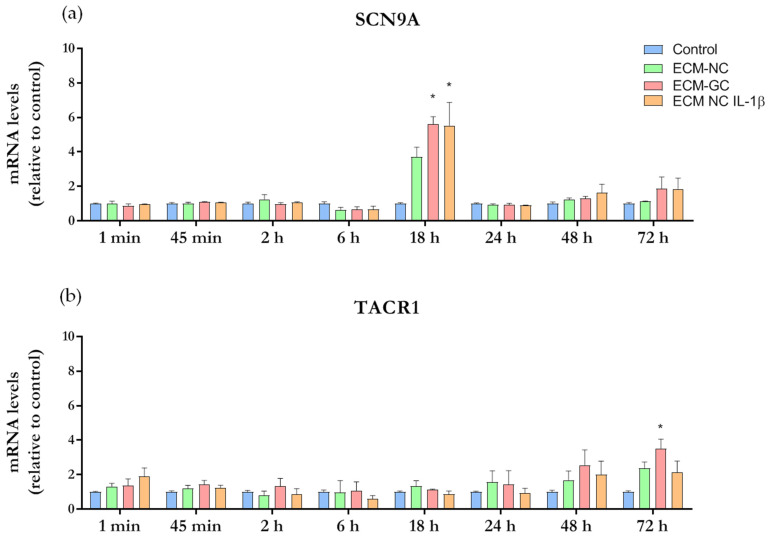
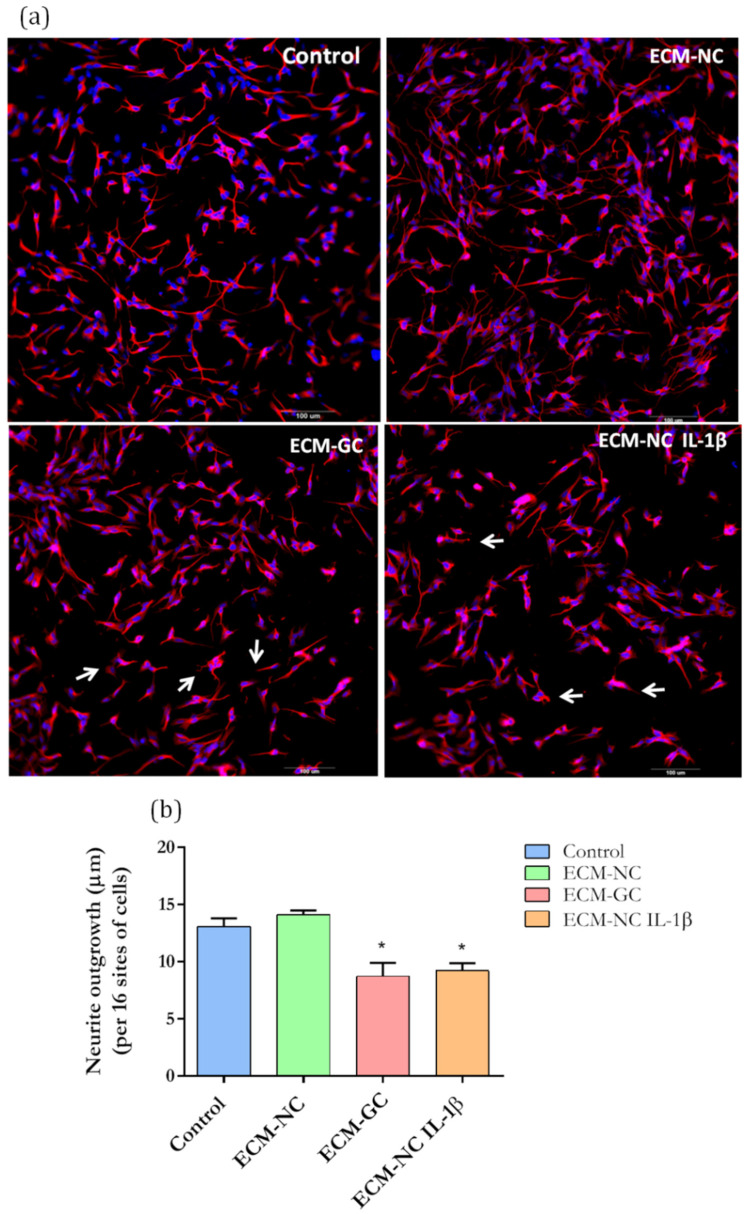
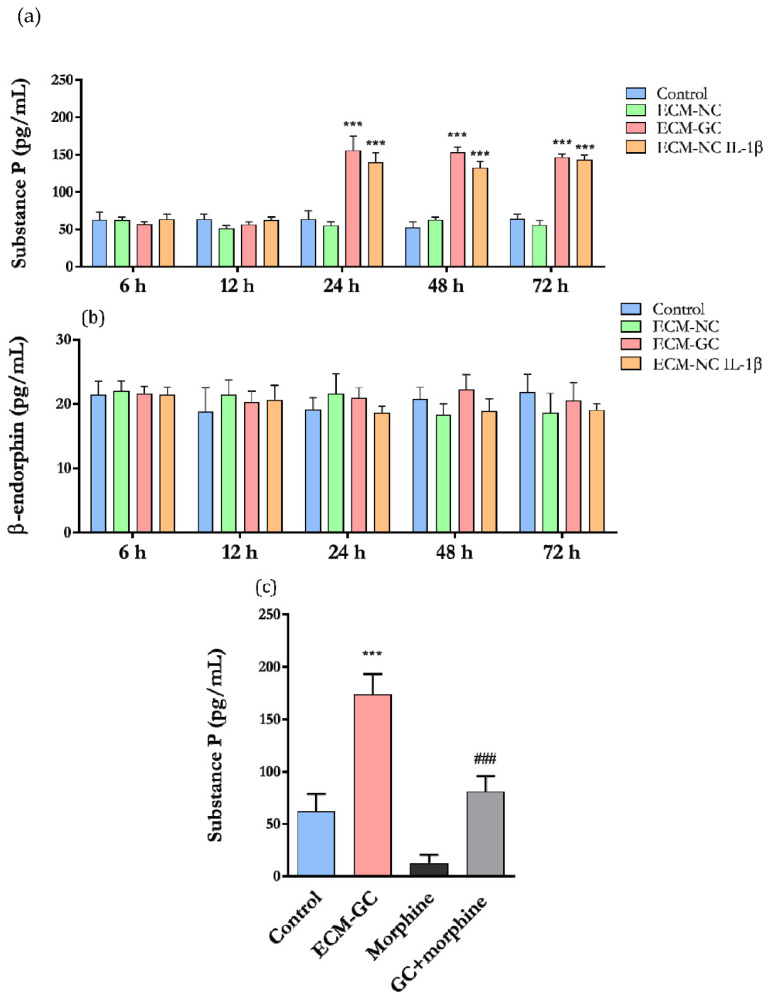
Increased collagen-derived advanced glycation end-products (AGEs) are consistently related to painful diseases, including osteoarthritis, diabetic neuropathy, and neurodegenerative disorders. We have recently developed a model combining a two-dimensional glycated extracellular matrix (ECM-GC) and primary dorsal root ganglion (DRG) that mimicked a pro-nociceptive microenvironment. However, culturing primary cells is still a challenge for large-scale screening studies. Here, we characterized a new model using ECM-GC as a stimulus for human sensory-like neurons differentiated from SH-SY5Y cell lines to screen for analgesic compounds. First, we confirmed that the differentiation process induces the expression of neuron markers (MAP2, RBFOX3 (NeuN), and TUBB3 (β-III tubulin), as well as sensory neuron markers critical for pain sensation (TRPV1, SCN9A (Nav1.7), SCN10A (Nav1.8), and SCN11A (Nav1.9). Next, we showed that ECM-GC increased c-Fos expression in human sensory-like neurons, which is suggestive of neuronal activation. In addition, ECM-GC upregulated the expression of critical genes involved in pain, including SCN9A and TACR1. Of interest, ECM-GC induced substance P release, a neuropeptide widely involved in neuroinflammation and pain. Finally, morphine, the prototype opiate, decreased ECM-GC-induced substance P release. Together, our results suggest that we established a functional model that can be useful as a platform for screening candidates for the management of painful conditions.

Keywords: analgesic compounds; high-content screening; in vitro assays; inflammatory disease; nociception; two-dimensional culture.


Conflict of interest statement

The authors declare no conflict of interest.

Figures

Figure 1
Figure 1
Schematic protocol for neuronal differentiation. On the first day (day 0) cells were plated into normal collagen coated plates. On days 1, 3, and 4, the medium was removed and the cells were incubated with a differentiation medium containing retinoic acid (RA—10 µM). On day 5 the medium was removed and the culture was stimulated with a medium containing brain derived neurotrophic factor (BDNF—50 ng/mL). On day 7, differentiated neurons were used in the experiments.
Figure 2
Figure 2
Autofluorescence of collagen. (a) Optical density (DO) values were taken from 370/440 nm for Total AGEs. (b) DO values were taken from 328/378 nm for Pentosidine. NC (normal collagen), GC (glycated collagen). Data were analyzed by t-test, * p < 0.01; ** p < 0.001). Five independent and similar assays were performed in triplicate.
Figure 3
Figure 3
(a) Immunofluorescence of specific neuronal markers (β-III tubulin, MAP2 and NeuN) in undifferentiated cells (SH-SY5Y cells) and (b) differentiated cells (sensory neuron-like cells). Representative images of five areas. Negative control of immunostaining. Scale bar: 50 µm. (c) Relative quantification of immunostaining for βIII-tubulin, MAP2, NeuN representing the ratio expression in the sensory neuron-like cells and SH-SY5Y cells. The data were analyzed by t-test, * p < 0.05; ** p < 0.001). The data represent three independent and similar assays.
Figure 4
Figure 4
(a) Representative images of immunofluorescence of Nav1.7, Nav1.8, Nav1.9, and TRPV1 markers in undifferentiated cells (SH-SY5Y cells) and (b) in differentiated cells (sensory neuron-like cells). Magnification: 20×. Negative controls of immunostaining. Scale bar: 100 µm. (c) Quantification of Nav1.7, Nav1.8, Nav1.9, TRPV1 expression representing the ratio between the immunostaining in the differentiated cells (sensory neuron-like cells) and the in undifferentiated cells (SH-SY5Y cells). The data were analyzed by t-test, ** p < 0.001). The data represent three independent and similar assays.
Figure 5
Figure 5
(a) Cell viability images show dead cells stained in red and live cells stained in green. Scale bar: 100 µm. (b) Cellular viability quantification (% of live cells) performed at 72 h. ECM-NC, ECM-GC, ECM-NC IL-1β, and positive control (staurosporine, 5 µM). Three independent and similar assays were performed in triplicate. Data were analyzed by one-way ANOVA with post hoc testing by Dunnett p > 0.05).
Figure 6
Figure 6
(a) Representative images of immunofluorescence of RAGE expression. Neuronal class β-III tubulin (red) 1:500; Hoechst-33342 was used to stain nuclei (blue) 1:3000; RAGE receptor (green) 1:200 in control cells (differentiated/ without ECM) and cells treated with ECM-NC, ECM-GC, ECM-NC IL-1β. Negative control of immunostaining. Magnification 40×. Scale bar: 25 µm. (b) Relative quantification of immunostaining for RAGE representing the ratio between the experimental and the control group. The data were analyzed by t-test. The data represent three independent and similar assays. Data were analyzed by one-way ANOVA with post hoc testing by Dunnett p > 0.05).
Figure 7
Figure 7
(a) Representative images of immunofluorescence of Galectin-3 expression. Neuronal class β-III tubulin (red) 1:500; Hoechst-33342 was used to stain nuclei (blue) 1:3000; Galectin-3 receptor (green) 1:200 in control cells (differentiated/ without ECM) and cells treated with ECM-NC, ECM-GC, ECM-NC IL-1β. Negative control of immunostaining. Magnification 40×. Scale bar: 25 µm. (b) Relative quantification of immunostaining for Galectin-3 representing the ratio between the experimental and the control group. The data were analyzed by t-test. The data represent three independent and similar assays. Data were analyzed by one-way ANOVA with post hoc testing by Dunnett p > 0.05).
Figure 8
Figure 8
Representative images of immunofluorescence of c-Fos expression. (a) c-Fos expression in sensory neuron-like cells incubated with ECM-NC, ECM-GC, ECM-NC IL-1β or medium culture for 1 h. Magnification: 20×. (b) Quantification of c-Fos nuclear expression (% of control). Data were analyzed by one-way ANOVA with post hoc testing by Dunnett (*** p < 0.0001 different from Control). NC (normal collagen) and GC (glycated collagen). Three independent and similar assays performed in triplicate.
Figure 9
Figure 9
Time course of gene expression analysis. Sensory neuron-like cells were incubated with media culture (control), ECM-NC or ECM-GC or ECM-NC plus IL-1β for 1 min, 45 min, 2 h, 6 h, 18 h, 24 h, 48 h, and 72 h. Gene expressions were normalized by PPIA and HPRT1 housekeeping genes. Data were analyzed by two-way ANOVA with post hoc testing by Tukey (* p < 0.05 different from control). NC (normal collagen), GC (glycated collagen). Three independent and similar assays were performed in triplicate. (a) SCN9A and (b) TACR1.
Figure 10
Figure 10
(a) Representative images of immunofluorescence show neurite length in sensory neuron-like cells. Arrows represent the reduced neuron interconnection and retraction of neurons outgrowth. (b) Quantification of neurite length in neuron-like cells based on β-III tubulin immunostaining. Data from 72 h of incubation. Magnification 20×. Scale bar: 100 µm. Data were analyzed by t-test (* p < 0.05 different from control), ECM-NC (normal collagen), ECM-GC (glycated collagen). Three independent and similar assays were performed in triplicate.
Figure 11
Figure 11
(a) Substance P and (b) β-endorphin release by neuron-like cells after incubation with ECM-NC or ECM-GC or ECM-NC plus IL-1β for 6, 12, 24, 48, and 72 h; data were analyzed by two-way ANOVA with post hoc testing by Dunnett (*** p < 0.0001 different from control). (c) Cells were incubated with morphine (10 µM) for 24 h, and the substance P levels were evaluated. Data were analyzed by one-way ANOVA and Tukey (*** p < 0.0001 different from control and ### p < 0.0001 different from GC). NC (normal collagen) and GC (glycated collagen). Three independent and similar assays were performed in triplicate.

References

    1. Hudson B.I., Lippman M.E. Targeting RAGE Signaling in Inflammatory Disease. Annu. Rev. Med. 2018;69:349–364. doi: 10.1146/annurev-med-041316-085215. - DOI - PubMed
    1. Dandia H., Makkad K., Tayalia P. Glycated collagen—A 3D matrix system to study pathological cell behavior. Biomater. Sci. 2019;7:3480–3488. doi: 10.1039/C9BM00184K. - DOI - PubMed
    1. Snedeker J.G., Gautieri A. The role of collagen crosslinks in ageing and diabetes-the good, the bad, and the ugly. Muscle Ligaments Tendons J. 2014;4:303–308. doi: 10.32098/mltj.03.2014.07. - DOI - PMC - PubMed
    1. Ott C., Jacobs K., Haucke E., Santos A.N., Grune T., Simm A. Role of advanced glycation end products in cellular signaling. Redox Biol. 2014;2:411–429. doi: 10.1016/j.redox.2013.12.016. - DOI - PMC - PubMed
    1. Asadipooya K., Uy E.M. Advanced glycation end products (AGEs), receptor for AGEs, diabetes, and bone: Review of the literature. J. Endocr. Soc. 2019;3:1799–1818. doi: 10.1210/js.2019-00160. - DOI - PMC - PubMed

Publication types

MeSH terms

LinkOut - more resources