. 2022 Jan 15;11(2):291.
doi: 10.3390/cells11020291.

Glucose Regulates m6A Methylation of RNA in Pancreatic Islets

Affiliations

Glucose Regulates m6A Methylation of RNA in Pancreatic Islets

Florine Bornaque et al. Cells. .

Abstract

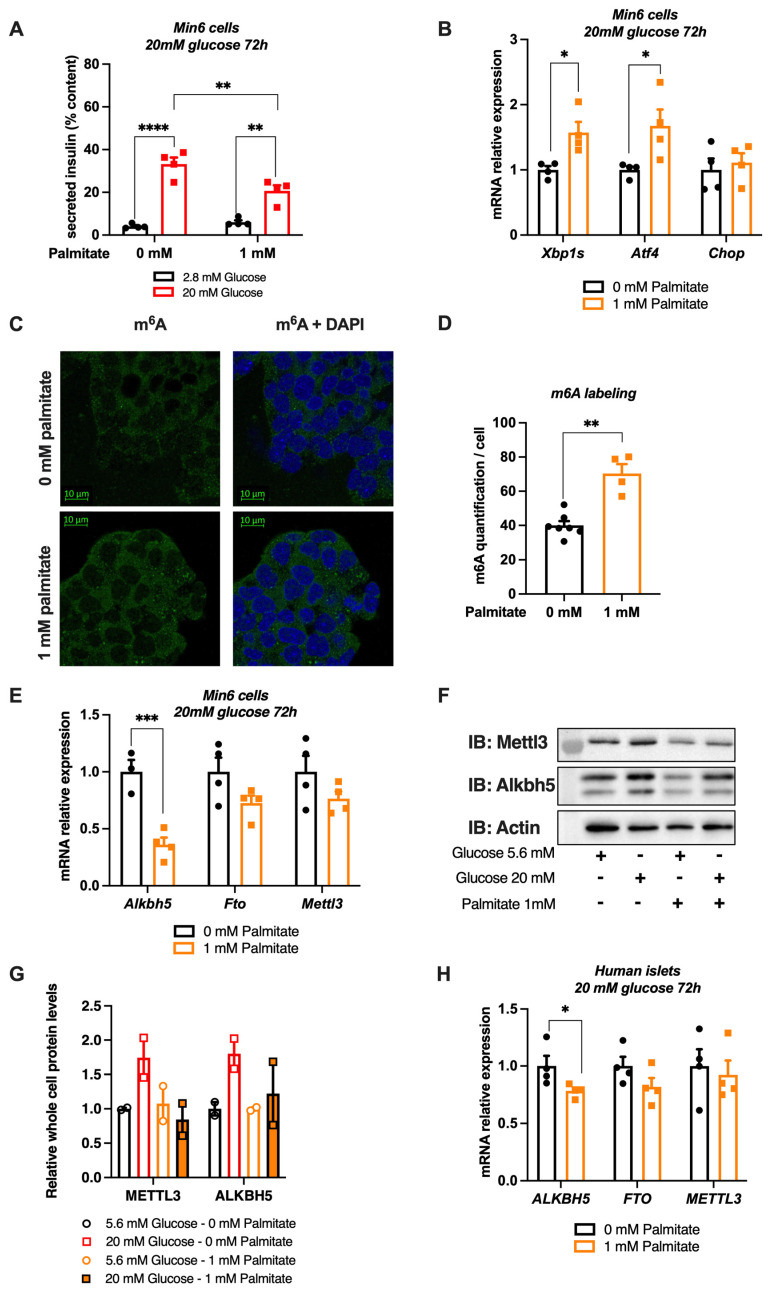
Type 2 diabetes is characterized by chronic hyperglycemia associated with impaired insulin action and secretion. Although the heritability of type 2 diabetes is high, the environment, including blood components, could play a major role in the development of the disease. Amongst environmental effects, epitranscriptomic modifications have been recently shown to affect gene expression and glucose homeostasis. The epitranscriptome is characterized by reversible chemical changes in RNA, with one of the most prevalent being the m6A methylation of RNA. Since pancreatic β cells fine tune glucose levels and play a major role in type 2 diabetes physiopathology, we hypothesized that the environment, through variations in blood glucose or blood free fatty acid concentrations, could induce changes in m6A methylation of RNAs in pancreatic β cells. Here we observe a significant decrease in m6A methylation upon high glucose concentration, both in mice and human islets, associated with altered expression levels of m6A demethylases. In addition, the use of siRNA and/or specific inhibitors against selected m6A enzymes demonstrate that these enzymes modulate the expression of genes involved in pancreatic β-cell identity and glucose-stimulated insulin secretion. Our data suggest that environmental variations, such as glucose, control m6A methylation in pancreatic β cells, playing a key role in the control of gene expression and pancreatic β-cell functions. Our results highlight novel causes and new mechanisms potentially involved in type 2 diabetes physiopathology and may contribute to a better understanding of the etiology of this disease.

Keywords: epitranscriptome; insulin secretion; pancreatic beta cell; type 2 diabetes.


Conflict of interest statement

The authors declare no conflict of interest.

Figures

Figure 1
Figure 1
m6A RNA methylation in human and murine diabetic islets. (A,B) ELISA quantification of m6A levels in total RNA from (A) pancreatic islets isolated from mice fed with chow diet (n = 5) or high fat diet during 12 weeks (n = 4) and (B) human control islets (n = 10) vs. human islets from donors with T2D (n = 5). Data were analyzed by Mann–Whitney test. ** p < 0.01. (C) Representative immunofluorescent staining of m6A levels (in green), insulin (in red) and glucagon (in white) in pancreatic sections from 15-week-old wild C57Bl6J mice fed with chow (CD), high fat (HFD) diets or from 15-week-old db/db mice. Nuclei were stained with Dapi (in blue). Scale bar represents 22 µm.
Figure 2
Figure 2
Effect of glucose on m6A RNA methylation in Min6 cells and non-diabetic human islets. (A,B) m6A methylation was quantified by dot blot in total RNA of Min6 cells (n = 3) after 3 h of treatment with 2.8 or 20 mM glucose. Quantification of m6A labeling in B was obtained from nylon membranes ((A), right membrane) and normalized by total RNA ((A), left membrane). (C,D) Immunofluorescence of Min6 cells (n = 5) after glucose treatment (C) and its quantification (D). (E,F) m6A methylation was quantified by dot blot in total RNA of non-diabetic human islets from 3 donors (H1028, H1032, H1033) after 1 h of 2.8 or 20 mM glucose treatment (n = 3 or 4). Quantification of m6A labeling obtained in nylon membrane ((E), right membrane) and normalized by total RNA (E, left, blue membrane). Data were analyzed by two-way ANOVA with Bonferroni’s correction for multiple comparisons (B) or Mann–Whitney tests (D,F). ** p < 0.01, **** p < 0.0001.
Figure 3
Figure 3
mRNA expression and protein localization of m6A reader and erasers after glucose treatment. (AC) mRNA expression of Alkbh5 (A), Fto (B) and Mettl3 (C) were quantified in Min6 cells by RT-qPCR after 1, 2 or 3 h of 2.8 or 20 mM glucose treatment (n = 3). Immunofluorescence of ALKBH5 in Min6 cells after 3 h of 2.8 or 20 mM glucose treatment (D) and its quantification using ImageJ ((E), n = 3). Immunofluorescence of METTL3 in Min6 cells after a 3 h treatment with 2.8 or 20 mM glucose treatment (F) and its quantification ((G), n = 3). Data were analyzed by two-way ANOVA with Bonferroni’s correction for multiple comparisons multiple t-tests (AC) or multiple unpaired t-tests (E,G). * p < 0.05, ** p < 0.01.
Figure 4
Figure 4
Effects of a chronic high glucose and palmitate treatment on m6A RNA methylation and m6A enzyme expression in Min6 cells and non-diabetic human islets. (A,B) Glucose-stimulated insulin secretion was quantified by ELISA ((A), n = 4) and quantification of mRNA expression levels of some ER stress genes by RT-qPCR ((B), n = 4) after 20 mM glucose with or without 1 mM palmitate during 72 h. (C,D) Immunofluorescence of m6A methylation in Min6 cells after after 72 h of 20 mM glucose with or without 1 mM palmitate (C) and its quantification (n ≥ 4, (D)). (E) Quantification of m6A enzyme expression by RT-qPCR in Min6 cells treated with 20 mM glucose with or without 1 mM palmitate ((E), n = 4). (F,G) Western blot (F) and its quantification (G) showing METTL3 and ALKBH5 protein levels in Min6 cells treated with 5.6 or 20 mM glucose, with or without 1 mM palmitate, for 72 h. (H) Quantification of m6A enzyme expression by RT-qPCR in pancreatic human islets (H1099) treated with 0.5 mM palmitate (n = 4). Data were analyzed by two-way ANOVA with Tukey’s correction for multiple comparisons (A) or Mann–Whitney tests (B,D,E,H). * p < 0.05, ** p < 0.01, *** p < 0.001, **** p < 0.0001.
Figure 5
Figure 5
Effects of a chronic low glucose and palmitate treatment on m6A RNA methylation and m6A enzyme expression in Min6 cells and non-diabetic human islets. (A,B) Glucose-stimulated insulin secretion was quantified by ELISA ((A), n = 4) and quantification of mRNA expression levels of some ER stress genes by RT-qPCR ((B), n = 4) after 5.6 mM glucose and 1 mM palmitate cotreatment during 72 h. (C) m6A methylation levels in Min6 cells after 72 h of 5.6 mM glucose and 1 mM palmitate ((C), n = 4). (D) Quantification of m6A enzyme expression by RT-qPCR in Min6 cells treated with 5.6 mM glucose and 1 mM palmitate (n = 4). (E) Glucose-stimulated insulin secretion of human islets treated with 5.6 mM glucose and 0.5 mM palmitate was quantified by ELISA. (F) Quantification of m6A enzyme expression by RT-qPCR in pancreatic human islets (H1099) treated with 0.5 mM palmitate (n = 4). Data were analyzed by two-way ANOVA with Tukey’s correction for multiple comparisons (A,E) or Mann–Whitney tests (BD,F). * p < 0.05, ** p < 0.01, *** p < 0.001, **** p < 0.0001.
Figure 6
Figure 6
Knock-down of m6A enzymes through siRNA affects the expression of genes involved in beta-cell identity and function. Cells were treated during 24 h with a non targetting siRNA (siControl), siAlkbh5, siFto and siMettl3 and lysed 48 h later to study mRNA expression. Quantification of m6A enzyme expression by RT-qPCR after siRNA transfection against Alkbh5 (A), Fto (D) or Mettl3 (G) (n = 4). mRNA expression of genes involved in β-cell identity (B,E,H) and function (C,F,I) (n = 4) is represented. Data were analyzed by two-way ANOVA with Bonferroni’s correction for multiple comparisons (A,D,G) and multiple t-tests (B,C,E,F,H,I). * p < 0.05, ** p < 0.01, *** p < 0.001, **** p < 0.0001.
Figure 7
Figure 7
Effects of genetic or pharmacological FTO inhibition on glucose-stimulated insulin secretion in Min6 cells, mouse and human pancreatic islets. (A) GSIS after siRNA mediated Fto knockdown in Min6 cells (n = 16). (B,C) GSIS after treatment of Min6 cells ((B), n = 4) and primary mouse pancreatic islets ((C), n = 6) with 100 nM bisantrene for 8 and 2 h, respectively. (DF) Human pancreatic islets were untreated or treated with 100 nM bisantrene for 1 h (D), 4 h (E) and 24 h (F) and global m6A RNA methylation was quantified by ELISA. (G) GSIS of pancreatic human islets untreated or treated with 100 nM bisantrene for 1, 4 and 24 h. Stimulation index represents the fold of 20 mM glucose-stimulated insulin secretion over 2.8 mM glucose-stimulated insulin secretion. Data were analyzed by two-way ANOVA with Tukey’s correction for multiple comparisons (AC), Mann–Whitney tests (DF) or one-way ANOVA with Dunnett’s correction for multiple comparisons (G). * p < 0.05, ** p < 0.01, *** p < 0.001.

References

    1. Ndiaye F.K., Ortalli A., Canouil M., Huyvaert M., Salazar-Cardozo C., Lecoeur C., Verbanck M., Pawlowski V., Boutry R., Durand E., et al. Expression and Functional Assessment of Candidate Type 2 Diabetes Susceptibility Genes Identify Four New Genes Contributing to Human Insulin Secretion. Mol. Metab. 2017;6:459–470. doi: 10.1016/j.molmet.2017.03.011. - DOI - PMC - PubMed
    1. Ohn J.H., Kwak S.H., Cho Y.M., Lim S., Jang H.C., Park K.S., Cho N.H. 10-Year Trajectory of β-Cell Function and Insulin Sensitivity in the Development of Type 2 Diabetes: A Community-Based Prospective Cohort Study. Lancet Diabetes Endocrinol. 2016;4:27–34. doi: 10.1016/S2213-8587(15)00336-8. - DOI - PubMed
    1. Weir G.C., Bonner-Weir S. Five Stages of Evolving Beta-Cell Dysfunction during Progression to Diabetes. Diabetes. 2004;53((Suppl. 3)):S16–S21. doi: 10.2337/diabetes.53.suppl_3.S16. - DOI - PubMed
    1. Levy J., Atkinson A.B., Bell P.M., McCance D.R., Hadden D.R. Beta-Cell Deterioration Determines the Onset and Rate of Progression of Secondary Dietary Failure in Type 2 Diabetes Mellitus: The 10-Year Follow-up of the Belfast Diet Study. Diabet. Med. 1998;15:290–296. doi: 10.1002/(SICI)1096-9136(199804)15:4<290::AID-DIA570>3.0.CO;2-M. - DOI - PubMed
    1. De Jesus D.F., Kulkarni R.N. Epigenetic Modifiers of Islet Function and Mass. Trends Endocrinol. Metab. 2014;25:628–636. doi: 10.1016/j.tem.2014.08.006. - DOI - PubMed

Publication types

MeSH terms

LinkOut - more resources