. 2022 Jan 5;12(1):77.
doi: 10.3390/brainsci12010077.

Optimal Scaling Approaches for Perfusion MRI with Distorted Arterial Input Function (AIF) in Patients with Ischemic Stroke

Affiliations

Optimal Scaling Approaches for Perfusion MRI with Distorted Arterial Input Function (AIF) in Patients with Ischemic Stroke

Sukhdeep Singh Bal et al. Brain Sci. .

Abstract

Background: Diagnosis and timely treatment of ischemic stroke depends on the fast and accurate quantification of perfusion parameters. Arterial input function (AIF) describes contrast agent concentration over time as it enters the brain through the brain feeding artery. AIF is the central quantity required to estimate perfusion parameters. Inaccurate and distorted AIF, due to partial volume effects (PVE), would lead to inaccurate quantification of perfusion parameters.

Methods: Fifteen patients suffering from stroke underwent perfusion MRI imaging at the Tri-Service General Hospital, Taipei. Various degrees of the PVE were induced on the AIF and subsequently corrected using rescaling methods.

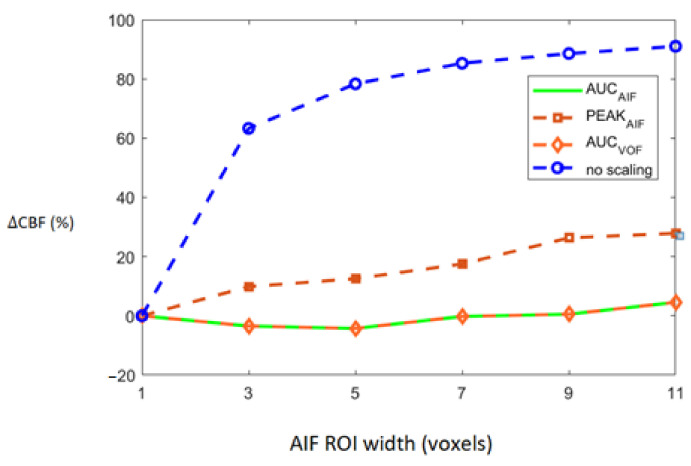
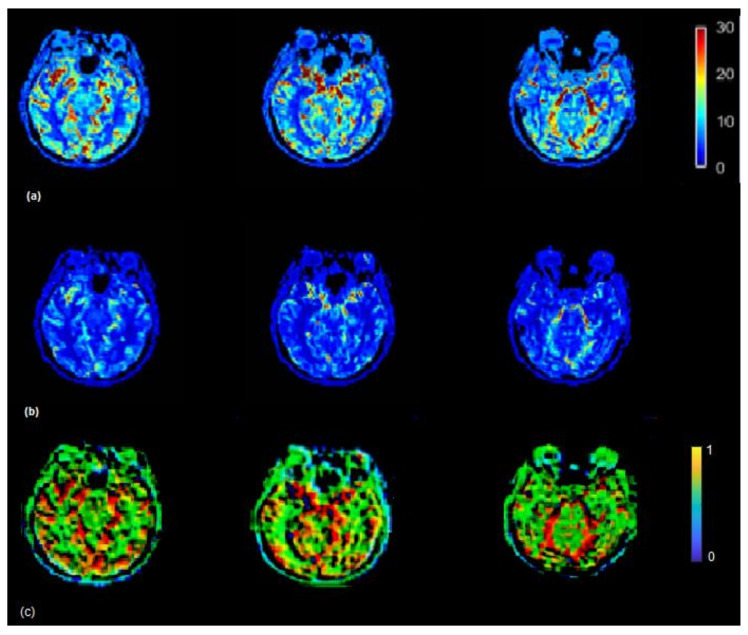
Results: Rescaled AIFs match the exact reference AIF curve either at peak height or at tail. Inaccurate estimation of CBF values estimated from non-rescaled AIFs increase with increasing PVE. Rescaling of the AIF using all three approaches resulted in reduced deviation of CBF values from the reference CBF values. In most cases, CBF map generated by rescaled AIF approaches show increased CBF and Tmax values on the slices in the left and right hemispheres.

Conclusion: Rescaling AIF by VOF approach seems to be a robust and adaptable approach for correction of the PVE-affected multivoxel AIF. Utilizing an AIF scaling approach leads to more reasonable absolute perfusion parameter values, represented by the increased mean CBF/Tmax values and CBF/Tmax images.

Keywords: AIF (arterial input function); CBF (cerebral blood flow); CBV (cerebral blood volume); PVE (partial volume effect); SVD (singular value decomposition).


Conflict of interest statement

The authors report no competing interest.

Figures

Figure 1
Figure 1
Example of misleading perfusion parameter maps. (A) Apparent diffusion coefficient (ADC) image (mm2/s). The dark region on ADC image thresholded by ADC ≤ 620 × 10−6 mm2/s is the infracted core (red arrow) on the map. (B) CBF map (bottom) [mL/100 g/min]. This CBF map does not indicates the infract region as represented on the ADC map, which is a result of inaccurate quantification of CBF.
Figure 2
Figure 2
(a) Red colored square represents ICA used for reference AIF determination. (b) Increased size of the AIF, i.e., AIF concentrations were measured from 3, 5, 7, 9, and 11 voxels centered around the reference ICA voxel shown by black, blue, red, green, yellow, light blue colored squares, respectively. (c) An example of non-corrected AIFs (3 voxel AIF; blue curve) and corrected AIFs by all 3 scaling approaches. For a single subject, the unscaled AIF was derived from a 3-voxel-wide region to include the effect of the PVE. ICA: internal carotid artery; PVE: partial volume effect.
Figure 3
Figure 3
Rescaled concentration curves of arterial input functions (AIFs) generated using different scaling methods. The legend in (A) indicates the width (in voxels) of ROI used for measuring the AIF. (A) Rescaled AIFs generated using scaling by AIF approach. (B) Rescaled AIFs generated using scaling by matching peak height approach. (C) Rescaled AIFs generated using scaling by VOF approach.
Figure 4
Figure 4
Average CBF divergence from reference CBF plotted against increasing number of voxels. Average CBF divergence for group of 15 patients is plotted according to increased partial volume effect (PVE) for all four scaling approaches indicated by the legend on right.
Figure 5
Figure 5
(a) CBF (mL/100 g/min) map generated by using rescaled AIF (b) and non-rescaled AIF (bottom). CBF map generated using rescaled AIF represents increased CBF values in the shown axial brain slices. CBF maps from non-rescaled AIF display mostly all the ROIs with decreased blood flow which makes it difficult to locate the regions which actually have a decreased flow. CBF images derived using rescaled AIF display ROIs with increased flow (red color) which helps to segregate the regions with decreased blood flow. This may help clinicals to identify the infract regions as well as regions with decreased blood flow on visual brain CBF images. (c) Maps illustrating the ratio between CBF values derived from the scaled and the non-scaled AIF.
Figure 6
Figure 6
Tmax (seconds) map generated by using rescaled AIF (a) and non-rescaled AIF (b) for one subject. Tmax map generated using rescaled AIF represents increased values in the shown axial brain slices.

References

    1. Fan S., Bian Y., Wang E., Kang Y., Wang D.J.J., Yang Q., Ji X. An Automatic Estimation of Arterial Input Function Based on Multi-Stream 3D CNN. Front. Neuroinform. 2019;13:49. doi: 10.3389/fninf.2019.00049. - DOI - PMC - PubMed
    1. Ostergaard L., Weisskoff R.M., Chesler D.A., Gyldensted C., Rosen B.R. High resolution measurement of cerebral blood flow using intravascular tracer bolus passages. Part I: Mathematical approach and statistical analysis. Magn. Reson. Med. 1996;36:715–725. doi: 10.1002/mrm.1910360510. - DOI - PubMed
    1. Calamante F., Gadian D.G., Connelly A. Delay and dispersion effects in dynamic susceptibility contrast MRI: Simulations using singular value decomposition. Magn. Reson. Med. 2000;44:466–473. doi: 10.1002/1522-2594(200009)44:3<466::AID-MRM18>3.0.CO;2-M. - DOI - PubMed
    1. Forkert N.D., Fiehler J., Ries T., Illies T., Möller D., Handels H., Säring D. Reference-based linear curve fitting for bolus arrival time estimation in 4D MRA and MR perfusion-weighted image sequences. Magn. Reson. Med. 2011;65:289–294. doi: 10.1002/mrm.22583. - DOI - PubMed
    1. Kudo K., Sasaki M., Ogasawara K., Terae S., Ehara S., Shirato H. Difference in tracer delay-induced effect among deconvolution algorithms in CT perfusion analysis: Quantitative evaluation with digital phantoms. Radiology. 2009;251:241–249. doi: 10.1148/radiol.2511080983. - DOI - PubMed

LinkOut - more resources