. 2022 Jan 10;23(2):713.
doi: 10.3390/ijms23020713.

Mining the Wheat Grain Proteome

Affiliations

Mining the Wheat Grain Proteome

Delphine Vincent et al. Int J Mol Sci. .

Abstract

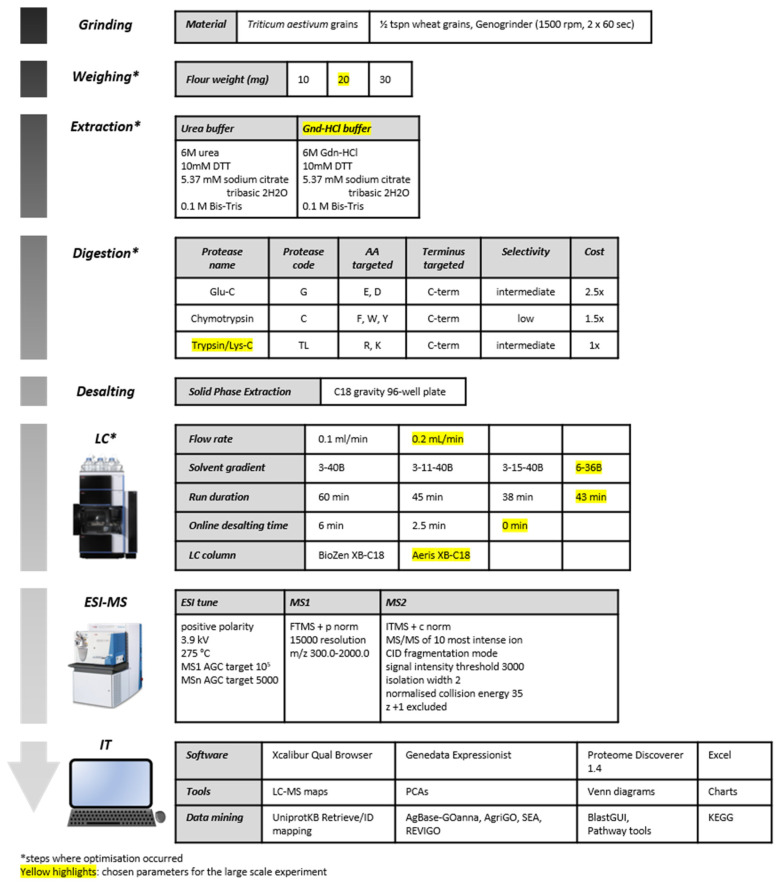
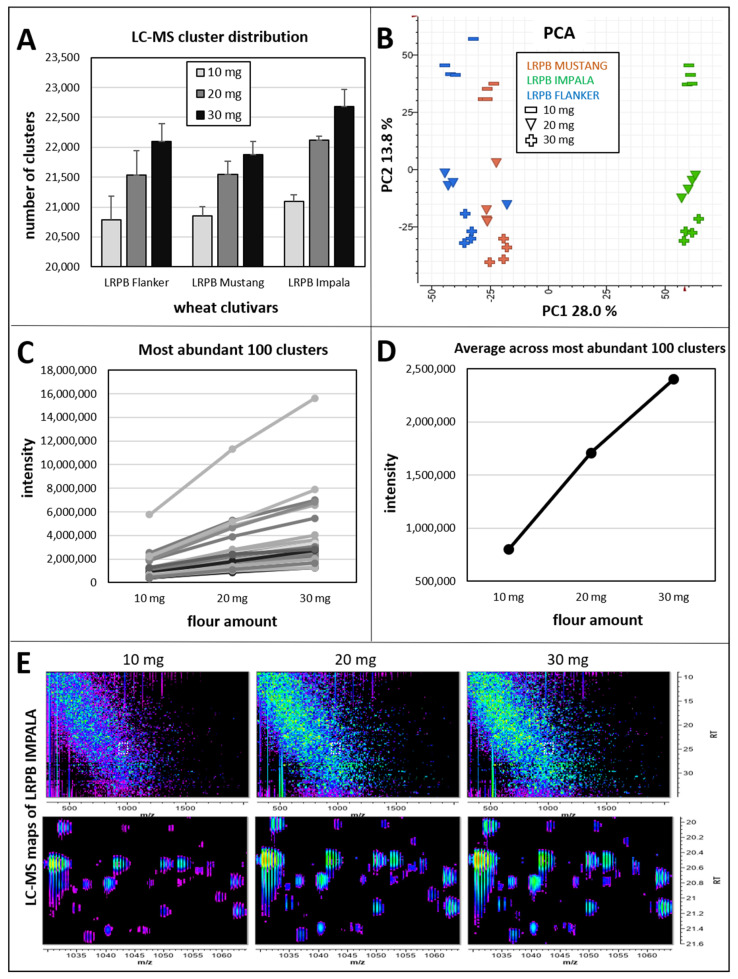
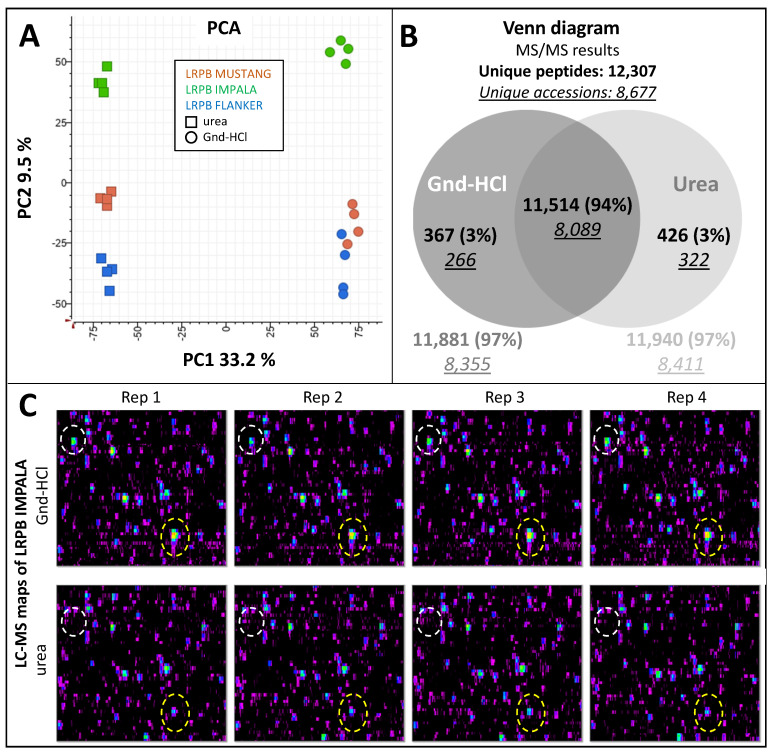
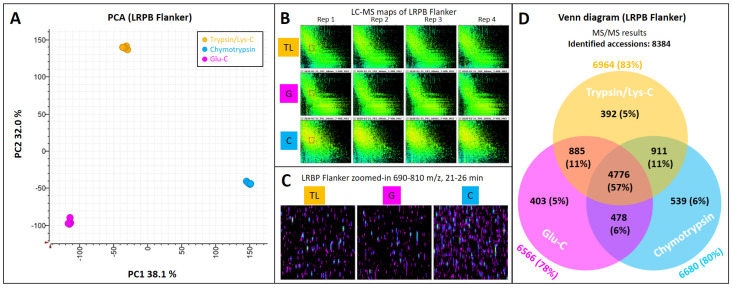
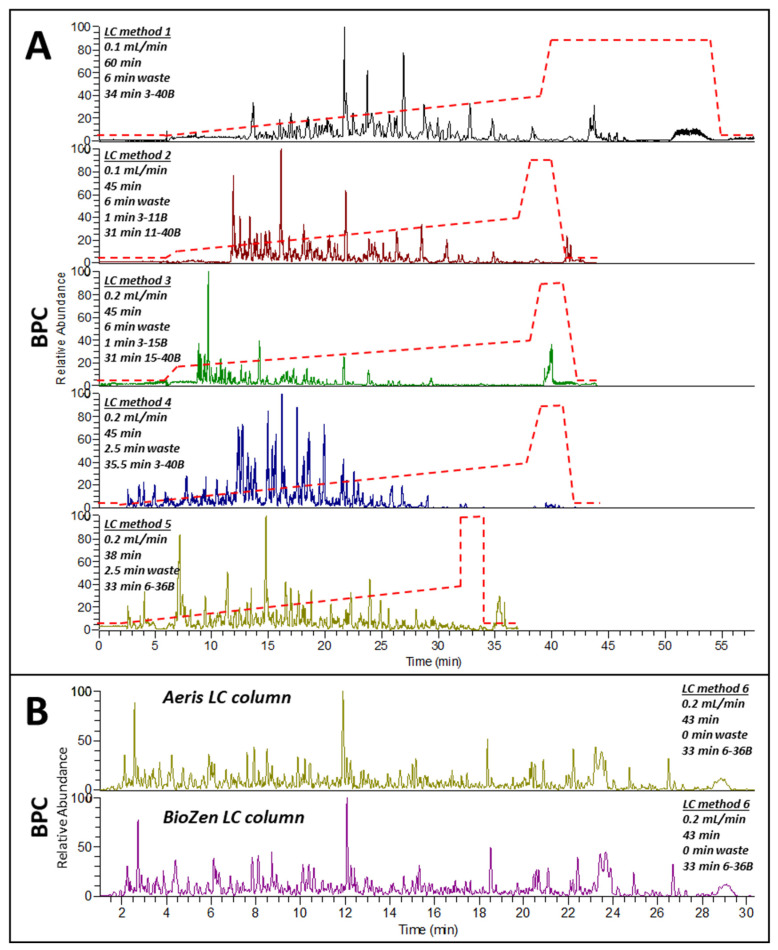
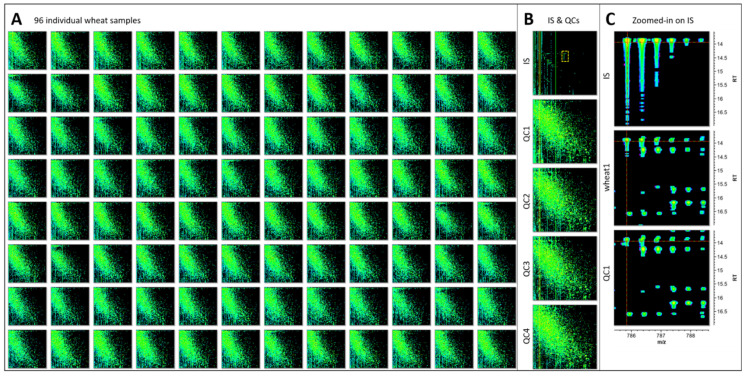
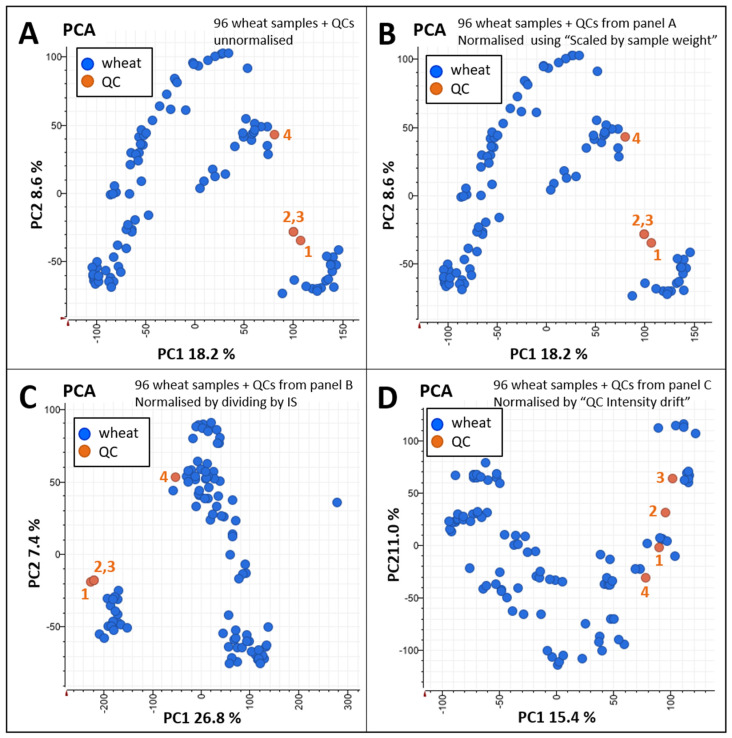
Bread wheat is the most widely cultivated crop worldwide, used in the production of food products and a feed source for animals. Selection tools that can be applied early in the breeding cycle are needed to accelerate genetic gain for increased wheat production while maintaining or improving grain quality if demand from human population growth is to be fulfilled. Proteomics screening assays of wheat flour can assist breeders to select the best performing breeding lines and discard the worst lines. In this study, we optimised a robust LC-MS shotgun quantitative proteomics method to screen thousands of wheat genotypes. Using 6 cultivars and 4 replicates, we tested 3 resuspension ratios (50, 25, and 17 µL/mg), 2 extraction buffers (with urea or guanidine-hydrochloride), 3 sets of proteases (chymotrypsin, Glu-C, and trypsin/Lys-C), and multiple LC settings. Protein identifications by LC-MS/MS were used to select the best parameters. A total 8738 wheat proteins were identified. The best method was validated on an independent set of 96 cultivars and peptides quantities were normalised using sample weights, an internal standard, and quality controls. Data mining tools found particularly useful to explore the flour proteome are presented (UniProt Retrieve/ID mapping tool, KEGG, AgriGO, REVIGO, and Pathway Tools).

Keywords: LC–MS/MS; Triticum aestivum; data mining; normalisation; protease; shotgun proteomics.


Conflict of interest statement

The authors declare no conflict of interest.

Figures

Figure 1
Figure 1
Experimental design. The asterisk denotes where technical optimisation occurred, and the yellow highlights indicate which parameters were selected for the large-scale experiment.
Figure 2
Figure 2
Testing flour weights. Three wheat cultivars (LRPB Mustang, LRPB Impala, and LRPB Flanker) were weighed in four replicates, extracted using 0.5 mL Gnd-HCl buffer, and 10 µL extract aliquots were digested using trypsin/Lys-C protease mixture. LC–MS data were acquired using LC method 5. (A) Histogram of the number of LC–MS clusters averaged per cultivar and flour amount; (B) PC1 vs. PC2 plot based on LC–MS quantitative data; (C) line chart of the 100 most abundant LC–MS clusters averaged across cultivars; (D) line chart of the averages of the 100 most abundant LC–MS clusters; (E) LC–MS maps of LRPB Impala cultivar for each of the flour amount tested with zoomed-in sections at 20–21.6 min and 1030–1070 m/z.
Figure 3
Figure 3
Testing extraction buffers. Twenty milligrams (±0.2 mg) from three wheat cultivars (LRPB Mustang, LRPB Impala, LRPB Flanker) was weighed in four replicates, extracted using 0.5 mL Gnd-HCl or urea buffer. Protein extracts were assayed to obtain protein concentrations and 100 µg proteins were digested using trypsin/Lys-C protease mixture. LC–MS/MS data were acquired using LC method 1. (A) PC1 vs. PC2 plot based on LC–MS quantitative data; (B) Venn diagram of the identified unique peptides and accessions for each extraction buffer; (C) zoomed-in section of LC–MS maps at 28–36 min and 950–990 m/z of LRPB Impala cultivar for both extraction buffers tested across four technical replicates; cluster qualitative and quantitative differences are highlighted in ovals.
Figure 4
Figure 4
Testing proteases. Twenty milligrams (±0.2 mg) from three wheat cultivars (LRPB Mustang, LRPB Impala, LRPB Flanker) was weighed in four replicates, extracted using 0.5 mL Gnd-HCl buffer. Protein extracts were assayed to obtain protein concentrations and 100 µg proteins were digested using chymotrypsin, Glu-C, or trypsin/Lys-C proteases. LC–MS/MS data were acquired using LC method 1. (A) PC1 vs. PC2 plot based on LC–MS quantitative data; (B) LC–MS maps of LRPB Flanker cultivar for each of the proteases tested across four technical replicates, boxed sections are zoomed-in in panel C; (C) zoomed-in section of LC–MS maps at 21–26 min and 690–810 m/z to highlight cluster qualitative and quantitative differences; (D) Venn diagram of the identified accessions for each protease. TL, trypsin/Lys-C; G, Glu-C; C, chymotrypsin.
Figure 5
Figure 5
Testing LC separation. Twenty milligrams (±0.2 mg) from LRPB Flanker) was weighed, extracted using 0.5 mL Gnd-HCl buffer, and digested using trypsin/Lys-C. LC methods are described in the Materials and Methods. (A) BPCs obtained to test LC durations, solvent gradients, initial online desalting durations, and flow rates; red dotted lines depict the solvent gradient; (B) BPCs using the LC method 6 to compare BioZen and Aeris XB-C18 LC columns.
Figure 6
Figure 6
LC–MS maps for method validation. An amount of 20 mg (±0.2 mg) from 96 wheat cultivars was weighed, extracted using 0.5 mL Gnd-HCl buffer, and 10 µL extract aliquots were digested using trypsin/Lys-C. QCs and IS are described in the Materials and Methods. LC–MS data were acquired using LC method 6. (A) LC–MS maps of 96 individual wheat tryptic digests; (B) LC–MS maps of internal standard (IS) glu[1]-fibrinopeptide B and quality control samples (QCs), boxed section is where IS resolves and is zoomed-in in panel C; (C) zoomed-in section of LC–MS maps at 14–17 min and 785–789 m/z of the whole IS cluster on its own, in a wheat sample and in the QC sample; crossed dotted red lines pinpoint the 1st isotopic LC–MS peak of IS.
Figure 7
Figure 7
Principal component analysis (PCA) for method validation. Twenty milligrams (±0.2 mg) from 96 wheat cultivars was weighed, extracted using 0.5 mL Gnd-HCl buffer, and 10 µL extract aliquots were digested using trypsin/Lys-C. QCs and IS are described in the Materials and Methods. LC–MS data were acquired using LC method 6. (A) PC1 vs. PC2 plot based on unnormalised LC–MS quantitative data of the 96 wheat and QCs samples; (B) PC1 vs. PC2 plot based on LC–MS quantitative data from panel A normalised using the sample weights; (C) PC1 vs. PC2 plot based on LC–MS quantitative data from panel B normalised using the IS cluster; (D) PC1 vs. PC2 plot based on LC–MS quantitative data from panel C normalised using the injection order of the QCs (indicated with the orange numbers) and the ‘intensity drift’ algorithm of Genedata Analyst.

References

    1. Shewry P.R. Wheat. J. Exp. Bot. 2009;60:1537–1553. doi: 10.1093/jxb/erp058. - DOI - PubMed
    1. International Wheat Genome Sequencing Consortium (IWGSC) IWGSC RefSeq Principal Investigators. Appels R., Eversole K., Feuillet C., Keller B., Rogers J., Stein N., iIWGSC Whole-Genome Assembly Principal Investigators. Pozniak C.J., et al. Shifting the limits in wheat research and breeding using a fully annotated reference genome. Science. 2018;361:eaar7191. doi: 10.1126/science.aar7191. - DOI - PubMed
    1. Guan J., Garcia D.F., Zhou Y., Appels R., Li A., Mao L. The Battle to Sequence the Bread Wheat Genome: A Tale of the Three Kingdoms. Genom. Proteom. Bioinform. 2020;18:221–229. doi: 10.1016/j.gpb.2019.09.005. - DOI - PMC - PubMed
    1. Bhalla P.L., Sharma A., Singh M.B. Enabling Molecular Technologies for Trait Improvement in Wheat. Methods Mol. Biol. 2017;1679:3–24. doi: 10.1007/978-1-4939-7337-8_1. - DOI - PubMed
    1. Bonomi F., Iametti S., Mamone G., Ferranti P. The Performing Protein: Beyond Wheat Proteomics? Cereal Chem. 2013;90:358–366. doi: 10.1094/CCHEM-11-12-0161-FI. - DOI

LinkOut - more resources