. 2022 Jan 11;23(2):781.
doi: 10.3390/ijms23020781.

Transcriptomic, Metabolomic and Ionomic Analyses Reveal Early Modulation of Leaf Mineral Content in Brassica napus under Mild or Severe Drought

Affiliations

Transcriptomic, Metabolomic and Ionomic Analyses Reveal Early Modulation of Leaf Mineral Content in Brassica napus under Mild or Severe Drought

Aurélien D'Oria et al. Int J Mol Sci. .

Abstract

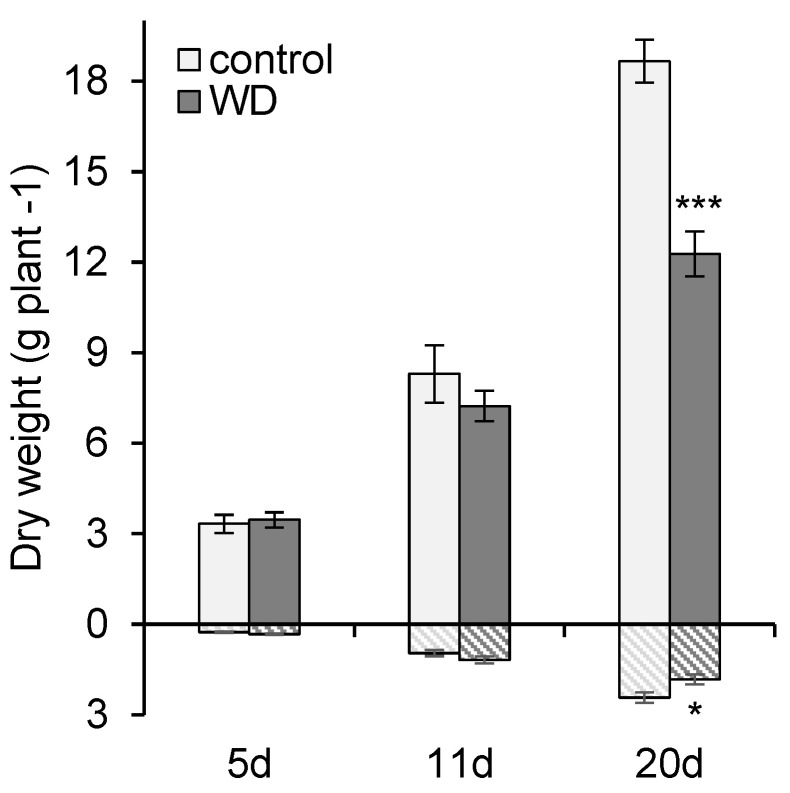
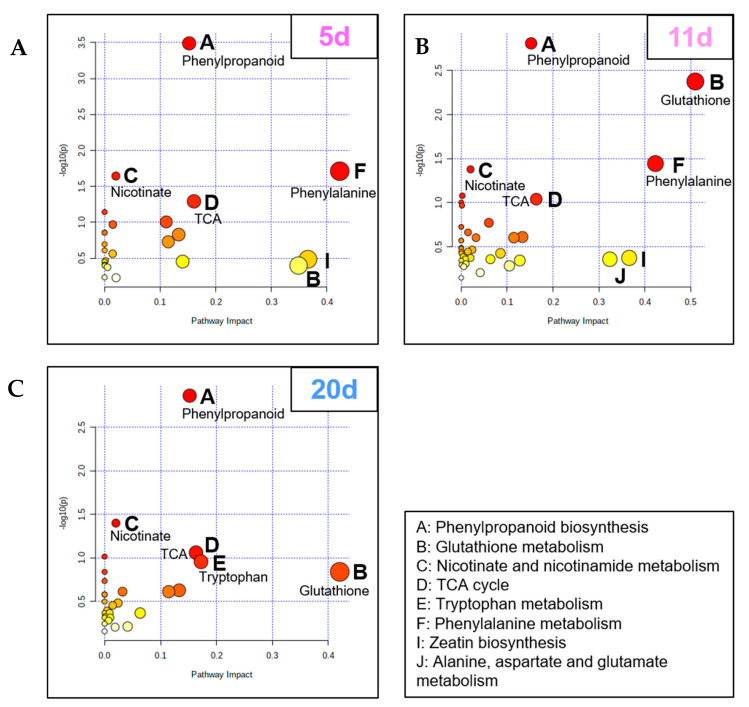
While it is generally acknowledged that drought is one of the main abiotic factors affecting plant growth, how mineral nutrition is specifically and negatively affected by water deficit has received very little attention, other than being analyzed as a consequence of reduced growth. Therefore, Brassica napus plants were subjected to a gradual onset of water deficits (mild, severe, or severe extended), and leaves were analyzed at the ionomic, transcriptomic and metabolic levels. The number of Differentially Expressed Genes (DEGs) and of the most differentially accumulated metabolites increased from mild (525 DEGs, 57 metabolites) to severe (5454 DEGs, 78 metabolites) and severe extended (9346 DEGs, 95 metabolites) water deficit. Gene ontology enrichment analysis of the 11,747 DEGs identified revealed that ion transport was one of the most significant processes affected, even under mild water deficit, and this was also confirmed by the shift in ionomic composition (mostly micronutrients with a strong decrease in Mo, Fe, Zn, and Mn in leaves) that occurred well before growth reduction. The metabolomic data and most of the transcriptomic data suggested that well-known early leaf responses to drought such as phytohormone metabolism (ABA and JA), proline accumulation, and oxidative stress defense were induced later than repression of genes related to nutrient transport.

Keywords: abscisic acid; genes related to transport; glutathione; ionome; jasmonic acid; mineral nutrition; proline; water deficit.


Conflict of interest statement

The authors declare no conflict of interest.

Figures

Figure 1
Figure 1
Shoot (plain) and root (hatch) biomasses of B. napus exposed for 5 d (mild), 11 d (severe), and 20 d (severe and extended) of water deficits (WD). Data are given as the mean ± SE (n = 5), and significant differences between control and plants exposed to WD are indicated as follows: *: p < 0.05; ***: p < 0.001.
Figure 2
Figure 2
Soil water content was expressed as a percentage of field capacity (FC) during the experiment. After sowing, plants were kept at 80% FC for thirty days (until 0 d). Thereafter, well-watered control plants were kept at 80% FC until the end of the experiment, while watering was stopped at 0 d until the FC of all water deficit (WD) pots dropped to 40% FC (5 d) and then 25% FC (11 d). Consequently, from 11 d to 20 d, WD pots were held at 25% FC by automatic watering. Soil water contents, as well as the amount of water to be supplied, were automatically assessed with the high throughput phenotyping platform during the experiment, and each value corresponds to the lowest soil water content recorded daily or twice a day.
Figure 3
Figure 3
Exploratory data analysis of RNA-seq from B. napus leaves in response to a water deficit. (A) Principal Component Analysis score plot from leaf samples using normalized count data after 5 d (■), 11 d (●), and 20 d (▲) in control (“ctrl”, black) or water deficit (“WD”, red) exposed plants. (B) Overview of the number of total and up and down DEGs identified with RNA-seq analysis in B. napus exposed to 5 d (mild), 11 d (severe), and 20 d (severe and extended) water deficit. (C) Distribution of DEGs specific to a single date of water deficit (green) or overlapped between two (yellow) or three (purple) time points. DEGs up and down-regulated are indicated in red and blue, respectively.
Figure 4
Figure 4
The most significantly enriched GO terms (“biological process”) from DEGs in leaves of B. napus exposed to 5 d (mild) (A), 11 d (severe) (B), and 20 d (severe and extended) (C) of water deficit. GO terms associated with transport (blue), redox homeostasis (gold), carbohydrate (red), and proline (pink) metabolism as well as photosynthesis (green) are highlighted, and terms enriched from specific DEGs at each time point are indicated with an asterisk (*).
Figure 5
Figure 5
GO Enrichment analysis using g:Profiler then REVIGO for up and down DEGs overlapping between 5 d (mild), 11 d (severe), and 20 d (severe and extended) of WD compared to control plants. Significantly enriched GO terms in “biological process” (A) and “molecular function” (B) are represented in rectangles combined into superclusters with the most closely related terms, and sizes have been set to reflect the adjusted p-value (p < 0.05).
Figure 6
Figure 6
Metabolomic Pathway Analysis from leaves of B. napus exposed to 5 d (mild) (A), 11 d (severe) (B), and 20 d (severe and extended) (C) of water deficit relative to control plants. Pathways are displayed as circles whose coordinates correspond to their adjusted p-value expressed in −log10(p) (for example, p < 0.05 corresponds to −log10(p) > 1.3) and their impact. For easier reading, low to high p-values are displayed with a white-yellow-orange to red gradient, with white representing the lowest values and red representing the highest; the size of the circle corresponds to the pathway impact score. Only the most impacted pathways having high statistical significance scores (−log10(p) > 1.3) or pathway impact (>0.15) are identified.
Figure 7
Figure 7
Summary schemes showing the main changes in leaves of B. napus induced by water deficit at the transcriptomic and metabolomics levels relative to control plants. B. napus plants were exposed to water deficit for 5 d (mild), 11 d (severe), and 20 d (severe and extended). Color-filled boxes indicate the log2 fold change of DEGs or the relative content of ABA (A), JA (B), and reduced and oxidized glutathione (C). Up and down modulations are indicated in red and blue, respectively. Significant variations in gene expression or metabolite levels between control and plants exposed to WD are indicated with an asterisk (*) for an adjusted p-value < 0.05. Solid and dashed lines indicate biosynthesis and degradation pathways, respectively. 1 hydroperoxylinolenic acid; 2 12,13(S)-epoxylinolenic acid; 3 2-oxo-phytodienoic acid; 4 oxo-pentenyll-cyclopentane; APX: ascorbate peroxidase; AsA: L-ascorbate; DHA: dehydroascorbic acid; DHAR: dehydroascorbate reductase; GPX: glutathione peroxidase; GR: glutathione reductase; MDAR: monodehydroascorbate reductase; MDHA: monodehydroascorbate.
Figure 7
Figure 7
Summary schemes showing the main changes in leaves of B. napus induced by water deficit at the transcriptomic and metabolomics levels relative to control plants. B. napus plants were exposed to water deficit for 5 d (mild), 11 d (severe), and 20 d (severe and extended). Color-filled boxes indicate the log2 fold change of DEGs or the relative content of ABA (A), JA (B), and reduced and oxidized glutathione (C). Up and down modulations are indicated in red and blue, respectively. Significant variations in gene expression or metabolite levels between control and plants exposed to WD are indicated with an asterisk (*) for an adjusted p-value < 0.05. Solid and dashed lines indicate biosynthesis and degradation pathways, respectively. 1 hydroperoxylinolenic acid; 2 12,13(S)-epoxylinolenic acid; 3 2-oxo-phytodienoic acid; 4 oxo-pentenyll-cyclopentane; APX: ascorbate peroxidase; AsA: L-ascorbate; DHA: dehydroascorbic acid; DHAR: dehydroascorbate reductase; GPX: glutathione peroxidase; GR: glutathione reductase; MDAR: monodehydroascorbate reductase; MDHA: monodehydroascorbate.
Figure 8
Figure 8
Log2-fold changes in DEGs and the proline content in leaves of B. napus exposed to water deficit for 5 d (mild), 11 d (severe), and 20 d (severe extended), relative to control plants. Significant variations between control and plants exposed to WD are indicated with an asterisk (*) for adjusted p-value < 0.05. P5C: pyrroline-5-carboxylate; P5CDH: delta-pyrroline-5-carboxylate dehydrogenase; P5CS1: pyrroline-5-carboxylate synthase; PDH: proline dehydrogenase; POX: proline oxidase.
Figure 9
Figure 9
Expression profiles of 114 genes encoding macronutrient (A) or micronutrient (B) transporters and changes in mineral nutrient contents in leaves of B. napus exposed to 5, 11, and 20 d of water deficit, relative to control plants. Log2 fold changes in DEGs are colored in red (up) or blue (down), and non-significant variations in gene expression are blank (adjusted p-value < 0.05). Boxes indicate the relative content of nutrients as the ratio WD/control, and only significant variations are reported.

References

    1. Dai A. Increasing Drought under Global Warming in Observations and Models. Nat. Clim. Chang. 2013;3:52–58. doi: 10.1038/nclimate1633. - DOI
    1. Qaderi M.M., Kurepin L.V., Reid D.M. Growth and Physiological Responses of Canola (Brassica napus) to Three Components of Global Climate Change: Temperature, Carbon Dioxide and Drought. Physiol. Plant. 2006;128:710–721. doi: 10.1111/j.1399-3054.2006.00804.x. - DOI
    1. Champolivier L., Merrien A. Effects of Water Stress Applied at Different Growth Stages to Brassica napus L. Var. Oleifera on Yield, Yield Components and Seed Quality. Eur. J. Agron. 1996;5:153–160. doi: 10.1016/S1161-0301(96)02004-7. - DOI
    1. Ghobadi M., Bakhshandeh M., Fathi G., Gharineh M.H., Alami-Said K., Naderi A., Ghobadi M.E. Short and Long Periods of Water Stress during Different Growth Stages of Canola (Brassica napus L.): Effect on Yield, Yield Components, Seed Oil and Protein Contents. J. Agron. 2006;5:336–341.
    1. Branka K., Bosko Andrija G., Angelina T., Goran D. Yield and Chemical Composition of Soybean Seed under Different Irrigation Regimes in the Vojvodina Region. Plant Soil Environ. 2017;63:34–39. doi: 10.17221/673/2016-PSE. - DOI