. 2022 Jan 11;23(2):776.
doi: 10.3390/ijms23020776.

PAR4-Mediated PI3K/Akt and RhoA/ROCK Signaling Pathways Are Essential for Thrombin-Induced Morphological Changes in MEG-01 Cells

Affiliations

PAR4-Mediated PI3K/Akt and RhoA/ROCK Signaling Pathways Are Essential for Thrombin-Induced Morphological Changes in MEG-01 Cells

Yunkyung Heo et al. Int J Mol Sci. .

Abstract

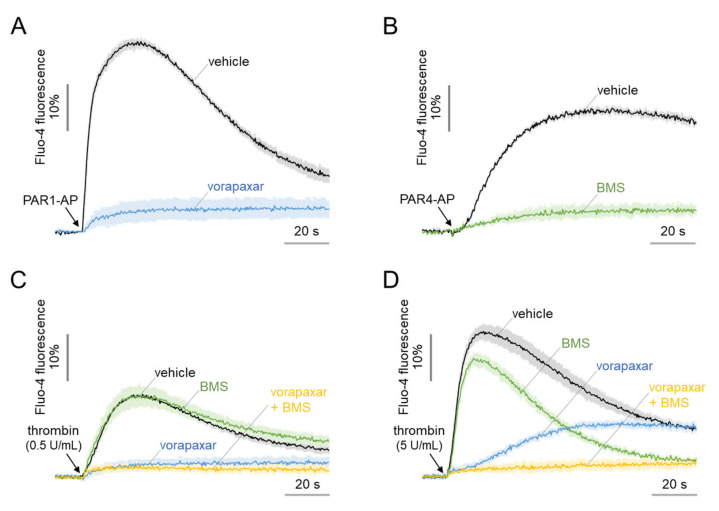
Thrombin stimulates platelets via a dual receptor system of protease-activated receptors (PARs): PAR1 and PAR4. PAR1 activation induces a rapid and transient signal associated with the initiation of platelet aggregation, whereas PAR4 activation results in a prolonged signal, required for later phases, that regulates the stable formation of thrombus. In this study, we observed differential signaling pathways for thrombin-induced PAR1 and PAR4 activation in a human megakaryoblastic leukemia cell line, MEG-01. Interestingly, thrombin induced both calcium signaling and morphological changes in MEG-01 cells via the activation of PAR1 and PAR4, and these intracellular events were very similar to those observed in platelets shown in previous studies. We developed a novel image-based assay to quantitatively measure the morphological changes in living cells, and observed the underlying mechanism for PAR1- and PAR4-mediated morphological changes in MEG-01 cells. Selective inhibition of PAR1 and PAR4 by vorapaxar and BMS-986120, respectively, showed that thrombin-induced morphological changes were primarily mediated by PAR4 activation. Treatment of a set of kinase inhibitors and 2-aminoethoxydiphenyl borate (2-APB) revealed that thrombin-mediated morphological changes were primarily regulated by calcium-independent pathways and PAR4 activation-induced PI3K/Akt and RhoA/ROCK signaling pathways in MEG-01 cells. These results indicate the importance of PAR4-mediated signaling pathways in thrombin-induced morphological changes in MEG-01 cells and provide a useful in vitro cellular model for platelet research.

Keywords: MEG-01; PAR1; PAR4; morphological change; platelet; thrombin.


Conflict of interest statement

The authors declare no conflict of interest.

Figures

Figure 1
Figure 1
Endogenous expression of PAR1 and PAR4 in MEG-01 cells. (A) RT-PCR analysis for PAR1 and PAR4 in MEG-01 cells. PCR products were detected at expected product sizes as indicated. (B) Western blot analysis for PAR1 in MEG-01 cells. A2058 and PAR1 knocked out (KO) A2058 cells were used as positive and negative controls, respectively. PAR1 was knocked out by CRISPR/Cas9 in A2058 cells. All experiments were repeated three times.
Figure 2
Figure 2
Intracellular calcium increase in response to the activation of PAR1 and PAR4 in MEG-01 cells. Intracellular calcium increase in MEG-01 cells induced by (A) PAR1-AP (100 μM), (B) PAR4-AP (100 μM), (C) low-dose thrombin (0.5 U/mL), and (D) high-dose thrombin (5 U/mL). PAR1 and PAR4 were completely blocked by vorapaxar and BMS-986120 (BMS), respectively. Vorapaxar and BMS were applied at 10 μM for 10 min prior to treatment of PAR1-AP, PAR4-AP and thrombin (mean ± S.D., n = 3–5).
Figure 3
Figure 3
Morphological changes induced by PAR1 and PAR4 activation in MEG-01 cells. (A) Representative images of F-actin-stained MEG-01 cells. MEG-01 cells were treated with PAR1-AP (100 μM), PAR4-AP (100 μM), or thrombin (0.1 U/mL) for 30 min and fixed, and then labeled with phalloidin-FITC (green). Nuclei were stained with DAPI (blue). Scale bar = 10 μm. (B) Measurement of the circularity of MEG-01 cells. The circularity was measured using Lionheart software. Each dot corresponds to individual analyzed cells. A total of 20 cells were analyzed for each group (mean ± S.D., n = 20). (C) Measurement of diameter of MEG-01 cells. The diameter was measured using Lionheart software. For each group, 20 cells were analyzed (mean ± S.D., n = 20); ** p < 0.01, *** p < 0.001.
Figure 4
Figure 4
PAR1- and PAR4-mediated morphological changes in living MEG-01 cells. (A) Schematic diagram of experimental setup. (B) Representative images of MEG-01 cells used for analysis of circularity measurements. Cells were stained with calcein-AM (1 μg/mL) and pretreated with 10 μM of vorapaxar and BMS-986120 (BMS), and then PAR1-AP (100 μM), PAR4-AP (100 μM), or thrombin (0.1 U/mL) were applied for 30 min. Scale bar = 10 μm. (CE) Summary of circularity. PAR1 and PAR4 were inhibited with vorapaxar and BMS-986120 (BMS) at the indicated concentrations, respectively. Thrombin-induced activation of PAR1 and PAR4 was blocked by vorapaxar (10 μM), BMS-986120 (10 μM), or both, respectively. Images were captured automatically and circularity was measured using Lionheart software (mean ± S.D., n = 4–5). * p < 0.05, ** p < 0.01, *** p < 0.001.
Figure 5
Figure 5
Time-course assessment of PAR1- and PAR4-mediated morphological changes. (A) Representative time-lapse images of MEG-01 cells. Cells were stained with calcein-AM (1 μg/mL) and treated with PAR1-AP (100 μM) and PAR4-AP (100 μM). Images were automatically captured by Lionheart every 30 min. Scale bar = 10 μm. (BE) Summary of circularity. Cells were applied with PAR1-AP, PAR4-AP, and 0.1 U/mL of thrombin, and circularity was measured in time-course using Lionheart software (mean ± S.D., n = 4). * p < 0.05, ** p < 0.01, *** p < 0.001, ns: not significant. Not treated (NT).
Figure 6
Figure 6
Effect of intracellular calcium signaling on morphological changes in MEG-01 cells. (A,B) Inhibition of PAP1-AP- and PAR4-AP-induced intracellular calcium increase by 2-APB. MEG-01 cells were pre-treated with 2-APB at the indicated concentrations prior to applying 100 μM of PAR1-AP (A) or PAR4-AP (B). (C) Measurement of ionomycin (10 μM)-induced intracellular calcium increase. (DF) Summary of morphological changes. MEG-01 cells were pre-treated with 2-APB at the indicated concentrations for 30 min prior to applying 100 μM of PAR1-AP (D) or PAR4-AP (E), and ionomycin was applied at the indicated concentrations for 30 min (F). (G) Representative images of MEG-01 cells. Cells were pretreated with 100 μM of 2-APB for 30 min, and then PAR1-AP (100 μM) and PAR4-AP (100 μM) were applied for 30 min or treated with ionomycin (10 μM) for 30 min. Calcein-AM-stained images were captured automatically and circularity was measured using Lionheart software (mean ± S.D., n = 4). Scale bar = 10 μm. * p < 0.05, ** p < 0.01, *** p < 0.001.
Figure 7
Figure 7
Identification of kinases involved in PAR1- and PAR4-mediated morphological changes in MEG-01 cells. (A,B) Dot plots of primary screening results for kinase inhibitors that inhibit PAR1- and PAR4-mediated morphological changes. Validated kinase inhibitors that exhibit >80% inhibitory effects on morphological changes are classified according to the class of kinase, and one representative compound for each class is indicated. (C) Representative images of MEG-01 cells were stained with calcein-AM (1 μg/mL). Cells were pretreated with 10 μM of indicated kinase inhibitors for 30 min before application of PAR1-AP (100 μM) or PAR4-AP (100 μM) for 30 min. Scale bar = 10 μm. (DF) Summary of circularity. Cells were pretreated with 10 μM of indicated kinase inhibitors for 30 min and then PAR1-AP (100 μM), PAR4-AP (100 μM), or thrombin (0.1 U/mL) were applied. Images were taken by Lionheart automatically and circularity was measured using Lionheart software (mean ± S.D., n = 4). * p < 0.05, ** p < 0.01, *** p < 0.001.
Figure 8
Figure 8
Schematic model of the underlying mechanisms involved in thrombin-induced morphological changes via PAR1 and PAR4 in MEG-01 cells.

References

    1. Stalker T.J., Newman D.K., Ma P., Wannemacher K.M., Brass L.F. Antiplatelet Agents: Handbook of Experimental Pharmacology. Springer; Berlin/Heidelberg, Germany: 2012. Platelet Signaling; pp. 59–85. - DOI - PMC - PubMed
    1. Offermanns S. Activation of Platelet Function Through G Protein–Coupled Receptors. Circ. Res. 2006;99:1293–1304. doi: 10.1161/01.RES.0000251742.71301.16. - DOI - PubMed
    1. Kahn M.L., Nakanishi-Matsui M., Shapiro M.J., Ishihara H., Coughlin S.R. Protease-activated receptors 1 and 4 mediate activation of human platelets by thrombin. J. Clin. Investig. 1999;103:879–887. doi: 10.1172/JCI6042. - DOI - PMC - PubMed
    1. Seeley S., Covic L., Jacques S.L., Sudmeier J., Baleja J.D., Kuliopulos A. Structural Basis for Thrombin Activation of a Protease-Activated Receptor: Inhibition of Intramolecular Liganding. Chem. Biol. 2003;10:1033–1041. doi: 10.1016/j.chembiol.2003.10.014. - DOI - PubMed
    1. Li Z., Delaney M.K., O’Brien K.A., Du X. Signaling During Platelet Adhesion and Activation. Arter. Thromb. Vasc. Biol. 2010;30:2341–2349. doi: 10.1161/ATVBAHA.110.207522. - DOI - PMC - PubMed

LinkOut - more resources