. 2022 Jan 13;23(2):865.
doi: 10.3390/ijms23020865.

Chebulinic Acid Suppresses Adipogenesis in 3T3-L1 Preadipocytes by Inhibiting PPP1CB Activity

Affiliations

Chebulinic Acid Suppresses Adipogenesis in 3T3-L1 Preadipocytes by Inhibiting PPP1CB Activity

Jinsoo Kim et al. Int J Mol Sci. .

Abstract

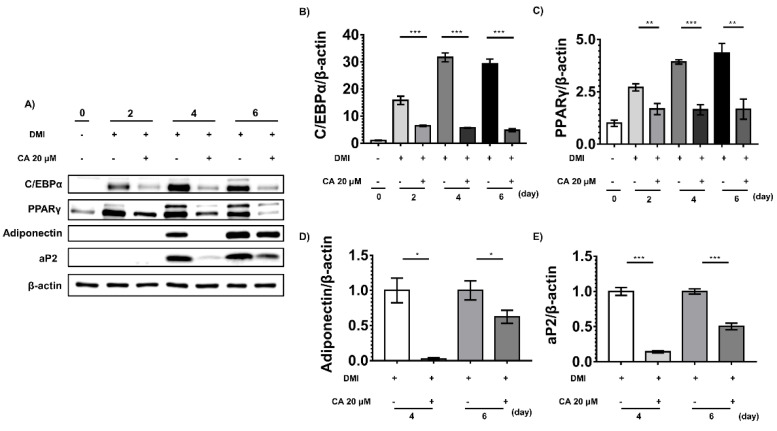
Depletion of protein phosphatase-1 catalytic subunit beta (PPP1CB), a serine/threonine protein phosphatase and potent adipogenic activator, suppresses the differentiation of 3T3-L1 preadipocytes into mature adipocytes. Therefore, PPP1CB is considered as a potential therapeutic target for obesity. We screened 1033 natural products for PPP1CB inhibitors and identified chebulinic acid, which is abundantly present in the seeds of Euphoria longana and fruits of Terminalia chebula. Chebulinic acid strongly inhibited the hydrolysis of 6,8-difluoro-4-methylumbelliferyl phosphate by PPP1CB (IC50 = 300 nM) and demonstrated potent antiadipogenic effects in 3T3-L1 preadipocytes in a concentration-dependent manner. Additional studies have demonstrated that chebulinic acid suppresses early differentiation by downregulating key transcription factors that control adipogenesis in 3T3-L1 cells. These results suggested that chebulinic acid may be a potential therapeutic agent for treating obesity by inhibiting PPP1CB activity.

Keywords: 3T3-L1 adipocyte; PPP1CB; adipogenesis; chebulinic acid; natural product; obesity.


Conflict of interest statement

The authors declare no conflict of interest.

Figures

Figure 1
Figure 1
Identification of chebulinic acid as an anti-obesity drug candidate by screening of 1033 natural products for PPP1CB inhibitors. A total of 1033 natural products were transferred to black/black bottom 96-well plates and enzymatic screening was performed with PPP1CB. Inhibitory activity of each compound was evaluated using 6,8-difluoro-4-methylumbelliferyl phosphate (DiFMUP)-based assays, and the inhibitory effects of the 1033 natural products on PPP1CB were calculated using control-based normalization. The top 45 hits were selected. Among the 45 hits, nine compounds that have not reported anti-adipogenic effects were sorted based on literature search. These nine selected compounds were evaluated using oil red O staining to determine whether they suppress adipogenesis in 3T3-L1 cells. Finally, chebulinic acid was selected as the most potent compound for obesity treatment.
Figure 2
Figure 2
Anti-adipogenic activities of the nine selected compounds. After sorting out 45 hits by enzymatic assays, nine compounds were selected as novel compounds for the investigation of their anti-adipogenic activity. To validate the anti-adipogenic effects of the nine compounds, the cells were cultured until reaching 100% confluency. Then, the cells were treated with DMI containing 20 μL of indicated compound or 0.1% DMSO as control. After 6 days of differentiation, the cells were fixed with 4% paraformaldehyde. Then, the fixed cells were stained by oil red O solutions and washed with distilled water. The stained cells were captured by a Cytation 7 cell imaging multimode reader; 65: alpha-boswellic acid; 147: chebulinic acid; 189: cyanidin chloride; 271: gallic acid ethyl ester; 272: gallocatechin gallate; 410: medicagenic acid; 531: quercetin 7-rhamnoside; 558: salvianolic acid c; 583: sennoside B. Scale bar: 200 μm.
Figure 3
Figure 3
Inhibitory effect of chebulinic acid on PPP1CB. (A) Chemical structure of chebulinic acid (CA); (B) the half-maximal inhibitory concentration (IC50) of chebulinic acid against PPP1CB catalytic activity. Chebulinic acid was diluted from 12 to 0.019 μM in dimethyl sulfoxide (DMSO). Next, 10 μL of diluted chebulinic acid was added to 80 μL of reaction buffer containing 304 μM DiFMUP. Next, 10 μL PPP1CB (1.5 nM of final concentration) was added to the reaction buffer containing DiFMUP and chebulinic acid. IC50 value was calculated using the sigmoid dose–response model with the seven data points; (C) cytotoxicity of chebulinic acid on 3T3-L1 preadipocytes. Cell viabilities were measured using the water-soluble tetrazolium (WST)-1 assay. Results are presented as the mean ± standard deviation.
Figure 4
Figure 4
Effects of different concentrations of chebulinic acid (CA) on dexamethasone, methylisobutylxanthine, and insulin (DMI)-induced differentiation of 3T3-L1 preadipocytes. (A) Fully cultured 3T3-L1 preadipocytes were treated with DMI containing 5, 10, or 20 μM chebulinic acid or 0.1% DMSO as control group. After confirming fully differentiated cells in the control group, the cells were fixed with 4% paraformaldehyde and stained with 0.3% oil red O solution. After washing two times with distilled water, representative images of the cells were captured by a Cytation 7 cell imaging multimode reader. Scale bar: 200 μm; (B) quantification of the amount of fat. oil red O in adipocyte was extracted with isopropanol and transferred into the microwell plate followed by detection of absorption at 520 nm on a microplate reader. The results are presented as the mean ± standard deviation (SD, n = 3); * p < 0.05, ** p < 0.01, and *** p < 0.001 compared to the control group. Statistical analysis was performed by one-way ANOVA for multiple comparisons followed by Tukey’s test.
Figure 5
Figure 5
Effects of chebulinic acid (CA) on dexamethasone, methylisobutylxanthine, and insulin (DMI)-induced differentiation of 3T3-L1 preadipocytes in different stages of cells. (A) The schedule for chebulinic acid treatment during the differentiation of 3T3-L1 preadipocytes to adipocytes. Cells were treated with chebulinic acid (20 μM) on day 0–2 (B-1), day 2–4 (B-2), or day 4–6 (B-3) during differentiation by DMI treatment; (B) representative images of oil red O-stained cells. Each number on the picture corresponds to the number listed vertically (B-1, B-2, B-3) in Figure 5A. Scale bar: 100 μm; (C) after the extraction of oil red O from the stained cells, their absorbance was measured at 520 nm. The results are presented as the mean ± standard deviation (SD, n = 3); *** p < 0.001 compared to the control group.
Figure 6
Figure 6
Effects of chebulinic acid (CA) on adipogenic factors and adipocyte markers. (A) Protein expression levels of adipogenic factors and adipocyte markers were detected three times independently using Western blotting. At the indicated time, 3T3-L1 cells were differentiated with dexamethasone, methylisobutylxanthine, and insulin (DMI) in the presence of 20 μM chebulinic acid or 0.1% dimethyl sulfoxide (DMSO) as a negative control; (B,C) the quantified graphs of C/EBPα (B) and PPARγ (C) normalized to non-differentiated group were shown; (D,E) since aP2 and adiponectin were not detected until day 2, these were normalized to control group in each treated day. Results are presented as the mean ± standard deviation (SD, n = 3) of three independent experiments; * p < 0.05, ** p < 0.01, and *** p < 0.001 compared with the control group.
Figure 7
Figure 7
Effect of chebulinic acid (CA) on the mRNA expression levels of genes related to adipogenesis of 3T3-L1 cells induced by dexamethasone, methylisobutylxanthine, and insulin (DMI). The mRNA levels of PPARγ (A), C/EBPα (B), FAS (C), and SCD (D) were quantified using RT-PCR and normalized to those of GAPDH as an internal control. Results are presented as the mean ± standard deviation (SD, n = 3) of three independent experiments; * p < 0.05, ** p < 0.01, and *** p < 0.001 compared to the control group.

References

    1. Ng M., Fleming T., Robinson M., Thomson B., Graetz N., Margono C., Mullany E.C., Biryukov S., Abbafati C., Abera S.F. Global, regional, and national prevalence of overweight and obesity in children and adults during 1980–2013: A systematic analysis for the Global Burden of Disease Study 2013. Lancet. 2014;384:766–781. doi: 10.1016/S0140-6736(14)60460-8. - DOI - PMC - PubMed
    1. Ambele M.A., Dhanraj P., Giles R., Pepper M.S. Adipogenesis: A Complex Interplay of Multiple Molecular Determinants and Pathways. Int. J. Mol. Sci. 2020;21:4283. doi: 10.3390/ijms21124283. - DOI - PMC - PubMed
    1. Carneiro I.P., Elliott S.A., Siervo M., Padwal R., Bertoli S., Battezzati A., Prado C.M. Is obesity associated with altered energy expenditure? Adv. Nutr. 2016;7:476–487. doi: 10.3945/an.115.008755. - DOI - PMC - PubMed
    1. Iozzo P. Myocardial, perivascular, and epicardial fat. Diabetes Care. 2011;34:S371–S379. doi: 10.2337/dc11-s250. - DOI - PMC - PubMed
    1. Blüher M. Obesity: Global epidemiology and pathogenesis. Nat. Rev. Endocrinol. 2019;15:288–298. doi: 10.1038/s41574-019-0176-8. - DOI - PubMed

MeSH terms

LinkOut - more resources