. 2022 Jan 14;23(2):891.
doi: 10.3390/ijms23020891.

The Landscape of Autophagy-Related (ATG) Genes and Functional Characterization of TaVAMP727 to Autophagy in Wheat

Affiliations

The Landscape of Autophagy-Related (ATG) Genes and Functional Characterization of TaVAMP727 to Autophagy in Wheat

Wenjie Yue et al. Int J Mol Sci. .

Abstract

Autophagy is an indispensable biological process and plays crucial roles in plant growth and plant responses to both biotic and abiotic stresses. This study systematically identified autophagy-related proteins (ATGs) in wheat and its diploid and tetraploid progenitors and investigated their genomic organization, structure characteristics, expression patterns, genetic variation, and regulation network. We identified a total of 77, 51, 29, and 30 ATGs in wheat, wild emmer, T. urartu and A. tauschii, respectively, and grouped them into 19 subfamilies. We found that these autophagy-related genes (ATGs) suffered various degrees of selection during the wheat's domestication and breeding processes. The genetic variations in the promoter region of Ta2A_ATG8a were associated with differences in seed size, which might be artificially selected for during the domestication process of tetraploid wheat. Overexpression of TaVAMP727 improved the cold, drought, and salt stresses resistance of the transgenic Arabidopsis and wheat. It also promoted wheat heading by regulating the expression of most ATGs. Our findings demonstrate how ATGs regulate wheat plant development and improve abiotic stress resistance. The results presented here provide the basis for wheat breeding programs for selecting varieties of higher yield which are capable of growing in colder, drier, and saltier areas.

Keywords: TaVAMP727; Triticeae species; abiotic stress; autophagic homeostasis; evolution; seed size.


Conflict of interest statement

The authors declare no conflict of interest.

Figures

Figure 1
Figure 1
Maximum likelihood phylogeny of autophagy-related proteins (ATGs) from wheat (T. aestivum), wild emmer (T. turgidum ssp. dicoccoides), T. urartu and A. tauschii. IQ-TREE software was used to construct a phylogenetic tree of ATGs with the bootstrap value estimation based on 1000 iterations and visualized by iTOL. The names with a solid red circle are wheat ATGs, dark-turquoise square are wild emmer ATGs, yellow triangle are T. urartu ATGs and purple star are A. tauschii ATGs. The Green to red color represents the low to high bootstrap value. All identified ATGs were grouped into 19 clusters (subfamilies).
Figure 2
Figure 2
Annotation of identified ATGs. (A) GO enrichment of ATGs amongst different subfamilies. The top ten significantly enriched GO terms are displayed. The horizontal axis represents the number of ATGs which are annotated to the displayed GO terms; the vertical axis represents descriptive information of the enriched GO terms. Colors correspond to a value of p.adjust, which turns from blue to red as the p.adjust value changes from low to high. (B) KEGG enrichment of ATGs amongst different subfamilies. The horizontal axis represents autophagy subfamilies; the vertical axis represents descriptive information of annotated KEGG pathways. The fuchsia color denotes that the corresponding subfamily members were annotated in the KEGG pathway and the yellow color means that family members were not annotated. KEGG pathways highlighted by bold red font refer that these pathways can be found in plants.
Figure 3
Figure 3
Protein-protein association networks of ATGs. The identified ATGs were submitted to the STRING database to construct the protein-protein interaction networks based on the Triticum aestivum dataset. The network could be clustered into four parts and represented in different colors. The circles are the ATGs identified in this study, and the squares represent the co-expressed proteins found in the database.
Figure 4
Figure 4
Collinearity relation of four Triticeae species and synonymous (dS) to nonsynonymous (dN) substitution ratio among ATG subfamilies. (A) Collinearity relations of ATGs between every two species are shown in different colors. (B) The collinearity relationship among A. tauschii to T. urartu and wild emmer. (C,D) The dN/dS ratio distribution of wheat and its three diploid and tetraploid progenitors among different subfamilies.
Figure 5
Figure 5
Distribution of TaATGs among genome-wide selective signals during domestication and breeding processes of wheat. (A,B,E,F,I,J) The fst and ln π ratios between wild emmer and a landrace were used to evaluate the domestication of wheat. (C,D,G,H,K,L) The fst and ln π ratio between a landrace and a variety were used to evaluate wheat’s improvement. Resequencing reads were mapped to the A,B and D subgenomes of wheat according to chromosome origin. All 77 TaATGs were highlighted against the position on each of the 21 chromosomes in different colors. The top 10% of the genome-wide value was taken as the threshold for selective sweeps and is shown as horizontal black dashed lines. The TaATGs above the threshold line are labeled.
Figure 6
Figure 6
Haplotype-based phenotyping analysis. (AC) Distribution of three haplotypes (Hap-CGC, Hap-CGA and Hap-TAA) in different tetraploid wheat populations. Three haplotypes located in the promoter region of Ta2A_ATG8a were found and their distribution in different tetraploid wheat populations was diverse. (DF) Haplotype-based grain character analysis. The association between three haplotypes and grain characters was analyzed. Abnormal value of TKW, corresponding to HAP-CGA, was not considered in testing for significant difference test. ** p < 0.01. (G) Changes of cis-acting elements resulted from SPNs in the promoter region of Ta2A_ATG8a and their distribution in different populations.
Figure 7
Figure 7
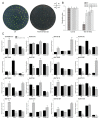
Influence of TaVAMP727 on ATGs in Arabidopsis. (A,B) The germination rate of TaVAMP727 overexpressed lines under either drought (415 mM D-mannitol) or salt (180 mM NaCl) stress. Error bars represent the SD. Columns bars followed by different letters are statistically different according to the analysis of variance followed by Duncan’s Multiple Range Test (control, p = 0.84; 180 mM NaCl, p = 0.0018; n = 3). (C) The expression levels of overexpressed TaVAMP727 and 15 Arabidopsis ATGs were analyzed via reverse transcription-quantitative real-time PCR (RT-qPCR) in both wild-type and TaVAMP727 transgenic line #19 under salt and drought stress. The ubiquitin 5 (UBQ5) (At3G62250) was used as housekeeping genes. Error bars represent the SD. * p < 0.05; ** p < 0.01; n = 3.
Figure 8
Figure 8
Overexpression of TaVAMP727 in wheat. (A,B) The expression level of TaVAMP727 in overexpressed line and Fielder (WT) under cold (4 °C) for 12 h, air-dry for 6 h and salt (150 mM NaCl solution) for 24 h. Error bars represent the SD. Columns bars followed by different letters are statistically different according to the analysis of variance followed by Duncan’s Multiple Range Test (A, p = 0.1947; B, p = 0.0005; n = 3). (C) Survival rate determination of trileaf stage Fielder and TaVAMP727 transgenic wheat seedlings under drought stress. (D) The heating date comparison of Fielder and TaVAMP727 transgenic lines. (E) The relative expression levels of 23 TaATGs in TaVAMP727 overexpressed line under diverse abiotic stresses. The glyceraldehyde-3-phosphate dehydrogenase (GA3PD) was used as housekeeping genes.

References

    1. van Doorn W.G., Papini A. Ultrastructure of autophagy in plant cells: A review. Autophagy. 2013;9:1922–1936. doi: 10.4161/auto.26275. - DOI - PubMed
    1. Floyd B.E., Pu Y., Soto-Burgos J., Bassham D.C. To Live or Die: Autophagy in Plants. In: Gunawardena A.N., McCabe P.F., editors. Plant Programmed Cell Death. Springer International Publishing; Berlin, Germany: 2015. pp. 269–300.
    1. Suttangkakul A., Li F.Q., Chung T., Vierstra R.D. The ATG1/ATG13 protein kinase complex is both a regulator and a target of autophagic recycling in Arabidopsis. Plant Cell. 2011;23:3761–3779. doi: 10.1105/tpc.111.090993. - DOI - PMC - PubMed
    1. Zhuang X., Chung K.P., Cui Y., Lin W., Gao C., Kang B.H., Jiang L. ATG9 regulates autophagosome progression from the endoplasmic reticulum in Arabidopsis. Proc. Natl. Acad. Sci. USA. 2017;114:E426–E435. doi: 10.1073/pnas.1616299114. - DOI - PMC - PubMed
    1. Marshall R.S., Vierstra R.D. Autophagy: The master of bulk and selective recycling. Annu. Rev. Plant Biol. 2018;69:173–208. doi: 10.1146/annurev-arplant-042817-040606. - DOI - PubMed

LinkOut - more resources