Comparative Study
. 2022 Jan 15;23(2):946.
doi: 10.3390/ijms23020946.

Common and Distinctive Intercellular Communication Patterns in Human Obstructive and Nonobstructive Hypertrophic Cardiomyopathy

Affiliations
Comparative Study

Common and Distinctive Intercellular Communication Patterns in Human Obstructive and Nonobstructive Hypertrophic Cardiomyopathy

Christina J Codden et al. Int J Mol Sci. .

Abstract

Hypertrophic Cardiomyopathy (HCM) is a common inherited disorder characterized by unexplained left ventricular hypertrophy with or without left ventricular outflow tract (LVOT) obstruction. Single-nuclei RNA-sequencing (snRNA-seq) of both obstructive and nonobstructive HCM patient samples has revealed alterations in communication between various cell types, but no direct and integrated comparison between the two HCM phenotypes has been reported. We performed a bioinformatic analysis of HCM snRNA-seq datasets from obstructive and nonobstructive patient samples to identify differentially expressed genes and distinctive patterns of intercellular communication. Differential gene expression analysis revealed 37 differentially expressed genes, predominantly in cardiomyocytes but also in other cell types, relevant to aging, muscle contraction, cell motility, and the extracellular matrix. Intercellular communication was generally reduced in HCM, affecting the extracellular matrix, growth factor binding, integrin binding, PDGF binding, and SMAD binding, but with increases in adenylate cyclase binding, calcium channel inhibitor activity, and serine-threonine kinase activity in nonobstructive HCM. Increases in neuron to leukocyte and dendritic cell communication, in fibroblast to leukocyte and dendritic cell communication, and in endothelial cell communication to other cell types, largely through changes in the expression of integrin-β1 and its cognate ligands, were also noted. These findings indicate both common and distinct physiological mechanisms affecting the pathogenesis of obstructive and nonobstructive HCM and provide opportunities for the personalized management of different HCM phenotypes.

Keywords: Hypertrophic Cardiomyopathy; dendritic cells; integrin-β1; left ventricular outflow tract obstruction; single-nucleus RNA-sequencing.


Conflict of interest statement

The authors declare no conflict of interest. The funders had no role in the design of the study; in the collection, analysis, or interpretation of data; in the writing of the manuscript; or in the decision to publish the results.

Figures

Figure 1
Figure 1
SnRNA-seq cluster identification, biomarker gene expression, and nuclei distribution across conditions. (A) UMAP representation of clusters with cell assignment labels. (B) Dot plot representation of cell type specific marker genes used to assign cell identity to each cluster. (C) UMAP representation of clusters visualized according to disease label.
Figure 2
Figure 2
Differential expression of four representative cardiomyocyte genes in UMAP space from Table 1, revealing increased expression in nonobstructive HCM cardiomyocytes.
Figure 3
Figure 3
Gene ontology analysis of genes differentially expressed in nonobstructive and obstructive HCM. (A) Analysis of molecular functions, biological processes, and cellular components showing significant changes in nonobstructive compared to obstructive HCM. (B) GO classifications of genes that are increased in nonobstructive HCM compared to obstructive HCM. (C) GO classifications of genes that are decreased in nonobstructive HCM compared to obstructive HCM.
Figure 4
Figure 4
Intercellular communication networks in normal, nonobstructive, and obstructive HCM. (A) Cell–cell communication networks between cardiac cell types in normal control (left), nonobstructive (middle), and obstructive HCM (right) conditions. Line color indicates ligand broadcasting by the cell population with the same color. Lines connect to cell types which expressed cognate receptors. Line thickness is proportional to the number of uniquely expressed ligand–receptor pairs. Loops indicate communication within a cell type. (B) Quantity of ligands and receptors in expressed ligand–receptor pairs described by cell type and condition (normal control, nonobstructive HCM, or obstructive HCM). (CE) Cell–cell communication networks broken down by cell type in normal control (C), nonobstructive HCM (D), and obstructive HCM (E) conditions. Figure formatting in C-E follows panel A and numbers indicate the quantity of uniquely expressed ligand–receptor pairs between the broadcasting cell type (expressing ligand) and receiving cell type (expressing receptor).
Figure 5
Figure 5
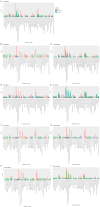
Bar plot representing the total count of ligands (in expressed ligand–receptor pairs) associated with different cellular processes in normal, nonobstructive HCM, and obstructive HCM IVS Cells. Bar color distinguishes ligand count in normal, nonobstructive HCM, or obstructive HCM conditions. (A) Comparison of molecular functions across all cell types. (B) Comparison in cardiomyocytes. (C) Fibroblasts. (D) Endothelial cells. (E) Pericytes. (F) Dendritic cells. (G) Leukocytes. (H) Smooth muscle cells. (I) Neurons.
Figure 6
Figure 6
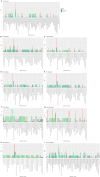
Bar plot representing the total count of receptors (in expressed ligand–receptor pairs) associated with different cellular processes in normal, nonobstructive HCM, and obstructive HCM IVS cells. Bar color distinguishes receptor count in normal or nonobstructive HCM conditions. (A) Comparison of molecular functions across all cell types. (B) Comparison in cardiomyocytes. (C) Fibroblasts. (D) Endothelial cells. (E) Pericytes. (F) Dendritic cells. (G) Leukocytes. (H) Smooth muscle cells. (I) Neurons.
Figure 7
Figure 7
Cell–cell communication networks between fibroblast subtypes and other heart cell types in normal control, nonobstructive HCM, and obstructive HCM conditions. (A) Comparison of normal (left), nonobstructive (middle), and obstructive HCM (right) communication networks. Line color indicates ligand broadcast by the cell population with the same color. Lines connect to cell types that expressed cognate receptors. Line thickness is proportional to the number of uniquely expressed ligand–receptor pairs. Loops indicate communication within a cell type. (B) Quantity of ligands and receptors in expressed ligand–receptor pairs described by cell type and condition (normal, nonobstructive HCM, or obstructive HCM). (CE) Cell–cell communication networks broken down by cell type and fibroblast cluster in normal control (C), nonobstructive (D), and obstructive (E) conditions. Figure formatting follows panel A. Numbers indicate the quantity of uniquely expressed ligand–receptor pairs between the broadcasting cell type (expressing ligand) and receiving cell type (expressing receptor).
Figure 8
Figure 8
Cell–cell communication networks between cardiomyocyte subtypes and other heart cells in normal control, nonobstructive HCM, and obstructive HCM conditions. (A) Comparison of normal (left), nonobstructive HCM (middle), and obstructive HCM (right) communication networks. Line color indicates ligand broadcast by the cell population with the same color. Lines connect to cell types that expressed cognate receptors. Line thickness is proportional to the number of uniquely expressed ligand–receptor pairs. Loops indicate communication within a cell type. (B) Quantity of ligands and receptors in expressed ligand–receptor pairs described by cell type and condition (normal, nonobstructive HCM, or obstructive HCM). (CE) Cell–cell communication networks broken down by cell type and cardiomyocyte cluster in normal control (C), nonobstructive HCM (D), and obstructive HCM (E) conditions. Figure formatting follows panel A. Numbers indicate the quantity of uniquely expressed ligand–receptor pairs between the broadcasting cell type (expressing ligand) and receiving cell type (expressing receptor).
Figure 9
Figure 9
Cell–cell communication networks between cardiac fibroblast and cardiomyocyte subtypes in normal control, nonobstructive HCM, and obstructive HCM conditions. (A) Overall communication networks between normal, nonobstructive, and obstructive HCM cardiomyocytes and fibroblasts. Line color indicates ligand broadcast by the cell population with the same color. Lines connect to cell types which expressed cognate receptors. Line thickness is proportional to the number of uniquely expressed ligand–receptor pairs. Loops indicate communication within a cell type. (B) Quantity of ligands and receptors in expressed ligand–receptor pairs described by cell type and condition (normal, nonobstructive HCM, or obstructive HCM). (C–E) Cell–cell communication networks broken down by cardiomyocyte cluster and fibroblast cluster in normal control (C), nonobstructive HCM (D), and obstructive HCM (E) conditions. Figure formatting follows panel A. Numbers indicate the quantity of uniquely expressed ligand–receptor pairs between the broadcasting cell type (expressing ligand) and receiving cell type (expressing receptor).

References

    1. Maron B.J., Longo D.L. Clinical Course and Management of Hypertrophic Cardiomyopathy. N. Engl. J. Med. 2018;379:655–668. doi: 10.1056/NEJMra1710575. - DOI - PubMed
    1. Thierfelder L., Watkins H., MacRae C., Lamas R., McKenna W., Vosberg H.P., Seidman J.G., Seidman C.E. Alpha-tropomyosin and cardiac troponin T mutations cause familial hypertrophic cardiomyopathy: A disease of the sarcomere. Cell. 1994;77:701–712. doi: 10.1016/0092-8674(94)90054-X. - DOI - PubMed
    1. Maron B.J., Maron M.S., Maron B.A., Loscalzo J. Moving Beyond the Sarcomere to Explain Heterogeneity in Hypertrophic Cardiomyopathy: JACC Review Topic of the Week. J. Am. Coll. Cardiol. 2019;73:1978–1986. doi: 10.1016/j.jacc.2019.01.061. - DOI - PMC - PubMed
    1. Bonaventura J., Polakova E., Vejtasova V., Veselka J. Genetic Testing in Patients with Hypertrophic Cardiomyopathy. Int. J. Mol. Sci. 2021;22:10401. doi: 10.3390/ijms221910401. - DOI - PMC - PubMed
    1. Chou C., Chin M.T. Pathogenic Mechanisms of Hypertrophic Cardiomyopathy beyond Sarcomere Dysfunction. Int. J. Mol. Sci. 2021;22:8933. doi: 10.3390/ijms22168933. - DOI - PMC - PubMed

Publication types