

Associations between the Levels of Estradiol-, Progesterone-, and Testosterone-Sensitive MiRNAs and Main Clinicopathologic Features of Breast Cancer
- PMID: 35055320
- PMCID: PMC8779432
- DOI: 10.3390/jpm12010004
Associations between the Levels of Estradiol-, Progesterone-, and Testosterone-Sensitive MiRNAs and Main Clinicopathologic Features of Breast Cancer
Abstract
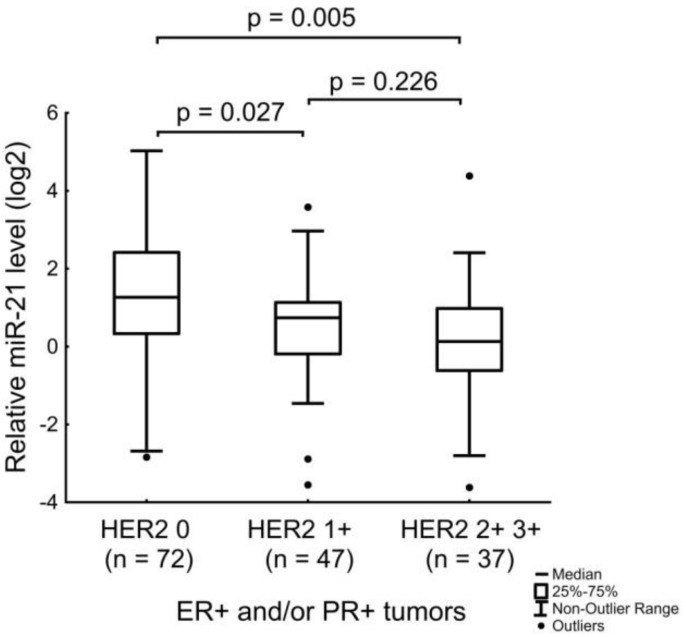
Despite the existing advances in the diagnosis and treatment of breast cancer (BC), the search for markers associated with the clinicopathological features of BC is still in demand. MiRNAs (miRs) have potential as markers, since a change in the miRNA expression profile accompanies the initiation and progression of malignant diseases. The receptors for estrogen, androgen, and progesterone (ER, AR, and PR) play an important role in breast carcinogenesis. Therefore, to search for miRNAs that may function as markers in BC, using bioinformatic analysis and the literature data, we selected 13 miRNAs whose promoter regions contain binding sites for ER or AR, or putative binding sites for ER, AR, and PR. We quantified their expression in MCF-7 cells treated with estradiol, progesterone, or testosterone. The levels of miRNAs sensitive to one or more of these hormones were quantified in BC samples (n = 196). We discovered that high expression levels of miR-190b in breast tumor tissue indicate a positive ER status, and miR-423 and miR-200b levels differ between patients with and without HER2 amplification. The miR-193b, -423, -190a, -324, and -200b levels were associated with tumor size or lymph node status in BC patients, but the presence of these associations depended on the status and expression level of ER, PR, HER2, and Ki-67. We also found that miR-21 expression depends on HER2 expression in ER- and/or PR-positive BC. The levels of miRNA were significantly different between HER2 0 and HER2 1+ tumors (p = 0.027), and between HER2 0 and HER2 2+, 3+ tumors (p = 0.005).
Keywords: biomarker; breast cancer; hormone-dependent carcinogenesis; lymph node metastasis; microRNA.
Conflict of interest statement
The authors declare no conflict of interest.
Figures


Similar articles
-
Expression of Estrogen Receptor- and Progesterone Receptor-Regulating MicroRNAs in Breast Cancer.Genes (Basel). 2021 Apr 16;12(4):582. doi: 10.3390/genes12040582. Genes (Basel). 2021. PMID: 33923732 Free PMC article.
-
microRNA Expression Profile in Single Hormone Receptor-Positive Breast Cancers is Mainly Dependent on HER2 Status-A Pilot Study.Diagnostics (Basel). 2020 Aug 20;10(9):617. doi: 10.3390/diagnostics10090617. Diagnostics (Basel). 2020. PMID: 32825530 Free PMC article.
-
MicroRNA signatures predict oestrogen receptor, progesterone receptor and HER2/neu receptor status in breast cancer.Breast Cancer Res. 2009;11(3):R27. doi: 10.1186/bcr2257. Epub 2009 May 11. Breast Cancer Res. 2009. PMID: 19432961 Free PMC article.
-
Clinicopathological significance and potential drug target of CDH1 in breast cancer: a meta-analysis and literature review.Drug Des Devel Ther. 2015 Sep 18;9:5277-85. doi: 10.2147/DDDT.S86929. eCollection 2015. Drug Des Devel Ther. 2015. PMID: 26425077 Free PMC article. Review.
-
ER Negative Breast Cancer and miRNA: There Is More to Decipher Than What the Pathologist Can See!Biomedicines. 2023 Aug 18;11(8):2300. doi: 10.3390/biomedicines11082300. Biomedicines. 2023. PMID: 37626796 Free PMC article. Review.
Cited by
-
Exosomes in Breast Cancer: Involvement in Tumor Dissemination and Prospects for Liquid Biopsy.Int J Mol Sci. 2022 Aug 9;23(16):8845. doi: 10.3390/ijms23168845. Int J Mol Sci. 2022. PMID: 36012109 Free PMC article. Review.
-
Size and Methylation Index of Cell-Free and Cell-Surface-Bound DNA in Blood of Breast Cancer Patients in the Contest of Liquid Biopsy.Int J Mol Sci. 2022 Aug 10;23(16):8919. doi: 10.3390/ijms23168919. Int J Mol Sci. 2022. PMID: 36012175 Free PMC article.
-
MDMF: Predicting miRNA-Disease Association Based on Matrix Factorization with Disease Similarity Constraint.J Pers Med. 2022 May 27;12(6):885. doi: 10.3390/jpm12060885. J Pers Med. 2022. PMID: 35743670 Free PMC article.
-
MIMR: Development of a Web-Based System for miRNA and mRNA Integrated Analysis.Int J Mol Sci. 2024 Nov 4;25(21):11819. doi: 10.3390/ijms252111819. Int J Mol Sci. 2024. PMID: 39519370 Free PMC article.
-
A review on the role of miRNA-324 in various diseases.Front Genet. 2022 Aug 10;13:950162. doi: 10.3389/fgene.2022.950162. eCollection 2022. Front Genet. 2022. PMID: 36035118 Free PMC article. Review.
References
-
- Li J., Downs B.M., Cope L.M., Fackler M.J., Zhang X., Song C.G., VandenBussche C., Zhang K., Han Y., Liu Y., et al. Automated and rapid detection of cancer in suspicious axillary lymph nodes in patients with breast cancer. NPJ Breast Cancer. 2021;7:89. doi: 10.1038/s41523-021-00298-6. - DOI - PMC - PubMed
Grants and funding
LinkOut - more resources
Full Text Sources
Research Materials
Miscellaneous
