. 2022 Jan 6;15(1):72.
doi: 10.3390/ph15010072.

Persimmon Leaves (Diospyros kaki) Extract Enhances the Viability of Human Corneal Endothelial Cells by Improving Na+-K+-ATPase Activity

Affiliations

Persimmon Leaves (Diospyros kaki) Extract Enhances the Viability of Human Corneal Endothelial Cells by Improving Na+-K+-ATPase Activity

Ramsha Afzal et al. Pharmaceuticals (Basel). .

Abstract

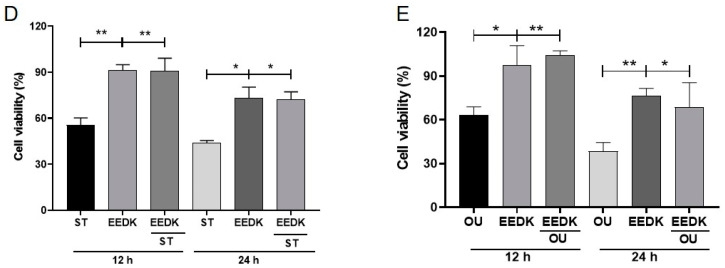
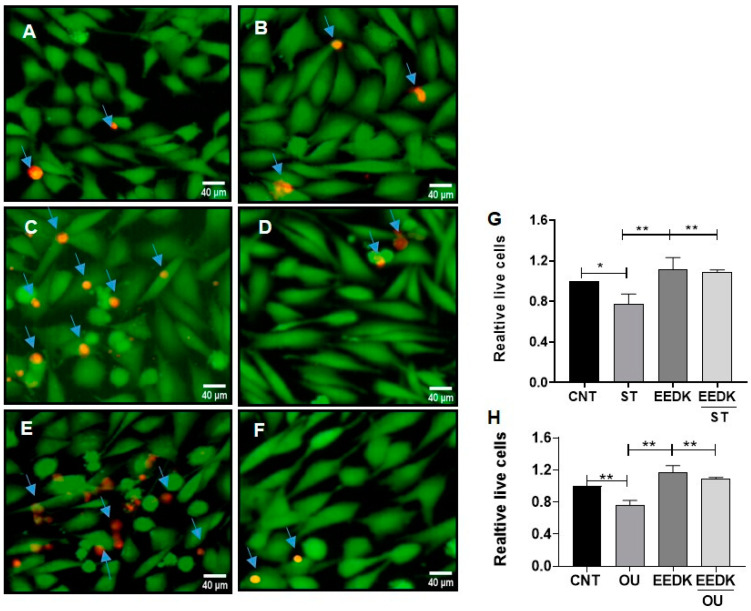
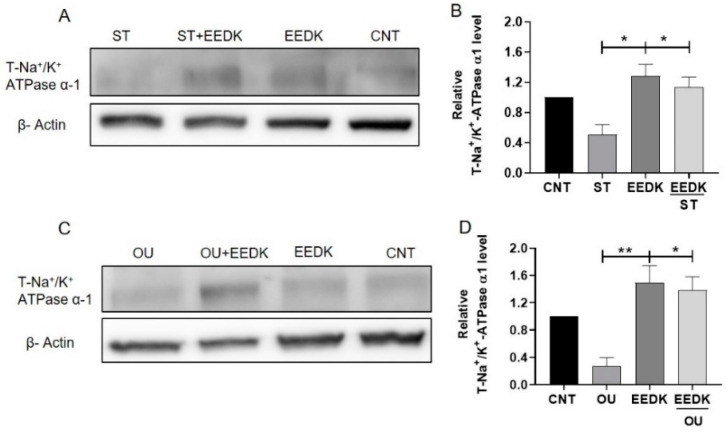
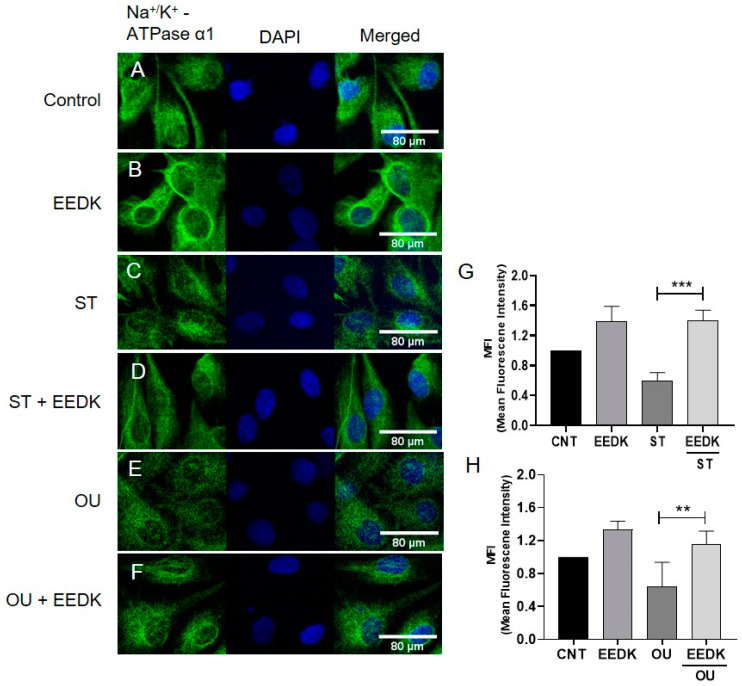
The Na+/K+-ATPase, present in the basolateral membrane of human corneal endothelial cells (HCECs), is known to play an important role for corneal transparency. Na+/K+-ATPase dysfunction is one of the major causes of corneal decompensation. The ethanol extract of Diospyros kaki (EEDK) has been reported to increase corneal cell viability. Thus, we treated HCECs with EEDK and studied its effects on HCECs survival and Na+/K+-ATPase against cytotoxic drugs like staurosporine (ST) and ouabain (OU). Firstly, survival assays, (MTT assay and live dead-imaging) showed that decreased HCECs viability by ST and OU was significantly recovered by EEDK co-treatment. Secondly, Na+/K+-ATPase activity assays revealed that EEDK enhanced Na+/K+-ATPase enzymatic activity (* p < 0.01) with/without ST and OU. Finally, Na+/K+-ATPase expression analysis (Western Blot and confocal microscopy) demonstrated that EEDK treatment with/without ST and OU facilitates Na+/K+-ATPase expression in HCECs. Taken together, our findings led us to the conclusion that EEDK might aid HCECs survival in vitro by increasing the activity and expression of Na+/K+-ATPase enzyme. Since Na+/K+-ATPase activity is important to maintain cellular function of HCECs, we suggest that EEDK can be a potential effective agent against corneal edema and related corneal disorders.

Keywords: Na+/K+-ATPase; cell viability; cornea; enzymatic activity; ethanol extract of Diospyros kaki; human corneal endothelial cells; ouabain; persimmon leaves; staurosporine.


Conflict of interest statement

The authors declare that they have no conflict of interest related to this work.

Figures

Figure 1
Figure 1
Optimization of cytotoxic drugs concentration and viability of HCECs under the influence of ST and OU with or without EEDK. HCECs were exposed to (A) ST and (B) OU, and (C) levels of EEDK were also optimized. EEDK co-treatment with (D) ST and (E) OU. Data are presented as the mean ± standard error mean (SEM) of values from four representative experiments. * p < 0.05, ** p < 0.01, *** p < 0.001, **** p < 0.0001 for the indicated comparisons (one-way ANOVA with Dunnett’s multiple comparison test).
Figure 1
Figure 1
Optimization of cytotoxic drugs concentration and viability of HCECs under the influence of ST and OU with or without EEDK. HCECs were exposed to (A) ST and (B) OU, and (C) levels of EEDK were also optimized. EEDK co-treatment with (D) ST and (E) OU. Data are presented as the mean ± standard error mean (SEM) of values from four representative experiments. * p < 0.05, ** p < 0.01, *** p < 0.001, **** p < 0.0001 for the indicated comparisons (one-way ANOVA with Dunnett’s multiple comparison test).
Figure 2
Figure 2
Live/dead imaging of HCECs exposed to cytotoxic drugs (ST and OU) with or without EEDK co-treatment. (A,B) Representative images of cells exposed to controls (A; no drug treatment, B; EEDK treated cells) respectively. (C,D) Representative images of cells exposed to ST (C) and its co-treatment with EEDK 2 µg/mL (D). (E,F) Representative images of cells exposed to OU (E) and its co-treatment with EEDK 2 µg/mL (F). (G,H) Representative graphs for the ST and OU groups, respectively. Data are presented as the standard error mean ± SEM of values from four representative experiments. * p < 0.05, ** p < 0.01 for the indicated comparisons (one-way ANOVA with Tukey’s multiple comparison test).
Figure 3
Figure 3
Effects of EEDK on Na+/K+-ATPase activity in cultured HCECs. (A) Cells were treated with ST 5 nM and ST+ EEDK 2 µg/mL for 24 h and then assayed for Na+/K+-ATPase activity. (B) Cells were treated with 50 nM of OU with or without 2 µg/mL EEDK. Non-treated cells were used as control in both cases. Data are presented as the standard error mean ± SEM of values from three representative experiments. * p < 0.05 for the indicated comparisons (one-way ANOVA with Tukey’s multiple comparison test).
Figure 4
Figure 4
Protein expression of total-Na+/K+-ATPase α1 subunit by western blot analysis. (A) Representative signals of expression. Top: Na+/K+-ATPase α1-subunit. Bottom: β-Actin, the relative intensity of each band to β-actin was measured by a densitometer as the expression of Na+/K+-ATPase α1-subunit. (B) Representative graph of 4A. Cells were exposed to ST 5 nM and ST with EEDK 2 µg/mL. Only EEDK and non-treated cells were used as controls after 24 h of treatment cells were assayed to analyze the expression level of Na+/K+-ATPase α1. (C) Representative signals of expression. Top: Na+/K+-ATPase α1-subunit. Bottom: β-Actin. (D) Representative graph of 4C. Cells were incubated with OU 50 nM with and without EEDK 2 µg/mL. Non-treated cells and only EEDK treated cells represent controls. Data are presented as the mean ± SEM of values from three experiments, * p < 0.05, ** p < 0.01 for the indicated comparisons (one-way ANOVA with Tukey’s multiple comparison test).
Figure 5
Figure 5
Confocal microscopy for Na+/K+-ATPase α1 cell surface expression in cultured HCECs. HCECs seeded on coverslips and incubated with ST or OU with/without EEDK for 24 h and then stained with Na+/K+-ATPase antibody (green fluorescence, membranous) and DAPI (blue). (A) Un-treated HCECs (CNT), (B) HCECs treated with 2 µg/mL EEDK, (C) cells treated with 5 nM ST, (D) HCECs undergone co-treatment of ST and EEDK, (E) HCECs with 50 nM OU, (F) cells co-treated with OU and EEDK, and (G,H) graphical representation of ST and OU group respectively. Results are expressed as the mean ± SEM of three independent experiments. ** p < 0.01, *** p < 0.001 (one-way ANOVA with Dunnett’s multiple comparison).

References

    1. Schmedt T., Silva M.M., Ziaei A., Jurkunas U. Molecular bases of corneal endothelial dystrophies. Exp. Eye Res. 2012;95:24–34. doi: 10.1016/j.exer.2011.08.002. - DOI - PMC - PubMed
    1. Joyce N.C. Proliferative capacity of corneal endothelial cells. Exp. Eye Res. 2012;95:16–23. doi: 10.1016/j.exer.2011.08.014. - DOI - PMC - PubMed
    1. Edelhauser H.F. The balance between corneal transparency and edema: The Proctor Lecture. Investig. Ophthalmol. Vis. Sci. 2006;47:1754–1767. doi: 10.1167/iovs.05-1139. - DOI - PubMed
    1. Van den Bogerd B., Dhubhghaill S.N., Koppen C., Tassignon M.-J., Zakaria N. A review of the evidence for in vivo corneal endothelial regeneration. Surv. Ophthalmol. 2018;63:149–165. doi: 10.1016/j.survophthal.2017.07.004. - DOI - PubMed
    1. Barry P.A., Petroll W.M., Andrews P.M., Cavanagh H.D., Jester J.V. The spatial organization of corneal endothelial cytoskeletal proteins and their relationship to the apical junctional complex. Investig. Ophthalmol. Vis. Sci. 1995;36:1115–1124. - PubMed

LinkOut - more resources