

Immunogenic Properties of MVs Containing Structural Hantaviral Proteins: An Original Study
- PMID: 35056989
- PMCID: PMC8779827
- DOI: 10.3390/pharmaceutics14010093
Immunogenic Properties of MVs Containing Structural Hantaviral Proteins: An Original Study
Abstract
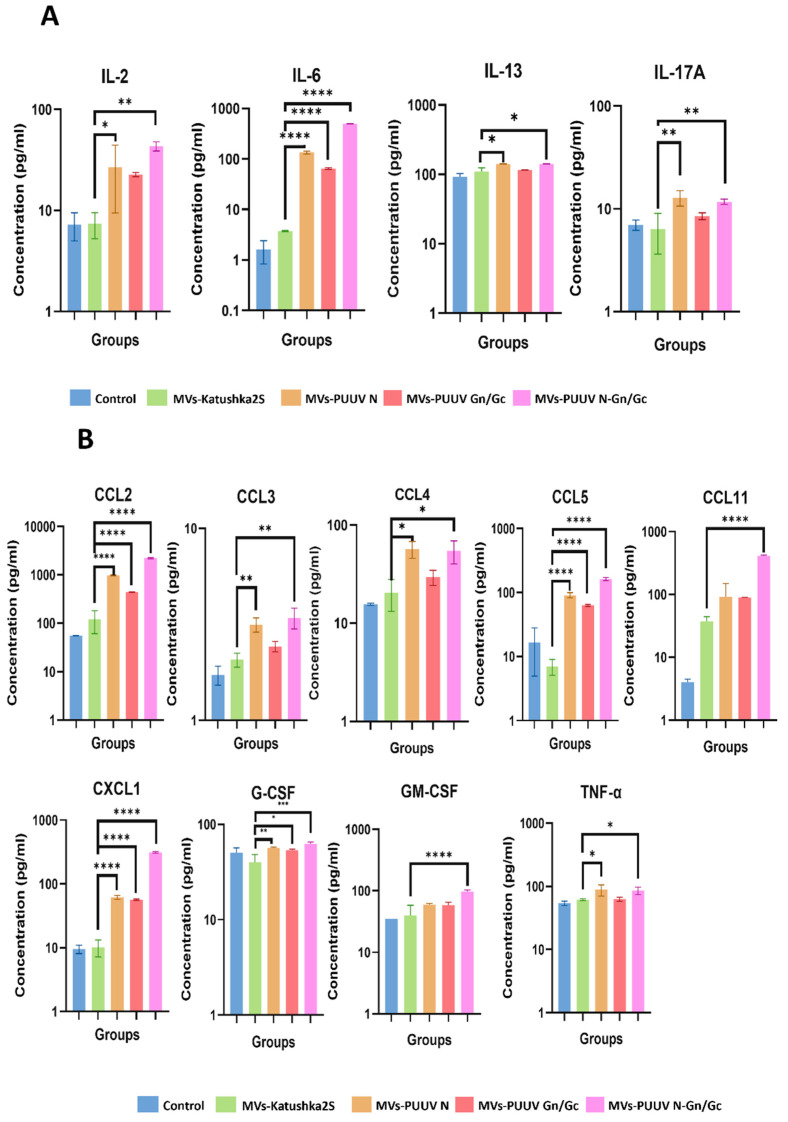
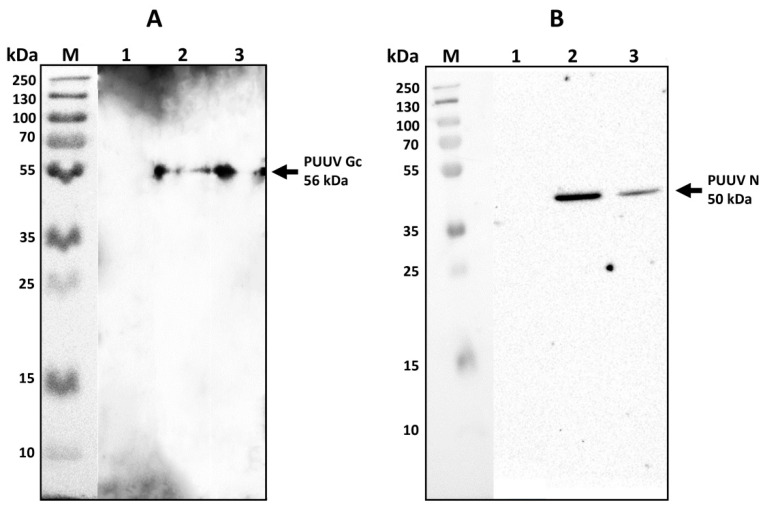
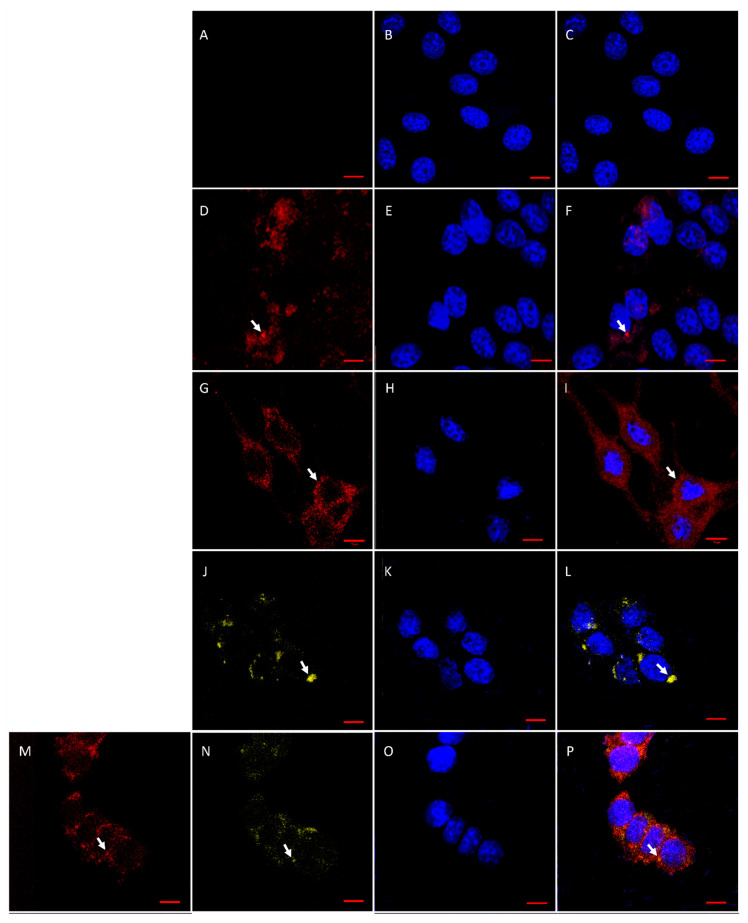
Hemorrhagic fever with renal syndrome (HFRS) is an emerging infectious disease that remains a global public health threat. The highest incidence rate is among zoonotic disease cases in Russia. Most cases of HFRS are reported in the Volga region of Russia, which commonly identifies the Puumala virus (PUUV) as a pathogen. HFRS management is especially challenging due to the lack of specific treatments and vaccines. This study aims to develop new approaches for HFRS prevention. Our goal is to test the efficacy of microvesicles (MVs) as PUUV nucleocapsid (N) and glycoproteins (Gn/Gc) delivery vehicles. Our findings show that MVs could deliver the PUUV N and Gn/Gc proteins in vitro. We have also demonstrated that MVs loaded with PUUV proteins could elicit a specific humoral and cellular immune response in vivo. These data suggest that an MV-based vaccine could control HFRS.
Keywords: delivery system; hemorrhagic fever with renal syndrome; microvesicles; orthohantavirus; vaccine.
Conflict of interest statement
The authors declare no conflict of interest.
Figures
Similar articles
-
Characterization of the Puumala orthohantavirus Strains in the Northwestern Region of the Republic of Tatarstan in Relation to the Clinical Manifestations in Hemorrhagic Fever With Renal Syndrome Patients.Front Pharmacol. 2019 Sep 5;10:970. doi: 10.3389/fphar.2019.00970. eCollection 2019. Front Pharmacol. 2019. PMID: 31543819 Free PMC article.
-
A Phase 1 clinical trial of Hantaan virus and Puumala virus M-segment DNA vaccines for haemorrhagic fever with renal syndrome delivered by intramuscular electroporation.Clin Microbiol Infect. 2014 May;20 Suppl 5:110-7. doi: 10.1111/1469-0691.12553. Epub 2014 Mar 7. Clin Microbiol Infect. 2014. PMID: 24447183 Clinical Trial.
-
Prevalence of the Puumala orthohantavirus Strains in the Pre-Kama Area of the Republic of Tatarstan, Russia.Pathogens. 2020 Jul 6;9(7):540. doi: 10.3390/pathogens9070540. Pathogens. 2020. PMID: 32640614 Free PMC article.
-
Analysis of Puumala orthohantavirus Genome Variants Identified in the Territories of Volga Federal District.Trop Med Infect Dis. 2022 Mar 6;7(3):46. doi: 10.3390/tropicalmed7030046. Trop Med Infect Dis. 2022. PMID: 35324593 Free PMC article.
-
Innate and adaptive immune responses against human Puumala virus infection: immunopathogenesis and suggestions for novel treatment strategies for severe hantavirus-associated syndromes.J Intern Med. 2019 May;285(5):510-523. doi: 10.1111/joim.12876. Epub 2019 Feb 17. J Intern Med. 2019. PMID: 30663801 Free PMC article. Review.
Cited by
-
Hemorrhagic Fever with Renal Syndrome in Asia: History, Pathogenesis, Diagnosis, Treatment, and Prevention.Viruses. 2023 Feb 18;15(2):561. doi: 10.3390/v15020561. Viruses. 2023. PMID: 36851775 Free PMC article. Review.
-
Designing a Conserved Immunogenic Peptide Construct from the Nucleocapsid Protein of Puumala orthohantavirus.Viruses. 2024 Jun 26;16(7):1030. doi: 10.3390/v16071030. Viruses. 2024. PMID: 39066193 Free PMC article.
-
Puumala orthohantavirus: prevalence, biology, disease, animal models and recent advances in therapeutics development and structural biology.Front Immunol. 2025 May 8;16:1575112. doi: 10.3389/fimmu.2025.1575112. eCollection 2025. Front Immunol. 2025. PMID: 40406115 Free PMC article. Review.
-
Extracellular vesicle mimetics as delivery vehicles for oligonucleotide-based therapeutics and plasmid DNA.Front Bioeng Biotechnol. 2024 Oct 17;12:1437817. doi: 10.3389/fbioe.2024.1437817. eCollection 2024. Front Bioeng Biotechnol. 2024. PMID: 39493304 Free PMC article.
References
-
- Fulhorst C.F., Koster F.T., Enría D.A., Peters C.J. CHAPTER 71—Hantavirus Infections. In: Guerrant R.L., Walker D.H., Weller P.F., editors. Tropical Infectious Diseases: Principles, Pathogens and Practice. 3rd ed. W.B. Saunders; Edinburgh, UK: 2011. pp. 470–480. - DOI
-
- Tkachenko E.A., Ishmukhametov A.A., Dzagurova T.K., Bernshtein A.D., Morozov V.G., Siniugina A.A., Kurashova S.S., Balkina A.S., Tkachenko P.E., Kruger D.H., et al. Hemorrhagic Fever with Renal Syndrome, Russia. Emerg. Infect. Dis. 2019;25:2325–2328. doi: 10.3201/eid2512.181649. - DOI - PMC - PubMed
-
- Garanina E., Martynova E., Davidyuk Y., Kabwe E., Ivanov K., Titova A., Markelova M., Zhuravleva M., Cherepnev G., Shakirova V.G., et al. Cytokine Storm Combined with Humoral Immune Response Defect in Fatal Hemorrhagic Fever with Renal Syndrome Case, Tatarstan, Russia. Viruses. 2019;11:601. doi: 10.3390/v11070601. - DOI - PMC - PubMed
-
- Khismatullina N.A., Karimov M.M., Khaertynov K.S., Shuralev E.A., Morzunov S.P., Khaertynova I.M., Ivanov A.A., Milova I.V., Khakimzyanova M.B., Sayfullina G., et al. Epidemiological dynamics of nephropathia epidemica in the Republic of Tatarstan, Russia, during the period of 1997–2013. Epidemiol. Infect. 2016;144:618–626. doi: 10.1017/S0950268815001454. - DOI - PubMed
-
- Federal Service for Surveillance on Consumer Rights Protection and Human Welfare On the State of Sanitary and Epidemiological Well-Being of the Population in the Russian Federation in 2020. [(accessed on 12 December 2021)];2021 Available online: https://www.rospotrebnadzor.ru/upload/iblock/5fa/gd-seb_02.06-_s-podpisy....
Grants and funding
LinkOut - more resources
Full Text Sources
Miscellaneous
