

Sediment-associated microbial community profiling: sample pre-processing through sequential membrane filtration for 16S rRNA amplicon sequencing
- PMID: 35057747
- PMCID: PMC8772107
- DOI: 10.1186/s12866-022-02441-0
Sediment-associated microbial community profiling: sample pre-processing through sequential membrane filtration for 16S rRNA amplicon sequencing
Abstract
Background: Sequential membrane filtration as a pre-processing step for capturing sediment-associated microorganisms could provide good quality and integrity DNA that can be preserved and kept at ambient temperatures before community profiling through culture-independent molecular techniques. However, the effects of sample pre-processing via filtration on DNA-based profiling of sediment-associated microbial community diversity and composition are poorly understood. Specifically, the influences of pre-processing on the quality and quantity of extracted DNA, high-throughput DNA sequencing reads, and detected microbial taxa need further evaluation.
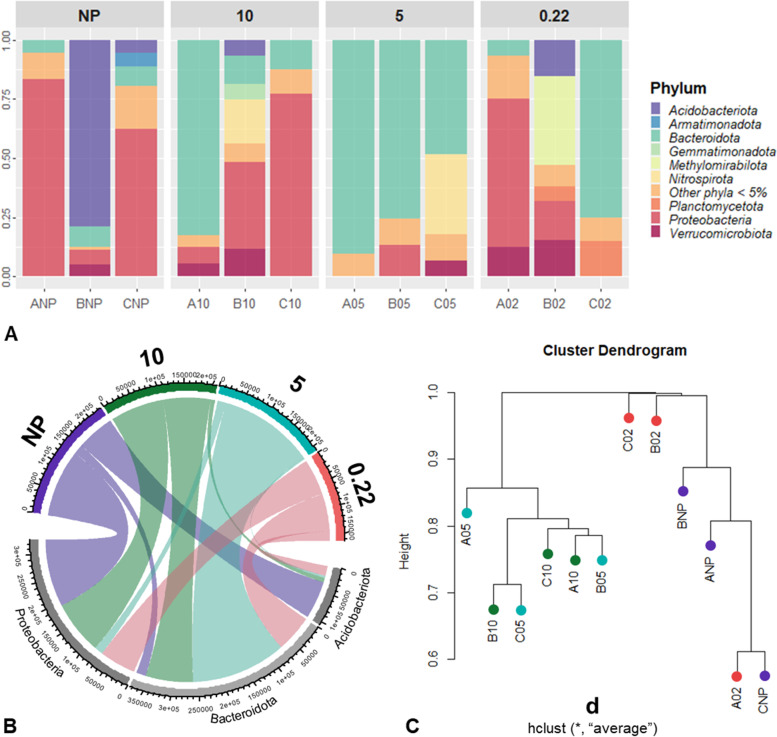
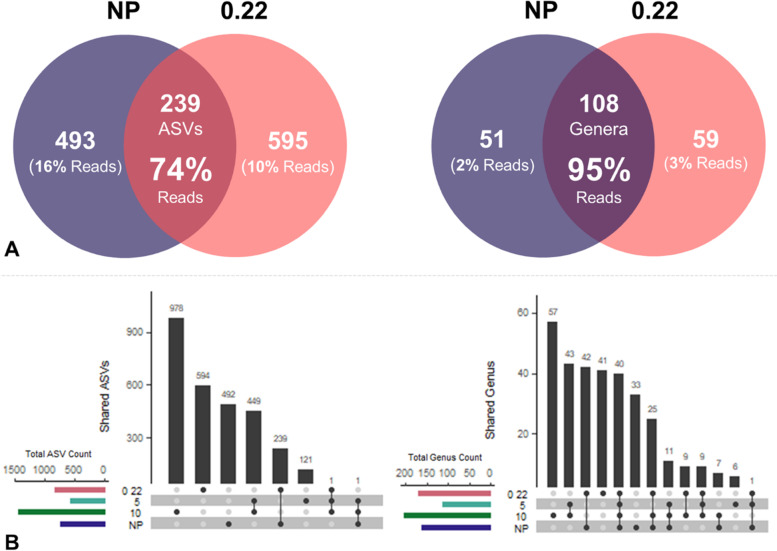
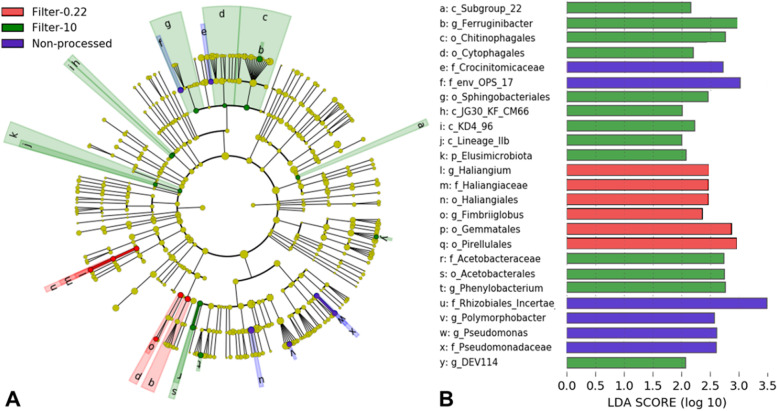
Results: We assessed the impact of pre-processing freshwater sediment samples by sequential membrane filtration (from 10, 5 to 0.22 μm pore size) for 16S rRNA-based community profiling of sediment-associated microorganisms. Specifically, we examined if there would be method-driven differences between non- and pre-processed sediment samples regarding the quality and quantity of extracted DNA, PCR amplicon, resulting high-throughput sequencing reads, microbial diversity, and community composition. We found no significant difference in the qualities and quantities of extracted DNA and PCR amplicons, and the read abundance after bioinformatics processing (i.e., denoising and chimeric-read filtering steps) between the two methods. Although the non- and pre-processed sediment samples had more unique than shared amplicon sequence variants (ASVs), we report that their shared ASVs accounted for 74% of both methods' absolute read abundance. More so, at the genus level, the final collection filter identified most of the genera (95% of the reads) captured from the non-processed samples, with a total of 51 false-negative (2%) and 59 false-positive genera (3%). We demonstrate that while there were differences in shared and unique taxa, both methods revealed comparable microbial diversity and community composition.
Conclusions: Our observations highlight the feasibility of pre-processing sediment samples for community analysis and the need to further assess sampling strategies to help conceptualize appropriate study designs for sediment-associated microbial community profiling.
Keywords: 16S rRNA amplicon sequencing; River sediments; Sediment-associated microbial communities; Sequential membrane filtration.
© 2022. The Author(s).
Conflict of interest statement
The authors declare that they have no competing interests.
Figures

References
-
- Payne RJ. Seven reasons why protists make useful bioindicators. Acta Protozoologica. 2013;52(3):105. 10.4467/16890027AP.13.0011.1108.
-
- Almeida SF, Elias C, Ferreira J, Tornés E, Puccinelli C, Delmas F, Mancini L. Water quality assessment of rivers using diatom metrics across Mediterranean Europe: a methods intercalibration exercise. Sci Total Environ. 2014;476:768–776. - PubMed
-
- Pawlowski J, Lejzerowicz F, Apotheloz-Perret-Gentil L, Visco J, Esling P. Protist metabarcoding and environmental biomonitoring: time for change. Eur J Protistol. 2016;55:12–25. - PubMed
-
- Stern N, Ginder-Vogel M, Stegen JC, Arntzen E, Kennedy DW, Larget BR, Roden EE. Colonization habitat controls biomass, composition, and metabolic activity of attached microbial communities in the Columbia River hyporheic corridor. Applied and environmental microbiology. 2017;83(16):e00260–17. - PMC - PubMed
-
- Liao H, Yu K, Duan Y, Ning Z, Li B, He L, Liu C. Profiling microbial communities in a watershed undergoing intensive anthropogenic activities. Sci Total Environ. 2019;647:1137–1147. - PubMed
Publication types
MeSH terms
Substances
LinkOut - more resources
Full Text Sources
