. 2022 Jan 20;22(1):138.
doi: 10.1186/s12889-021-12275-6.

To isolate or not to isolate: the impact of changing behavior on COVID-19 transmission

Affiliations

To isolate or not to isolate: the impact of changing behavior on COVID-19 transmission

Folashade B Agusto et al. BMC Public Health. .

Erratum in

Abstract

Background: The COVID-19 pandemic has caused more than 25 million cases and 800 thousand deaths worldwide to date. In early days of the pandemic, neither vaccines nor therapeutic drugs were available for this novel coronavirus. All measures to prevent the spread of COVID-19 are thus based on reducing contact between infected and susceptible individuals. Most of these measures such as quarantine and self-isolation require voluntary compliance by the population. However, humans may act in their (perceived) self-interest only.

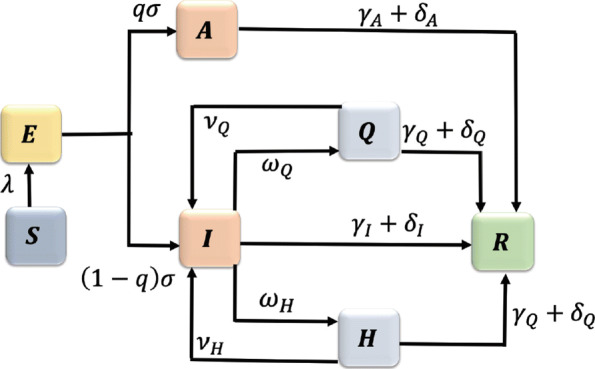
Methods: We construct a mathematical model of COVID-19 transmission with quarantine and hospitalization coupled with a dynamic game model of adaptive human behavior. Susceptible and infected individuals adopt various behavioral strategies based on perceived prevalence and burden of the disease and sensitivity to isolation measures, and they evolve their strategies using a social learning algorithm (imitation dynamics).

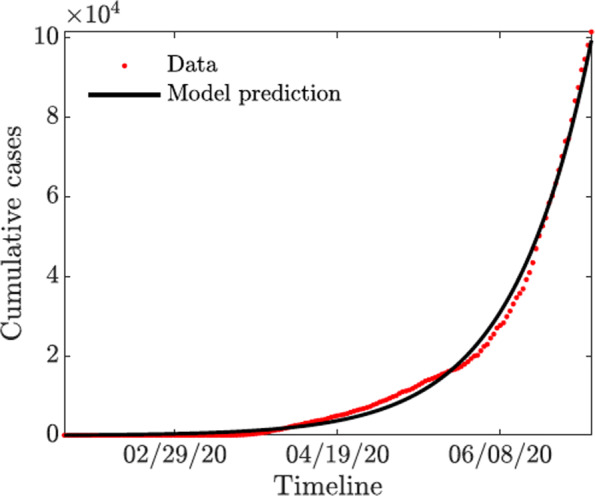
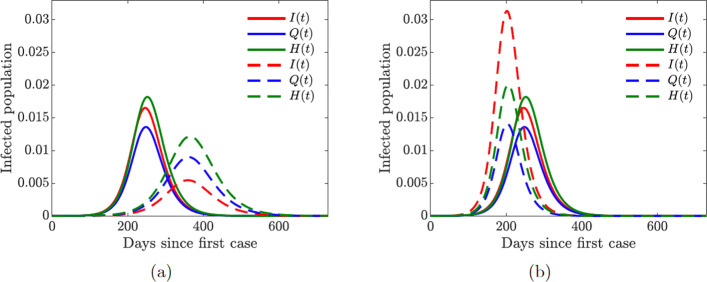
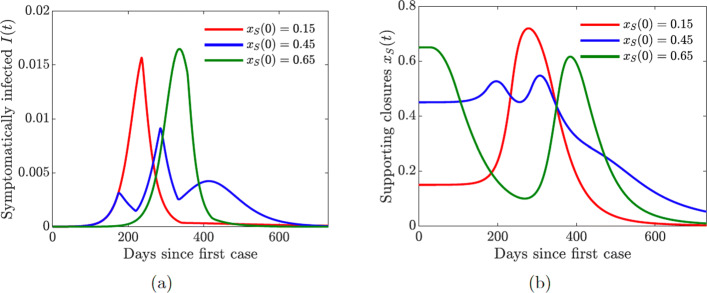
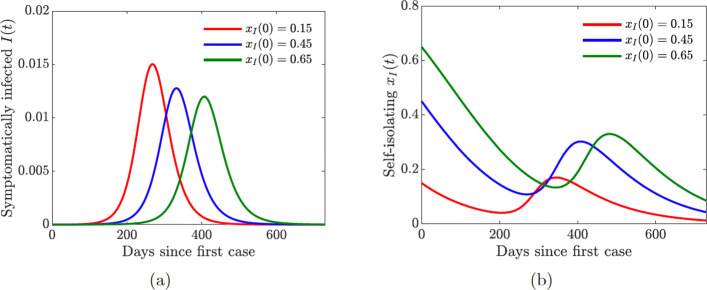
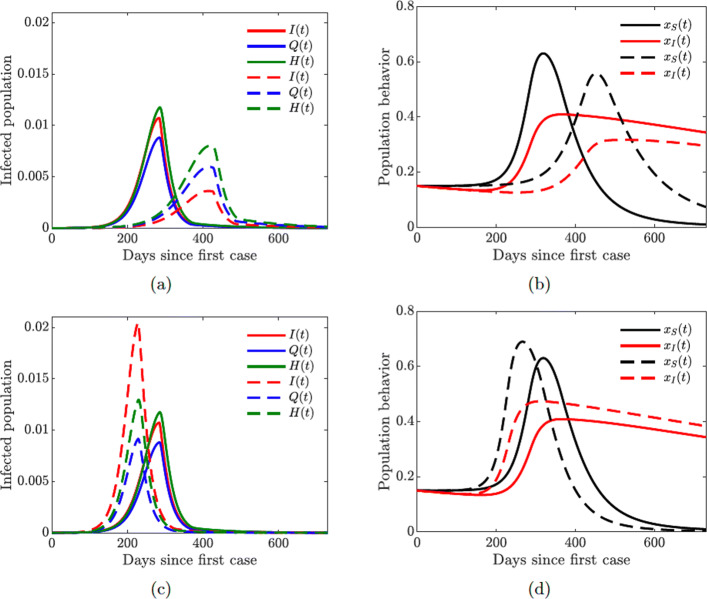
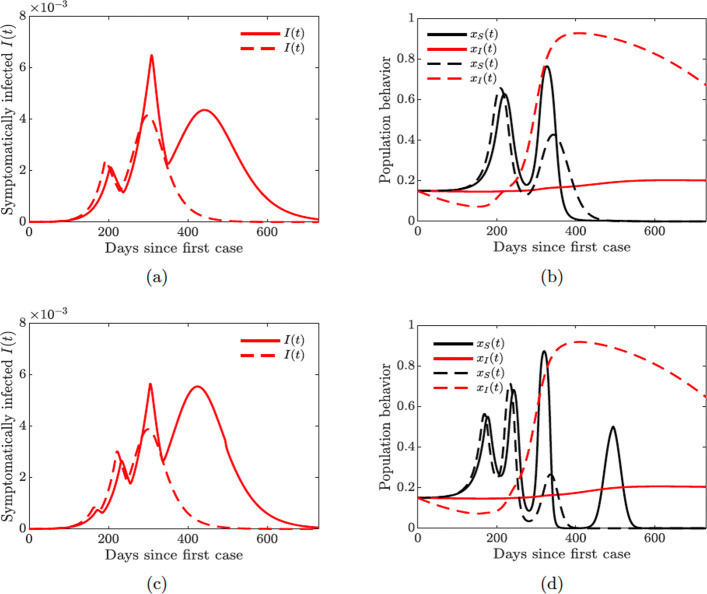
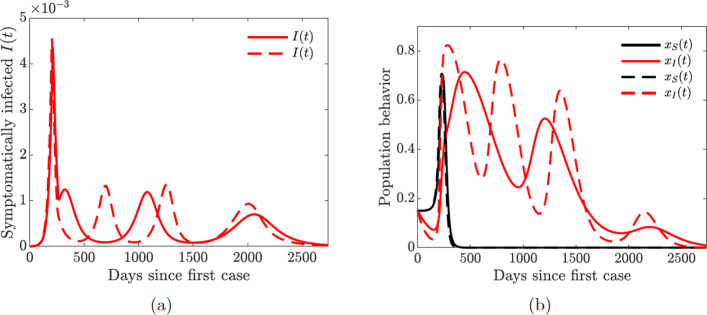
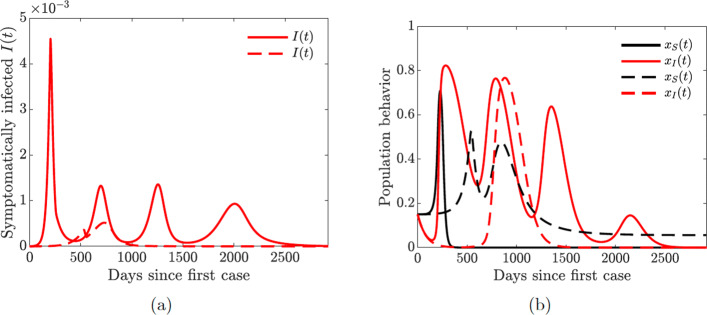
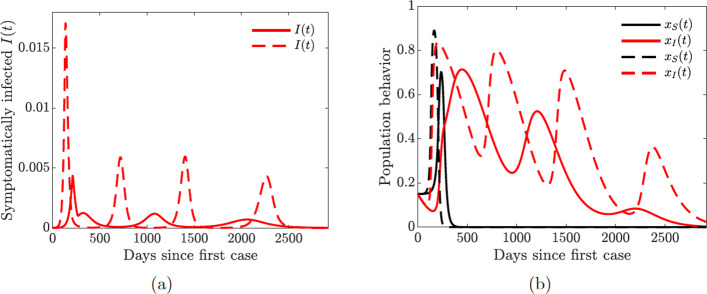
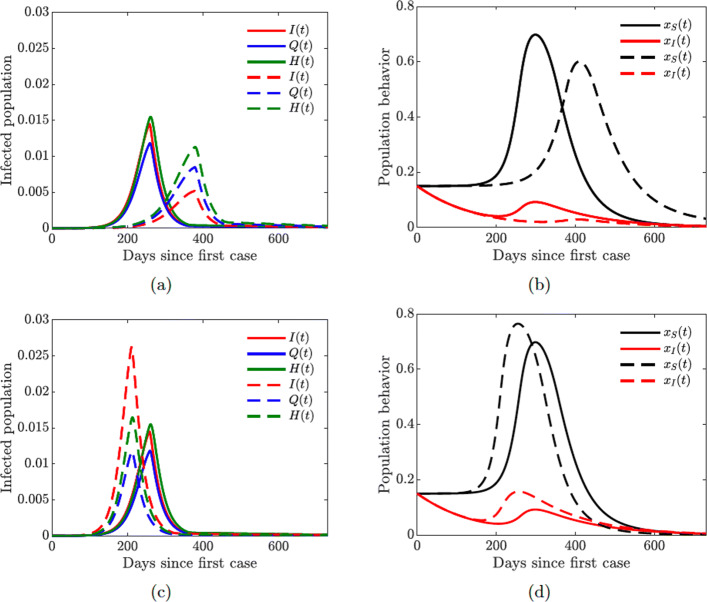
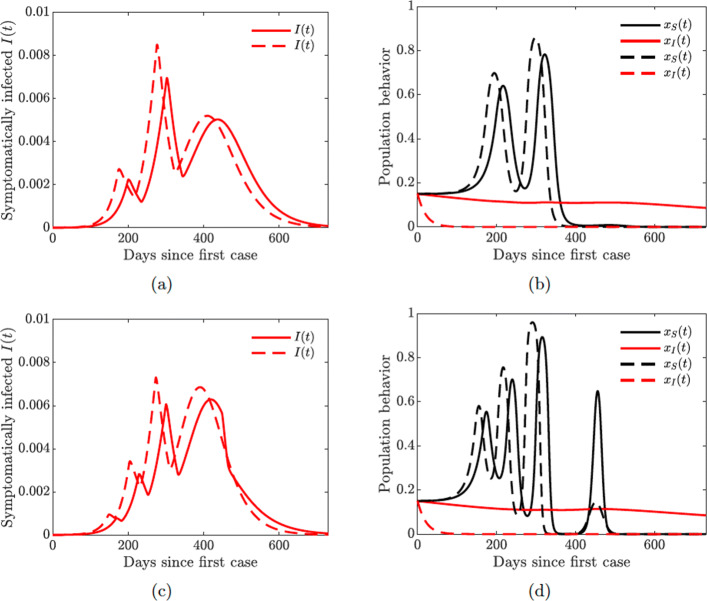
Results: This results in complex interplay between the epidemiological model, which affects success of different strategies, and the game-theoretic behavioral model, which in turn affects the spread of the disease. We found that the second wave of the pandemic, which has been observed in the US, can be attributed to rational behavior of susceptible individuals, and that multiple waves of the pandemic are possible if the rate of social learning of infected individuals is sufficiently high.

Conclusions: To reduce the burden of the disease on the society, it is necessary to incentivize such altruistic behavior by infected individuals as voluntary self-isolation.

Keywords: COVID-19; Game theory; Human behavior; Imitation dynamics; Isolation and quarantine; Perception of risk.


Conflict of interest statement

The authors declare that they have no competing interests.

Figures

Fig. 1
Fig. 1
Flow diagram of the COVID-19 model (6)
Fig. 2
Fig. 2
Fitting the baseline COVID-19 model parameters (6) to Arizona data of reported cumulative new cases. The COVID-19 outbreaks data are obtained from Johns Hopkins website [1]
Fig. 3
Fig. 3
Contour plot of the COVID-19 reproduction number R0 given in Eq. 2. a Varying quarantine rate ωQ and hospitalization rate ωH. b Varying quarantine rate ωQ and infection rate β
Fig. 4
Fig. 4
Contour plot of the COVID-19 reproduction number R0 given in Eq. (2). a Varying quarantine violation rate νQ and hospital discharge rate νH. b Varying infection rate β and quarantine violation rate νQ
Fig. 5
Fig. 5
Simulation of the baseline COVID-19 model (6) for the proportions of symptomatically infected (I), quarantined (Q), and hospitalized (H) individuals. Solid lines correspond to base values of the model parameters from Table 2. a Dashed lines correspond to double quarantine (ωQ=2×0.5326) and hospitalization (ωH=2×0.7495) rates b Dashed lines correspond to double quarantine violation (νQ=2×0.4586) and hospital discharge (νH=2×0.0126) rates
Fig. 6
Fig. 6
Simulations of the COVID-19 model with dynamic human behavior (16) with various initial proportions xS(0) of the susceptibles in support of lock-down. The social learning rate of susceptible individuals is κS=1. a The progression of the proportion of symptomatically infected individuals I(t). b The progression of the proportion of the susceptible population in support of the closure or lock-down measures. The measures are enacted as long as ttclose and xS(t)≥0.5
Fig. 7
Fig. 7
Simulations of the COVID-19 model with dynamic human behavior (16) with various initial proportions xI(0) of symptomatically infected individuals willing to self-isolate. The social learning rate of infected individuals is κI=100, and the sensitivity to self-isolation is εI=0.00008. a The progression of the proportion of symptomatically infected individuals I(t). b The progression of the proportion of symptomatically infected population willing to self-isolate
Fig. 8
Fig. 8
Simulations of the COVID-19 model with dynamic human behavior (16) for the proportions of all symptomatic infections and behavioral response with low sensitivity to self-isolation εI=0.00001. The social learning rates are κS=1 and κI=100, and xS(0)=xI(0)=0.15. Solid lines correspond to the values of the baseline model parameters given in Table 2. ab Dashed lines correspond to double quarantine (ωQ) and hospitalization (ωH) rates cd Dashed lines correspond to double quarantine violation (νQ) and hospital discharge (νH) rates
Fig. 9
Fig. 9
Simulations of the COVID-19 model with dynamic human behavior (16) showing multiple waves of epidemic while varying susceptible (κS) and symptomatic (κI) individual social learning rates with low sensitivity to self-isolation εI=0.00001. Solid lines correspond to κI=20, dashed lines correspond to κI=650. a Proportion of symptomatic infections I(t) with one big and two smaller waves (solid lines), κS=10. b Proportion of susceptible (xS) and symptomatic (xI) individuals adopting positive behavior, κS=10. c Proportion of symptomatic infections I(t) with two big and one small wave (solid lines), κS=30. d Proportion of susceptible (xS) and symptomatic (xI) individuals adopting positive behavior, κS=30
Fig. 10
Fig. 10
Simulations of the COVID-19 model with dynamic human behavior (16) showing epidemic oscillations with high self-isolation social learning rate. Solid lines correspond to κI=650, dashed lines correspond to κI=1350; fixed values κS=5 and εI=0.00001. a Oscillating proportion of symptomatic infections I(t). b Proportion of susceptible (xS) and symptomatic (xI) individuals adopting positive behavior
Fig. 11
Fig. 11
Simulations of the COVID-19 model with dynamic human behavior (16) showing the damping effect of increased quarantine (ωQ) and hospitalization (ωH) rates. Solid lines correspond to base values of ωQ and ωH, dashed lines correspond to a 5-fold increase in these values; fixed values κS=5, κI=1350, and εI=0.00001. a Proportion of symptomatic infections I(t). b Proportion of susceptible (xS) and symptomatic (xI) individuals adopting positive behavior
Fig. 12
Fig. 12
Simulations of the COVID-19 model with dynamic human behavior (16) showing the devastating effect of increased quarantine violation (νQ) and hospital discharge (νH) rates. Solid lines correspond to base values of νQ and νH, dashed lines correspond to an 8-fold increase in these values; fixed values κS=5, κI=650, and εI=0.00001. a Proportion of symptomatic infections I(t). b Proportion of susceptible (xS) and symptomatic (xI) individuals adopting positive behavior
Fig. 13
Fig. 13
Contour plot of the COVID-19 reproduction number R0 given in Eq. (2). a Varying hospitalization rate ωH and infection rate β. b Varying quarantine rate ωQ and hospitalization rate ωH using infection rate β=0.22
Fig. 14
Fig. 14
Contour plot of the COVID-19 reproduction number R0 given in Eq. (2). a Varying quarantine violation rate νQ and infection rate β. b Varying quarantine violation rate νQ and hospital discharge rate νH using infection rate β=0.22
Fig. 15
Fig. 15
Simulations of the COVID-19 model with dynamic human behavior (16) for the proportions of all symptomatic infections and behavioral response with high sensitivity to self-isolation εI=0.00008. The social learning rates are κS=1 and κI=100, and xS(0)=xI(0)=0.15. Solid lines correspond to the values of the baseline model parameters given in Table 2. ab Dashed lines correspond to double quarantine (ωQ) and hospitalization (ωH) rates cd Dashed lines correspond to double quarantine violation (νQ) and hospital discharge (νH) rates
Fig. 16
Fig. 16
Simulations of the COVID-19 model with dynamic human behavior (16) for the proportions of all symptomatic infections and behavioral response with high sensitivity to self-isolation εI=0.00008. Solid lines correspond to κI=20, dashed lines correspond to κI=650. ab κS=10; cd κS=30

References

    1. Johns Hopkins University: COVID-19 data repository by the center for systems science and engineering (csse)2020. https://github.com/CSSEGISandData/COVID-19. Accessed 19 July 2020.
    1. Borak J: Airborne transmission of COVID-19. Occup Med. 2020:297–99. - PMC - PubMed
    1. Centers for Disease Prevention and Control (CDC): Guidance for cleaning and disinfecting public spaces, workplaces, businesses, schools, and homes2020. https://www.cdc.gov/coronavirus/2019-ncov/community/cleaning-disinfectin.... Accessed 30 Aug 2020.
    1. Centers for Disease Prevention and Control (CDC): Interim clinical guidance for management of patients with confirmed coronavirus disease (covid-19)2020. https://www.cdc.gov/coronavirus/2019-ncov/hcp/clinical-guidance-manageme.... Accessed 19 July 2020.
    1. Centers for Disease Prevention and Control (CDC): Symptoms of coronavirus2020. https://www.cdc.gov/coronavirus/2019-ncov/symptoms-testing/symptoms.html. Accessed 19 July 2020.

Publication types