. 2022 Jan 20;19(1):7.
doi: 10.1186/s12989-022-00449-y.

Coal dust exposure triggers heterogeneity of transcriptional profiles in mouse pneumoconiosis and Vitamin D remedies

Affiliations

Coal dust exposure triggers heterogeneity of transcriptional profiles in mouse pneumoconiosis and Vitamin D remedies

Min Mu et al. Part Fibre Toxicol. .

Abstract

Background: Coal dust particles (CDP), an inevitable by-product of coal mining for the environment, mainly causes coal workers' pneumoconiosis (CWP). Long-term exposure to coal dust leads to a complex alternation of biological processes during regeneration and repair in the healing lung. However, the cellular and complete molecular changes associated with pulmonary homeostasis caused by respiratory coal dust particles remain unclear.

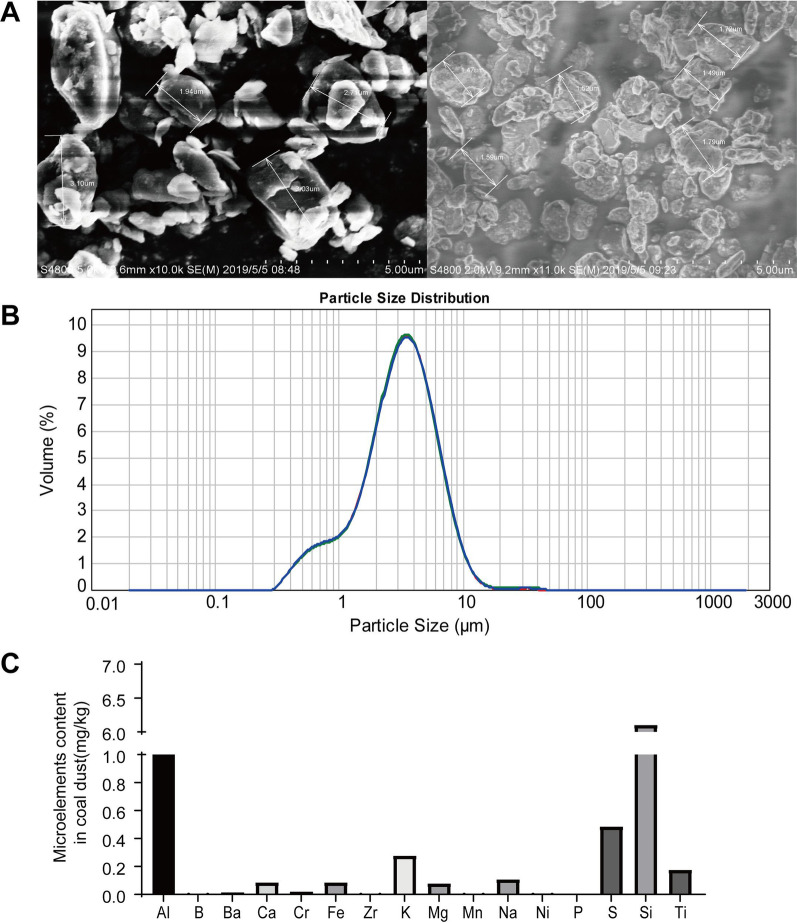
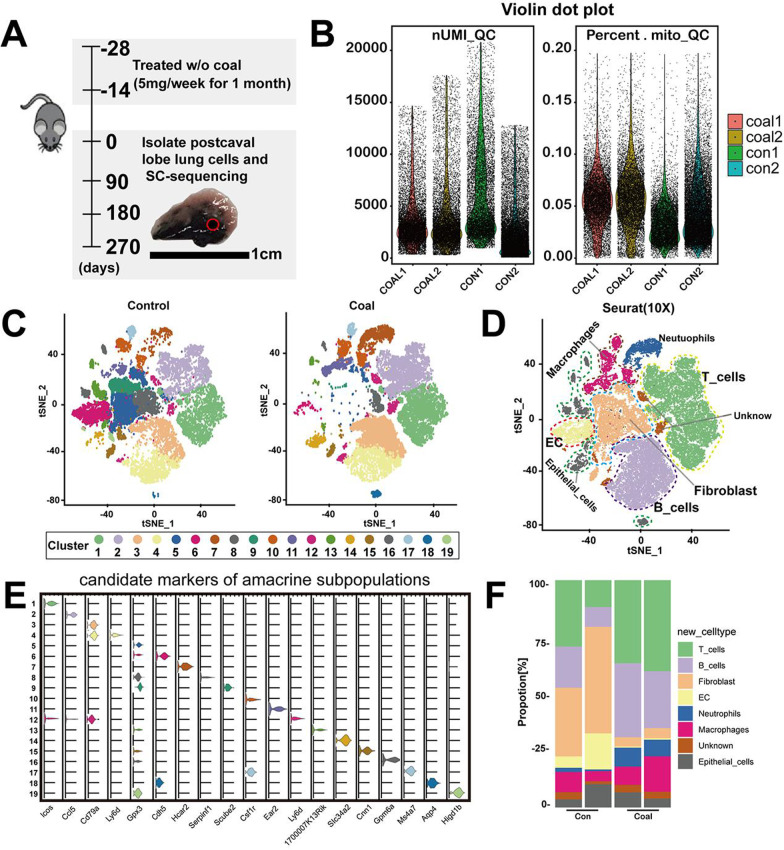
Methods: This study mainly investigated the pulmonary toxicity of respirable-sized CDP in mice using unbiased single-cell RNA sequencing. CDP (< 5 μm) collected from the coal mine was analyzed by Scanning Electron Microscope (SEM) and Mass Spectrometer. In addition, western blotting, Elisa, QPCR was used to detect gene expression at mRNA or protein levels. Pathological analysis including HE staining, Masson staining, immunohistochemistry, and immunofluorescence staining were performed to characterize the structure and functional alternation in the pneumoconiosis mouse and verify the reliability of single-cell sequencing results.

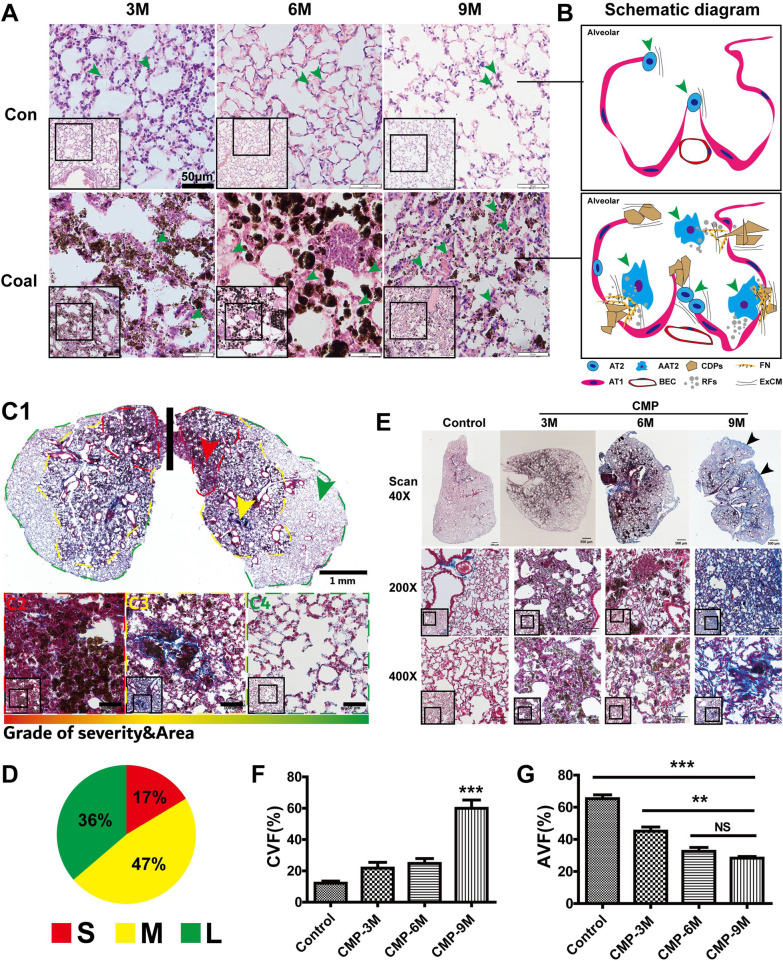
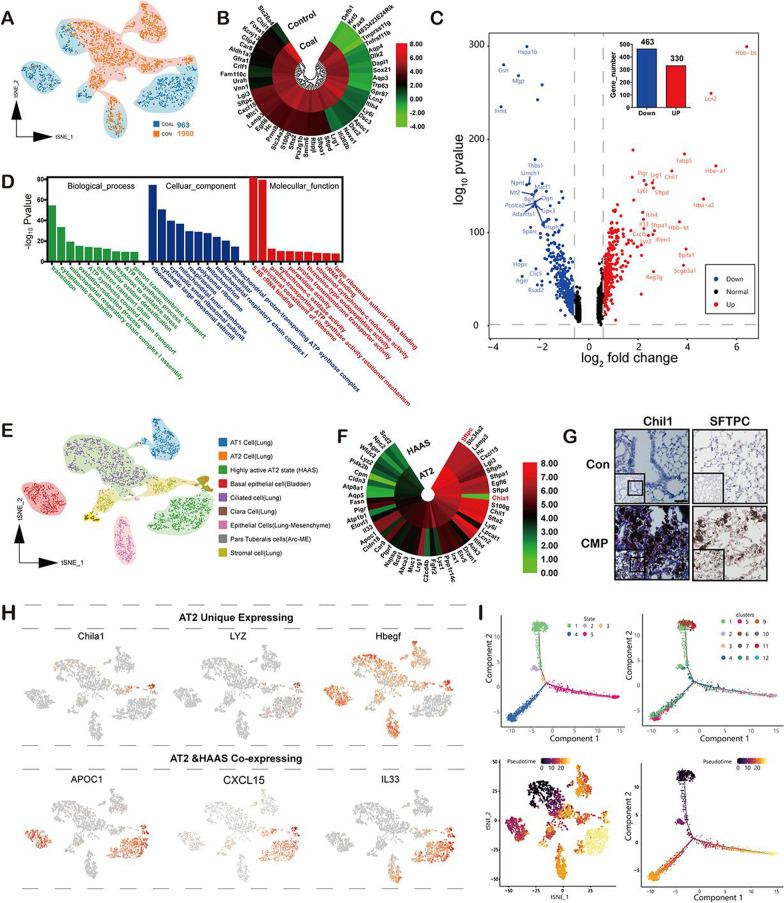
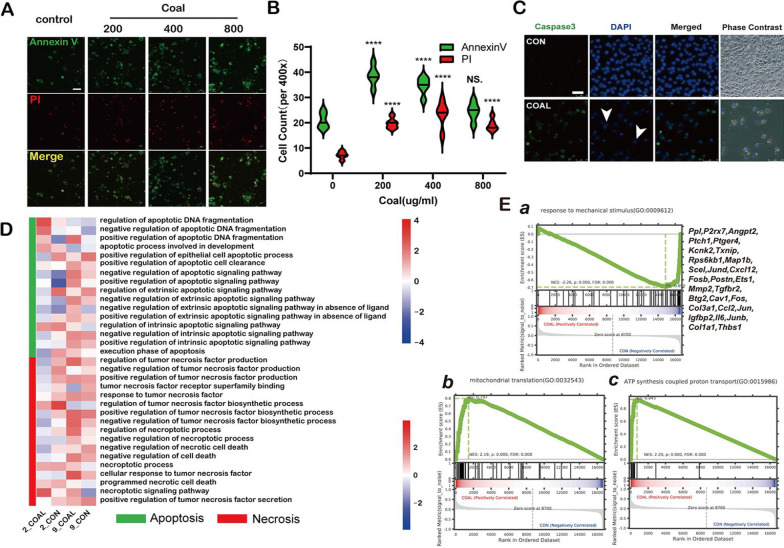
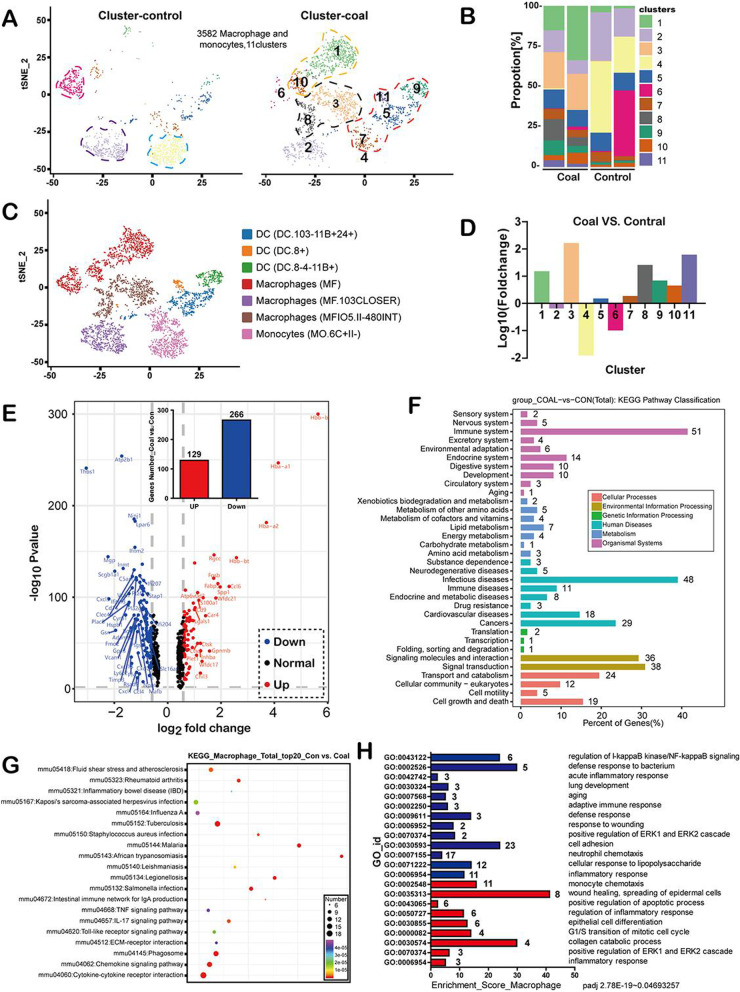
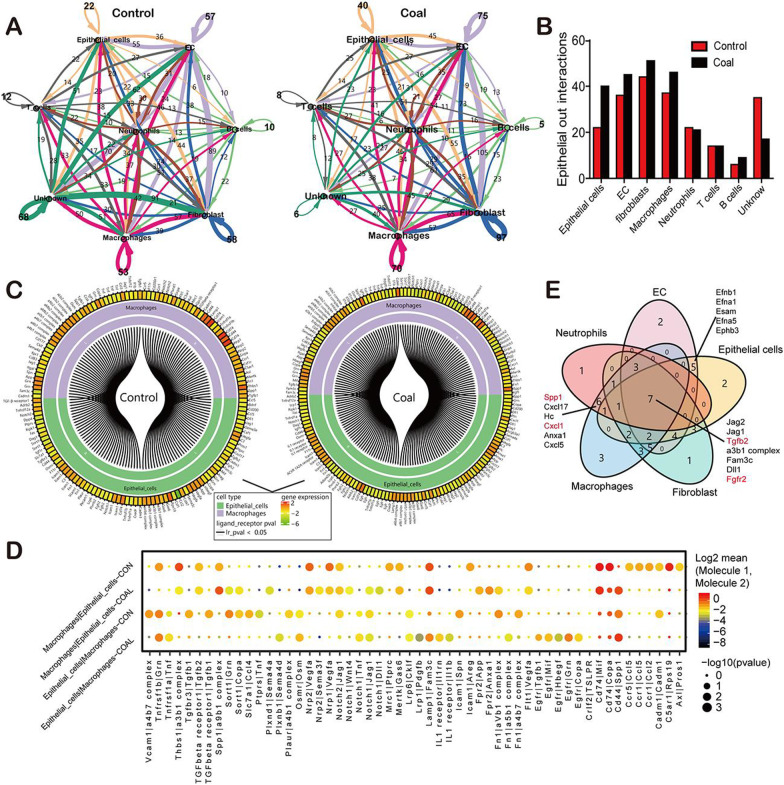
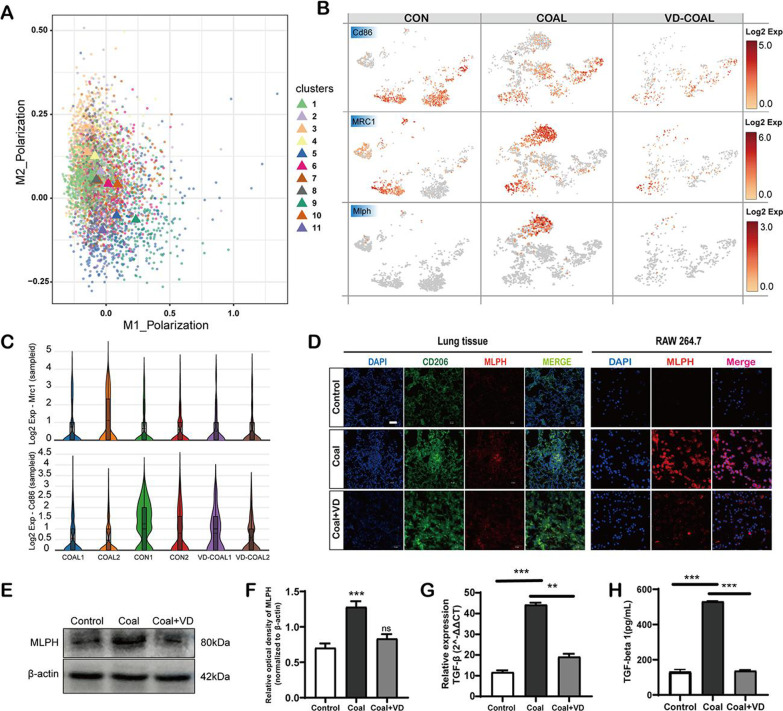
Results: SEM image and Mass Spectrometer analysis showed that coal dust particles generated during coal mine production have been crushed and screened with a diameter of less than 5 µm and contained less than 10% silica. Alveolar structure and pulmonary microenvironment were destroyed, inflammatory and death (apoptosis, autophagy, and necrosis) pathways were activated, leading to pneumoconiosis in post 9 months coal dust stimulation. A distinct abnormally increased alveolar type 2 epithelial cell (AT2) were classified with a highly active state but reduced the antimicrobial-related protein expression of LYZ and Chia1 after CDP exposure. Beclin1, LC3B, LAMP2, TGF-ß, and MLPH were up-regulated induced by CDP, promoting autophagy and pulmonary fibrosis. A new subset of macrophages with M2-type polarization double expressed MLPH + /CD206 + was found in mice having pneumoconiosis but markedly decreased after the Vitamin D treatment. Activated MLPH + /CD206 + M2 macrophages secreted TGF-β1 and are sensitive to Vitamin D treatment.

Conclusions: This is the first study to reconstruct the pathologic progression and transcriptome pattern of coal pneumoconiosis in mice. Coal dust had obvious toxic effects on lung epithelial cells and macrophages and eventually induced pulmonary fibrosis. CDP-induced M2-type macrophages could be inhibited by VD, which may be related to the alleviation of the pulmonary fibrosis process.

Keywords: Alveolar regeneration; Coal dust pulmonary disease; Epithelial cells; Macrophage subset phenotype activation; Pulmonary toxicity; Single-cell RNA sequencing.


Conflict of interest statement

The authors declare that they have no competing interests.

Figures

Fig. 1
Fig. 1
The chemical composition and particle size of coal dust are involved in this experiment. A The image of coal dust particles under scanning electron microscopy. All the particles are symmetrical, and the particle size distribution is narrow and has low silica content. B The distribution of coal dust particles is shown in the graph. C The chemical composition of coal dust particles was analyzed and presented in the table
Fig. 2
Fig. 2
Dispersion of the inhaled coal dust into murine lungs and induction of lung fibrosis progression. The coal dust suspension was instilled via the nose, b.i.w., to accumulate 20 mg coal dust weight. Mice were examined at 3th, 6th and 9th months post-exposure. A Representative histological images (H&E) show the progress of pneumoconiosis tissue injury at 3, 6, and 9 months post-exposure. Green arrowheads pointed to the AT2. B Schematic diagram depicting lung injury and repair during coal pneumoconiosis at 9 months post-exposure (AT1: alveolar epithelial cell type 1, AT2: alveolar epithelial cell type 2, AAT2: Activated alveolar epithelial cell type 2, CDPs: coal dust particles, FN: fibronectin, RFs: repair related factor, BEC: blood endothelial cells, ExCM: extracellular matrix). C1C4 A representative sample of lung tissue showing a central-to-peripheral decline of lung interstitial cell density at 6 months, graded as severe (S), moderate (M), or light (L). D The lung section is divided into three regions, based on the density gradient of interstitial cells, representing severe, moderate, and mild damage. The proportion of the area of different lung interstitial cell density grades at the 6th month. E Representative histological images (Masson trichrome) showing pulmonary fibrosis progression in mice lungs at 3, 6, and 9 months after coal dust exposure (black arrows pointed to peripheral fibroblasts), 40× and 100× magnifications. F Collagenous volume fraction (CVF) at 3, 6, and 9 months, the area of collagen staining in lung tissue. G Alveolar volume fraction (AVF) at 3, 6, and 9 months, the area of the alveolar air cavity gradually shrinks. Both AVF and CVF were measured by free software Image J (NIH, http://rsbweb.nih.gov/ij/). The 40×, 200×, 400 × visual field were used and Semi-quantification under 200x (*p < 0.05, **p < 0.01, ***p < 0.001)
Fig. 3
Fig. 3
Single-cell landscape in murine lungs exposed to coal dust. A Schematic of the experimental workflow used to define the pulmonary cells of 9-month-exposed mice. B Quality control of unique cell molecular identifiers (UMI) and mitochondria. C, D tSNE plot and clustering of 42,252 cells from coal-exposed mice (n = 2) and vehicle control mice (n = 2), classified into 19 clusters and seven distinct cellular types. E Violin plot showed the feature of vital lineage-associated in the mouse lung clusters. F Average proportion of eight main types of lung cells in coal dust-exposed lungs and control lungs
Fig. 4
Fig. 4
Longitudinal single-cell RNA-seq reveals the heterogeneity of epithelial subtypes and alveolar epithelial regeneration after long-term exposure to coal dust. A The tSNE plot shows the changes in the distribution of the subtypes of epithelial cells 9 months after coal dust-mediated lung injury. B Differentially expressed genes (DEGs) from scRNA-seq were identified, and the top 50 DEGs are shown. C Volcano plots highlight differentially expressed genes in the coal dust-exposed and control pulmonary cells. Red dots indicate gene expression upregulation in coal dust-exposed mice, while blue dots indicate downregulation after coal exposure. Labels were added to DWFb1, Krt5, and the top 20 most DEGs. D Gene ontology (GO) classification provides putative gene functions for pulmonary cells in coal-exposed mice. E Single-cell annotation and unsupervised migration clustering identified nine subtypes of epithelial cells. F Based on the lung epithelial cell analysis, the annular heat map shows the significant DEGs out of the top 50 DEGs. The single-cell sequencing data revealed that these top 50 genes were differentially expressed in alveolar dual potent progenitor cells and type 2 alveolar epithelial cells. G CHIL1 and SFTPC overexpression in-coal exposed lungs were identified by immunohistochemical staining that compared the coal-exposed lung tissues to the control lungs. H The proliferating epithelial subsets expressed APOC1, CXCL15, and IL33, covering the primary epithelial cells with CHILA1, LYZ, and HBEGF. Cell markers were used to identify clusters as represented in the tSNE plot. I Using pseudotime ordering analysis, we successfully constructed the pulmonary epithelial cell lineage as a differentiation trajectory. Each branch shows a single-cell state. The top left plot is marked with developmental time, and the right plot is marked with cell states
Fig. 5
Fig. 5
Coal dust exposure-induced pulmonary apoptosis and necrosis. A The MLE-12 cells, a commonly used murine cell line expressing some type II alveolar epithelial cell markers, were either treated or not with coal dust (0 μg/mL, 200 μg/mL, 400 μg/mL, and 800 μg/mL) for 24 h. Microscopic fluorescent images were used to detect cell apoptosis or necrosis after annexin V/PI staining. Cells with the dual stain of annexin V/PI appear bright green in early apoptosis and red in late apoptosis, while the living and untreated (control) cells appear in a rare green color under a fluorescent microscope. B The counts of annexin V/PI positive cells (under a 400× magnification) at each dose are shown in the graph.  C Representative image of cleaved caspase 3 (CCP3) after immunofluorescent staining revealed apoptotic green cells after coal dust exposure. The untreated cells showed a dark field with negative CCP3 staining. DAPI was used as a counterstain for the nucleus. Apoptosis induced by coal dust in MLE-12 cells presented nuclear degeneration with condensed and damaged chromatin indicated by the DAPI stain. Coal dust was colocalized with cells under bright fields. The data values are expressed as Mean ± SEM. The data were derived from triplicate assays and two independent experiments. *p < 0.05 or **p < 0.05 compared with the untreated cells. D Heatmap of the apoptosis and necrosis expression of type-II alveolar epithelial cells in Gene Ontology (GO) terms. (E) GSEA plots of the top two differentially expressed regulons between coal dust (n = 963 cells) and PBS lungs (n = 1900 cells). The gene set enrichment analysis (GSEA) revealed that coal dust-exposed lungs highly enriched the ATP synthesis coupled proton of the collagen fibril organization and response to mechanical stimulus modules. The p-value was calculated using a permutation test (one-sided) based on phenotype, showing the statistical significance of the enrichment score
Fig. 6
Fig. 6
After long-term coal dust exposure, the heterogeneity, phenotypic diversity, and functional alternation of pulmonary macrophages. A tSNE plot view of 3582 macrophages, color-coded by the associated cluster (top) or the assigned cell type (bottom). B The fraction of macrophage subclusters from each of the four mice, box plots of the number of cells (with the plot center corresponding to the median). C The relative increase or decrease of the macrophages of clusters in the coal-exposed lungs was observed, compared with the control (positive represents more, negative represents less); D Single-Cell RNA-SEQ identified seven macrophage populations in mouse lungs. The tSNE diagram shows an aggregation of 3582 cells from 4 mice. E The volcano plot of the SDEGs of pulmonary macrophages from the coal-exposed mice and the control. A total of 129 upregulated genes are presented in red, while 266 downregulated genes are presented in blue (bar chart). F Kyoto Encyclopedia of Genes and Genomes (KEGG) pathway classification map. The genes were divided into six branches according to the biological pathways. G The top 20 significantly pathways are enriched by KEGG based on significantly differentially expressed genes (SDEGs). H The Gene Ontology (GO) enrichment analysis shows the association between the genes and phenotypes of coal dust-exposed mice
Fig. 7
Fig. 7
The crosstalk of Macrophage with Epithelial in response to long-term coal exposure. A The intercellular interactions among different cell types were shown in circos plot, which represents a ligand of one cell type directed to a corresponding receptor of another cell type. The thickness of each string corresponds to the number of receptor-ligand pairs, and color refers to cell type. B The numbers of significant ligand-receptor pairs between epithelial cells and other cells in coal dust-exposed (black bar) and control lung (red bar). C The computational method used to predict the macrophage-epithelial communication based on L-R interaction through scRNA-Seq provides prominent potential signaling in coal dust-exposed (right) and control (left) lungs. D Dot plot showing the mean level and percentage of selected interaction pairs associated with the response of epithelial cells and macrophages (directional). Each gene expression was considered independently for each sample source. E After the Single-cell transcriptome sequencing comparative analysis was performed, a five-set Venn diagram was used to depict unique and shared (overlapping circles) sets of differentially expressed genes (DEGs) in the coal-exposed lungs. Each ellipse shows the total number of coding sequences in one cell type. Intersections indicate predicted shared content
Fig. 8
Fig. 8
A distinctive M2 type activation in alveolar macrophages after coal exposure A A single-cell sequencing plot shows the effects of coal exposure and Vitamin D supplemented coal exposure on the polarization of macrophages to the M2-type. B The group’s distribution of canonical cell markers CD86, Mrc1, and MLPH target gene transcripts across the t-distributed stochastic neighbor embedding (tSNE) plot. The subset of M1 cells was identified by CD86 expression, and the M2 subset was identified by Mrc1 expression. The color key indicates MAGIC-imputed gene expression values. C Violin plots display the distribution of the expression of previously reported M2 polarization-related markers (Mrc1, up), M1 polarization-related markers CD86, bottom). D Double immunofluorescence staining of MLPH and CD206 verified M2-type macrophages that emerged after coal exposure and disappeared after the Vitamin D treatment in the lung tissue and Raw267.4 cells both in vivo and in vitro. Scale bar, 40 μm. E The RAW264.7 cells were treated with phosphate-buffered saline (PBS; control), coal dust, and a combination of coal dust and Vitamin D; the whole-cell lysates were harvested 24 h after the treatment. Western blots determined the expression level of MLPH. β-actin was used as the internal control

Similar articles

Cited by

References

    1. Prasad SK, Singh S, Bose A, Prasad B, Banerjee O, Bhattacharjee A, et al. Association between duration of coal dust exposure and respiratory impairment in coal miners of West Bengal, India. Int J Occup Saf Ergon: JOSE. 2021;27(3):794–804. doi: 10.1080/10803548.2020.1742463. - DOI - PubMed
    1. Lancet. Improving occupational health in China. Lancet. 2019;394 10197:443; doi: 10.1016/S0140-6736(19)31799-4. - PubMed
    1. Zosky GR, Hoy RF, Silverstone EJ, Brims FJ, Miles S, Johnson AR, et al. Coal workers' pneumoconiosis: an Australian perspective. Med J Aust. 2016;204 11:414–8. - PubMed
    1. Perret JL, Plush B, Lachapelle P, Hinks TS, Walter C, Clarke P, et al. Coal mine dust lung disease in the modern era. Respirology. 2017;22 4:662–70; doi: 10.1111/resp.13034. - PubMed
    1. Leon-Mejia G, Silva LF, Civeira MS, Oliveira ML, Machado M, Villela IV, et al. Cytotoxicity and genotoxicity induced by coal and coal fly ash particles samples in V79 cells. Environ Sci Pollut Res Int. 2016;23 23:24019–31; doi: 10.1007/s11356-016-7623-z. - PubMed

Publication types