. 2022 Jan 20;20(1):22.
doi: 10.1186/s12915-021-01225-8.

Histone acetyltransferase NAA40 modulates acetyl-CoA levels and lipid synthesis

Affiliations

Histone acetyltransferase NAA40 modulates acetyl-CoA levels and lipid synthesis

Evelina Charidemou et al. BMC Biol. .

Abstract

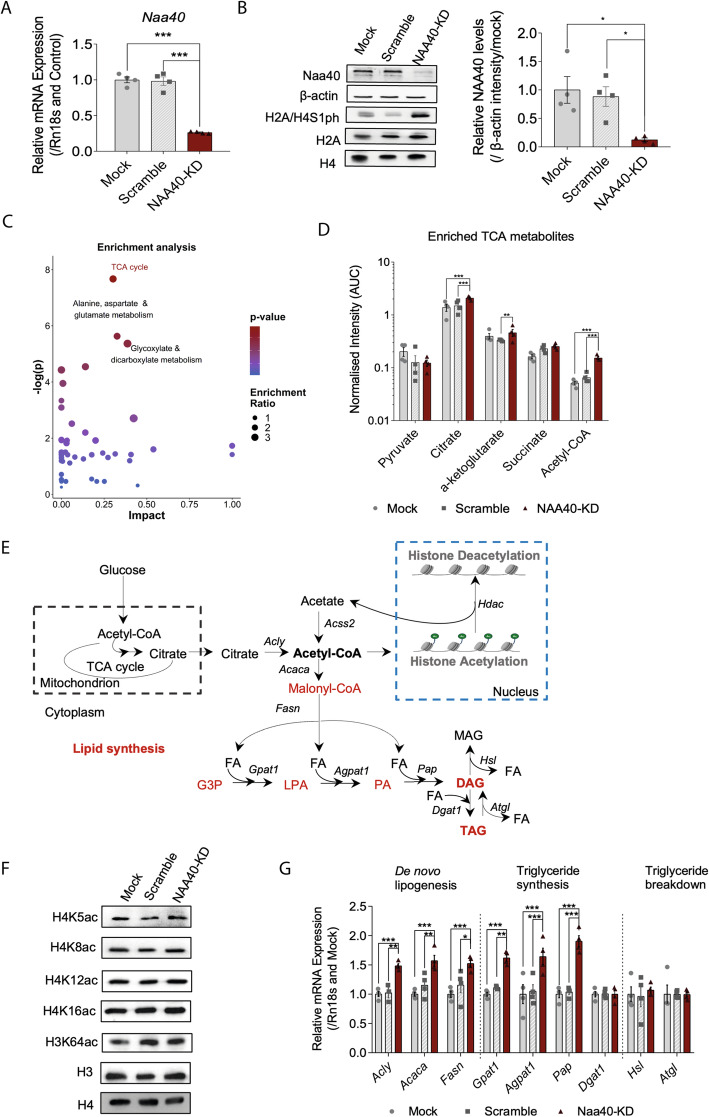
Background: Epigenetic regulation relies on the activity of enzymes that use sentinel metabolites as cofactors to modify DNA or histone proteins. Thus, fluctuations in cellular metabolite levels have been reported to affect chromatin modifications. However, whether epigenetic modifiers also affect the levels of these metabolites and thereby impinge on downstream metabolic pathways remains largely unknown. Here, we tested this notion by investigating the function of N-alpha-acetyltransferase 40 (NAA40), the enzyme responsible for N-terminal acetylation of histones H2A and H4, which has been previously implicated with metabolic-associated conditions such as age-dependent hepatic steatosis and calorie-restriction-mediated longevity.

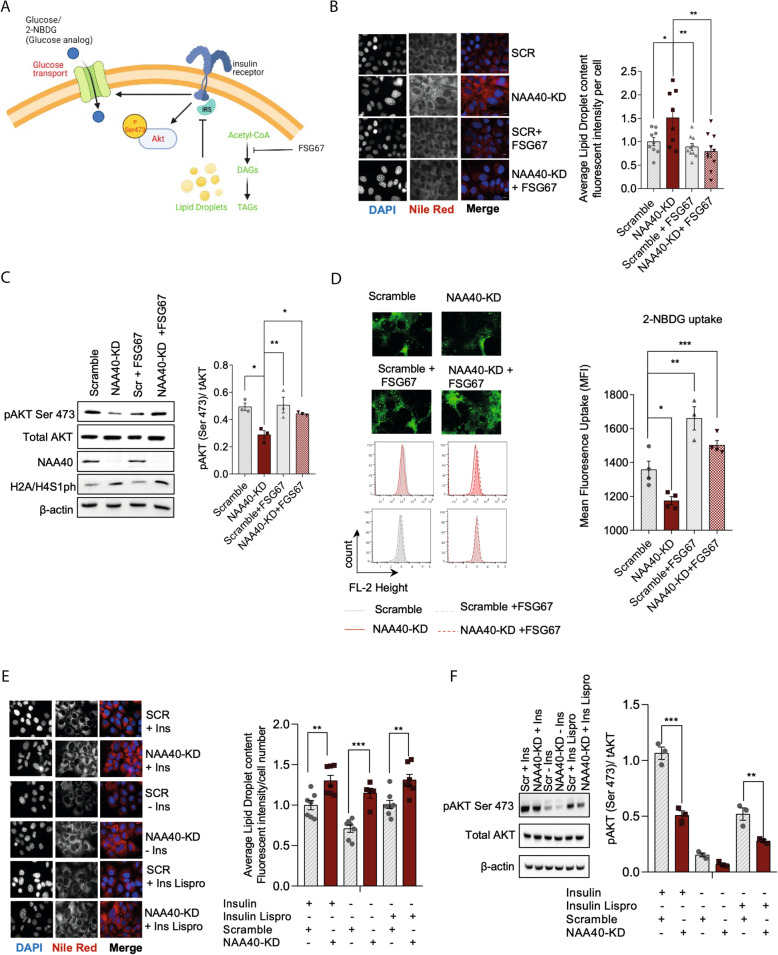
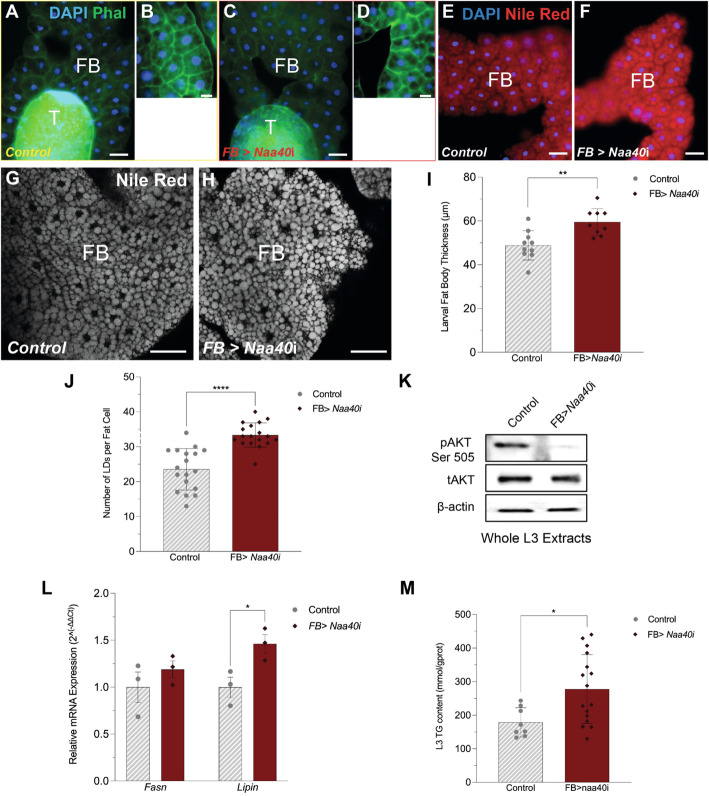
Results: Using metabolomic and lipidomic approaches, we found that depletion of NAA40 in murine hepatocytes leads to significant increase in intracellular acetyl-CoA levels, which associates with enhanced lipid synthesis demonstrated by upregulation in de novo lipogenesis genes as well as increased levels of diglycerides and triglycerides. Consistently, the increase in these lipid species coincide with the accumulation of cytoplasmic lipid droplets and impaired insulin signalling indicated by decreased glucose uptake. However, the effect of NAA40 on lipid droplet formation is independent of insulin. In addition, the induction in lipid synthesis is replicated in vivo in the Drosophila melanogaster larval fat body. Finally, supporting our results, we find a strong association of NAA40 expression with insulin sensitivity in obese patients.

Conclusions: Overall, our findings demonstrate that NAA40 affects the levels of cellular acetyl-CoA, thereby impacting lipid synthesis and insulin signalling. This study reveals a novel path through which histone-modifying enzymes influence cellular metabolism with potential implications in metabolic disorders.

Keywords: Drosophila melanogaster; Epigenetics; Fat body; Histone acetyltransferases; Lipid metabolism; Metabolic disorders; NAA40; acetyl-CoA.


Conflict of interest statement

The authors declare that they have no competing interests.

Figures

Fig. 1
Fig. 1
Metabolic reprogramming after NAA40 depletion in AML12 hepatocytes. A RT-qPCR analysis of expression of NAA40 mRNA levels in mock, scramble, and NAA40-KD cells after 48 h of siRNA treatment (n = 4/group). B Representative immunoblots (left) of protein extracts run in quadruplicate using antibodies against NAA40 and β-actin as loading control as well as western blot analysis of histone extracts using antibodies against the NAA40 antagonistic mark H2A/H4S1ph and H3, H2A, and H4 as loading controls in mock, scramble, and NAA40-KD cells after 48 h of siRNA treatment. Right plot indicates quantification of immunoblot signals NAA40 relative to β-actin. C Aqueous metabolites obtained by LC-MS 48 h after siRNA treatment were subjected to Metaboanalyst for enrichment and pathway analysis. D Analysis of the indicated TCA cycle intermediates in mock, scramble, and NAA40-KD cells measured by LC-MS after 48 h of siRNA treatment, with acetyl-CoA having the most significant changes (n = 4/group). E Schematic representation of the synthesis and consumption of cytosolic acetyl-CoA in mammalian cells. F Representative immunoblots of histone extracts run in triplicate using antibodies against the indicated histone acetylation marks and H3/H4 as loading controls in mock, scramble, and NAA40-KD cells after 48 h of siRNA treatment (n = 3/group). G RT-qPCR analysis of DNL synthesis genes Acly, Acaca, Fasn; triglyceride synthesis genes, Gpat1, Agpat1, Pap and Dgat1 and breakdown genes, Hsl and Atgl after 48 h of siRNA treatment (n = 4/group). All data are presented as mean ± SEM and analysed by 2-way ANOVA with post hoc Tukey’s multiple-comparisons test; *P ≤ 0.05, **P ≤ 0.01, ***P ≤ 0.001. Individual values can be found in Additional file 9: Table S3
Fig. 2
Fig. 2
NAA40 knockdown increases intact lipid content affecting specific DAG and TAG species. A PCA scores plot of the total lipid profiles in mock, scramble, and NAA40-KD cells after 48 h of siRNA treatment. Dark grey circles represent independent mock samples, light grey represent scramble samples and red circles represent NAA40-KD samples (n = 4/group). B PCA loadings plot showing the lipid species influence on the separation between the mock, scramble, and NAA40-KD sample groups (n = 4/group). C Sum of TAG content (n = 4/group), D sum of DAG content and (n = 4/group). E Intracellular levels of short-chain TAG (n = 4/group) and F DAG species measured by LC-MS after 48 h of siRNA treatment (n = 4/group). All data are presented as mean ± SEM and analysed by 1-way ANOVA with post hoc Dunnett’s multiple-comparisons test; *P ≤ 0.05, ** P ≤ 0.01, *** P ≤ 0.001. Individual values can be found in Additional file 9: Table S4
Fig. 3
Fig. 3
NAA40 affects accumulation of lipid droplets, the insulin pathway, and glucose uptake. A Schematic representation of acquired insulin resistance from accumulated lipid droplets. Illustration was created with BioRender.com. B Representative image of lipid droplets by Nile red (red) and nuclei by DAPI (blue) in scramble and NAA40-KD cells with and without FSG67, 48 h after siRNA treatment; Scale bar = 25 μm. Right plot represents the quantification of Nile red using ImageJ (n = 8–10/group). C Representative immunoblot (right) run in triplicate of cell extracts using antibodies against pAKTser473, total AKT, and β-actin as loading control in scramble and NAA40-KD cells with and without FSG67, 48 h after siRNA treatment. Right plot indicates quantification of immunoblot signals pAKT-ser473 relative to total AKT (n = 3/group). D Representative images (top) and histograms (bottom) show comparative glucose uptake between scramble and NAA40-KD cells with and without FSG67, after 48 h of siRNA treatment; cells were incubated with 2-NBDG in glucose free media for 30 min. Right plot shows mean fluorescence uptake quantification in scramble and NAA40-KD cells with and without FSG67, after 48 h of siRNA treatment (n = 4/group). E Representative image of lipid droplets by Nile red (red) and nuclei by DAPI (blue) in scramble and NAA40-KD cells with and without insulin or insulin lispro, 48 h after siRNA treatment; Scale bar = 25 μm. Right plot represents the quantification of Nile red using ImageJ (n = 7–10/group). F Representative immunoblot (right) run in triplicate of cell extracts using antibodies against pAKTser473, total AKT, and β-actin as loading control in scramble and NAA40-KD cells with and without insulin or insulin lispro, 48 h after siRNA treatment. Right plot indicates quantification of immunoblot signals pAKT-ser473 relative to total AKT (n = 3/group). Data are presented as mean ± SEM and analysed by 1-way ANOVA with post hoc Dunnett’s multiple-comparisons test; *P ≤ 0.05, **P ≤ 0.01, ***P ≤ 0.001. Individual values can be found in Additional file 9: Table S5
Fig. 4
Fig. 4
Metabolic rewiring upon NAA40 depletion precedes potential transcriptional effects of NAA40. A Visualisation (right) and quantification (left) of neutral lipids by Nile red (red) and nuclei by DAPI (blue) in scramble and NAA40-KD cells, 6, 12, 24, and 48 h of siRNA treatment; Scale bar = 25 μm (n = 6/group). B Representative immunoblot of whole cell extracts run in triplicate using antibodies against NAA40 and β-actin, as well as western blot analysis of histone extracts using antibodies against the indicated histones and H2A/H4S1 phosphorylation mark (n = 3/group). C Relative abundance of H2A/H4S1ph measured by western blots as well as of lipid droplets measured by Nile red staining 6, 12, 24, and 48 h of siRNA treatment. RT-qPCR analysis of Naa40 and DNL synthesis genes Acly, Acss2, Acaca, and Fasn after 12 h of siRNA treatment (n = 3/group). E Visualisation (right) and quantification (left) of neutral lipids by Nile red (red) and nuclei by DAPI (blue) in scramble, NAA40-KD and NAA40-KD + Actinomycin D cells for 12 h; Scale bar = 25 μm (n = 6–8/group). Data are presented as mean ± SEM and analysed by 1-way ANOVA with post hoc Dunnett’s multiple-comparisons test; *P ≤ 0.05, **P ≤ 0.01, ***P ≤ 0.001. Individual values can be found in Additional file 9: Table S6
Fig. 5
Fig. 5
NAA40 depletion in Drosophila larval fat body promotes lipogenesis and triglyceride accumulation. FB-specific Naa40 knockdown was achieved with the use of the FB-specific GAL4 promoter fly line, 0.68 Lsp2-GAL4, crossed to a UAS-Naa40RNAi line (FB > Naa40i). A–D Phalloidin staining of L3 FBs. Panels A and B outlined in yellow represent widefield images taken at × 20 and × 40 respectively of a control FB. Panels C and D outlined in red, are corresponding × 20 and × 40 images from a Naa40RNAi FB. E, F Widefield images of Nile red-stained FBs acquired at the same settings as in A–D. G, H Confocal imaging of Nile red-stained FBs. Optical stacks (3 optical sections × 0.5 μm each) of control and Naa40RNAi-stained FBs, obtained at the same settings. Scale bars A–F 200 μm and C, D 50 μm (I) FB thickness measurements of control and Naa40RNAi samples (ncontrol = 10; nFB > Naa40i = 9). J Number of lipid droplets (LDs) per fat cell in control and Naa40RNAi samples (LDs in a total of six fat cells were evaluated for three different biological samples per group). K Representative immunoblot run in triplicate of protein extracts prepared from whole L3 larvae for pAKTSer505, tAKT, β-actin in control, and Naa40RNAi conditions (n = 3/group). L RT-qPCR analysis of Lipin and Fasn in control and Naa40RNAi FBs (n = 3/group). M Triglyceride (TG) concentration (mmol/g protein) in whole L3 larvae (ncontrol = 8; nFB > Naa40i = 16). All data are presented as mean ± SEM and analysed by unpaired 2-tailed Student’s t test; *P ≤ 0.05, **P ≤ 0.01, ***P ≤ 0.001. Individual values can be found in Additional file 9: Table S7
Fig. 6
Fig. 6
NAA40 expression inversely correlates with insulin-resistant traits in obese patients. A Scatter plots illustrating the correlation between the expression of NAA40 (adj BMI) and HOMA-IR index, B fasting c-peptide levels, C Hbac (%), and D cholesterol in 575 obese patients; samples extracted from GEO database; GSE130991. The red line indicates the linear regression slope. Statistical analysis was performed using Pearson’s rank correlation coefficient (r)

References

    1. Haws SA, Leech CM, Denu JM. Metabolism and the epigenome: a dynamic relationship. Trends Biochem Sci. 2020;45(9):731–747. - PMC - PubMed
    1. Markham GD, Pajares MA. Structure-function relationships in methionine adenosyltransferases. Cell Mol Life Sci. 2009;66(4):636–648. - PMC - PubMed
    1. Sabari BR, Zhang D, Allis CD, Zhao Y. Metabolic regulation of gene expression through histone acylations. Nat Rev Mol Cell Biol. 2017;18(2):90–101. - PMC - PubMed
    1. Schvartzman JM, Thompson CB, Finley LWS. Metabolic regulation of chromatin modifications and gene expression. J Cell Biol. 2018;17(7):2247–2259. - PMC - PubMed
    1. Wong CC, Qian Y, Yu J. Interplay between epigenetics and metabolism in oncogenesis: mechanisms and therapeutic approaches. Oncogene. 2017;36(24):3359–3374. - PMC - PubMed

Publication types

LinkOut - more resources