Observational Study
. 2022 Jan 20;23(1):12.
doi: 10.1186/s12931-021-01923-5.

The use of exhaled air analysis in discriminating interstitial lung diseases: a pilot study

Affiliations
Observational Study

The use of exhaled air analysis in discriminating interstitial lung diseases: a pilot study

L Plantier et al. Respir Res. .

Abstract

Background: Fibrotic Interstitial lung diseases (ILD) are a heterogeneous group of chronic lung diseases characterized by diverse degrees of lung inflammation and remodeling. They include idiopathic ILD such as idiopathic pulmonary fibrosis (IPF), and ILD secondary to chronic inflammatory diseases such as connective tissue disease (CTD). Precise differential diagnosis of ILD is critical since anti-inflammatory and immunosuppressive drugs, which are beneficial in inflammatory ILD, are detrimental in IPF. However, differential diagnosis of ILD is still difficult and often requires an invasive lung biopsy. The primary aim of this study is to identify volatile organic compounds (VOCs) patterns in exhaled air to non-invasively discriminate IPF and CTD-ILD. As secondary aim, the association between the IPF and CTD-ILD discriminating VOC patterns and functional impairment is investigated.

Methods: Fifty-three IPF patients, 53 CTD-ILD patients and 51 controls donated exhaled air, which was analyzed for its VOC content using gas chromatograph- time of flight- mass spectrometry.

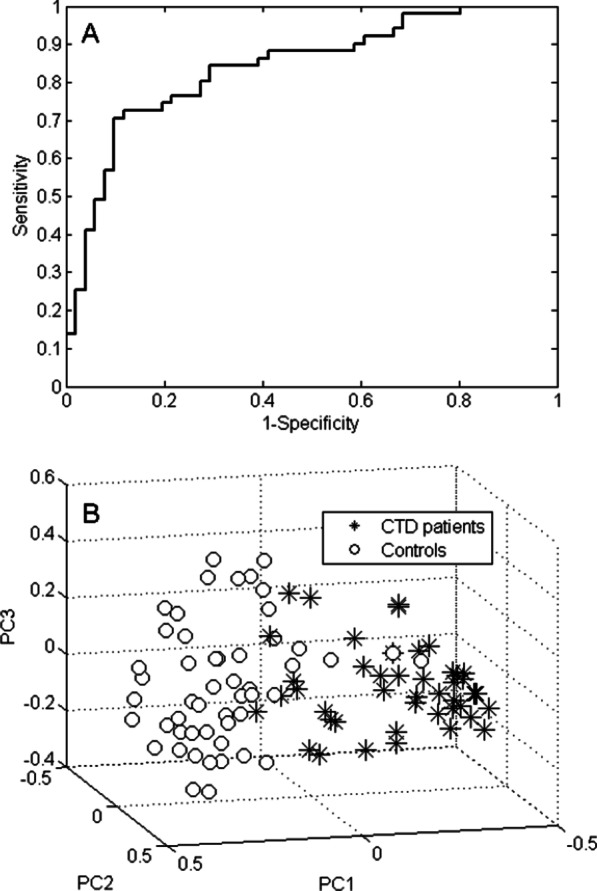
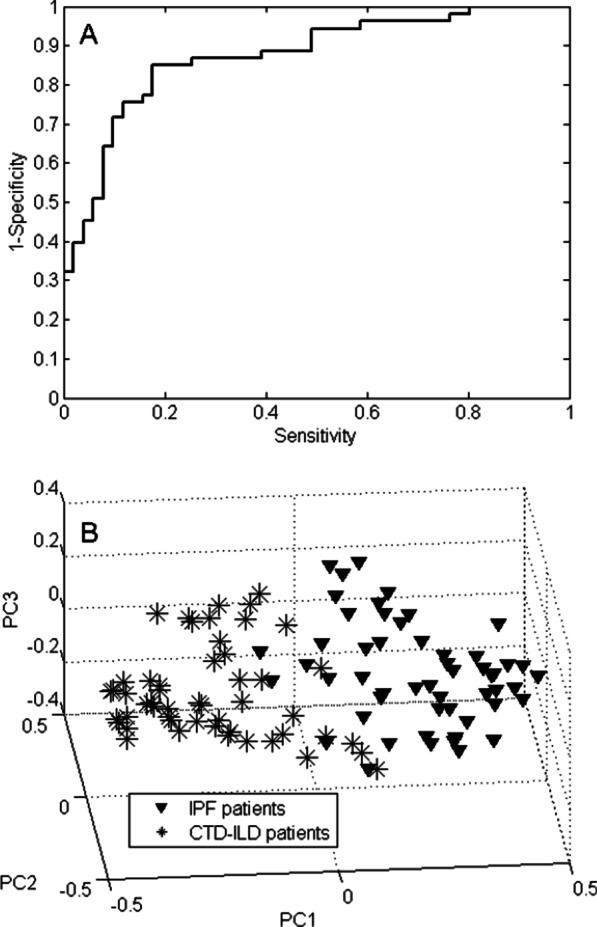
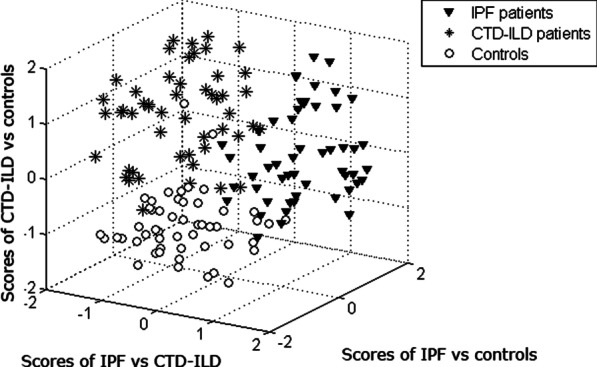
Results: By applying multivariate analysis, a discriminative profile of 34 VOCs was observed to discriminate between IPF patients and healthy controls whereas 11 VOCs were able to distinguish between CTD-ILD patients and healthy controls. The separation between IPF and CTD-ILD could be made using 16 discriminating VOCs, that also displayed a significant correlation with total lung capacity and the 6 min' walk distance.

Conclusions: This study reports for the first time that specific VOC profiles can be found to differentiate IPF and CTD-ILD from both healthy controls and each other. Moreover, an ILD-specific VOC profile was strongly correlated with functional parameters. Future research applying larger cohorts of patients suffering from a larger variety of ILDs should confirm the potential use of breathomics to facilitate fast, non-invasive and proper differential diagnosis of specific ILDs in the future as first step towards personalized medicine for these complex diseases.

Keywords: Connective tissue disease associated-ILD (CTD-ILD); Diagnostic profiles; Gas chromatography–time of flight–mass spectrometry (GC-tof–MS); Idiopathic pulmonary fibrosis (IPF); Volatile organic compound (VOC).


Conflict of interest statement

The authors state that they have no competing interests.

Figures

Fig. 1
Fig. 1
Conceptual flowchart presenting the approach used for statistical analysis. In step 1, a database is build with all clinical data and the preprocessed VOCs data contain three main groups: IPF (n =53), CTD-ILD (n=51) and healthy controls (n=51). In step 2, the machine learning method Random Forests (RF) was used to find discriminatory VOCs. For that purpose three different discriminatory RF models were built. Each discriminatory RF model was constructed on a training set (containing 80% of samples of each group) and validated using an independent test set (containing 20% of samples of each group). Training and test sets were selected using Duplex method (27). First RF algorithm was applied on VOCs data containing IPF and controls to find compounds linked to IPF. The second classification model was constructed on chromatograms belonging to CTD-ILD and healthy controls to allow selecting of VOCs related solely to CTD-ILD. The third RF algorithm was applied on data encompassing breath samples of IPF and CTD-ILD with the purpose to find VOCs differentially profiled between these two pulmonary pathologies. To demonstrate the performance of each RF analysis the receiver operating characteristic curve (ROC) is used and sensitivities and specificities determined. In step 3, the compounds selected as significant in step 2 are combined. In step 4, the final RF model is constructed using chromatograms belonging to IPF, CTD-ILD and heathy controls. In order to demonstrate the differences between the three groups Principal Component Analysis (PCA) is performed on proximities obtained from the final RF model (step 5) with the purpose to visualize the relation between all breath samples
Fig. 2
Fig. 2
The importance of the variables for each of the three comparisons. The dashed horizontal lines indicate the chosen cut-off to select the most important VOCs for chemical identification. A IPF vs. controls; B CTD vs. controls; C IPF vs. CTD-ILD
Fig. 3
Fig. 3
VOC profiling for IPF versus controls. A ROC curve of the 34-VOC IPF versus controls profile. The AUC is 91.2%. B 3D PCA plot of Random Forests proximities comparing IPF and controls. The distance between individual points expresses their similarity, i.e. short distance indicates s highly similar VOC profile and vice versa
Fig. 4
Fig. 4
VOC profiling for CTD-ILD patients versus controls. A ROC curve of the 11-VOC CTD-ILD versus controls profile. AUC is 83.9%. B 3D PCA plot of Random Forests proximities comparing CTD-ILD patients and controls
Fig. 5
Fig. 5
VOC profiling for IPF patients versus CTD-ILD patients. A ROC curve of the 16-VOC IPF versus CTD-ILD profile. AUC is 83.8%. B 3D PCA plot of Random Forests proximities comparing IPF and CTD-ILD patients
Fig. 6
Fig. 6
VOC profiling of IPF versus CTD-ILD versus controls. 3D score plot of combined binary classification RF model
Fig. 7
Fig. 7
Correlation between the discriminatory VOCs and lung function parameters TLC and 6MWD. This correlation plot depicts the canonical variate of the VOCs on the x-axis and the canonical variate of the TLC and 6MWD on the y-axis
Fig. 8
Fig. 8
Relative concentrations of individual VOCs reported in literature to differ in the breath of IPF patients and healthy controls. The displayed boxplots represent the following volatiles: A Isoprene, B p-Cymene, C Ethylbenzene, D m- and/or p-Xylene, E o-Xylene. In each plot, the p-value is displayed, where a p-value < 0.05 is considered significant. m-, p-, and o-xylene are hard to distinguish from ethylbenzene, leading to possible misidentification, thus their significances are also reported

References

    1. Antoniou KM, Margaritopoulos GA, Tomassetti S, Bonella F, Costabel U, Poletti V. Interstitial lung disease. Eur Respir Rev. 2014;23(131):40–54. - PMC - PubMed
    1. American Thoracic S, European Respiratory S. American Thoracic Society/European Respiratory Society International Multidisciplinary Consensus Classification of the Idiopathic Interstitial Pneumonias. This joint statement of the American Thoracic Society (ATS), and the European Respiratory Society (ERS) was adopted by the ATS board of directors, June 2001 and by the ERS Executive Committee, June 2001. Am J Respir Crit Care Med. 2002;165(2):277–304. - PubMed
    1. Duchemann B, Annesi-Maesano I, Jacobe de Naurois C, Sanyal S, Brillet PY, Brauner M, et al. Prevalence and incidence of interstitial lung diseases in a multi-ethnic county of Greater Paris. Eur Respir J. 2017. 10.1183/13993003.02419-2016. - PubMed
    1. Kim EJ, Collard HR, King TE., Jr Rheumatoid arthritis-associated interstitial lung disease: the relevance of histopathologic and radiographic pattern. Chest. 2009;136(5):1397–1405. - PMC - PubMed
    1. Winstone TA, Assayag D, Wilcox PG, Dunne JV, Hague CJ, Leipsic J, et al. Predictors of mortality and progression in scleroderma-associated interstitial lung disease: a systematic review. Chest. 2014;146(2):422–436. - PubMed

Publication types