. 2022 Jan 25;79(3):250-263.
doi: 10.1016/j.jacc.2021.10.043.

Lifetime Risk of Heart Failure Among Participants in the Framingham Study

Affiliations

Lifetime Risk of Heart Failure Among Participants in the Framingham Study

Ramachandran S Vasan et al. J Am Coll Cardiol. .

Abstract

Background: The residual lifetime risk (RLR) of developing heart failure (HF) may have changed over time because of the increasing population burden of hypertension, obesity, and diabetes; greater survival after myocardial infarction; and a greater lifespan.

Objectives: The authors assessed changes in the RLR for HF in two 25-year epochs (1965-1989 and 1990-2014).

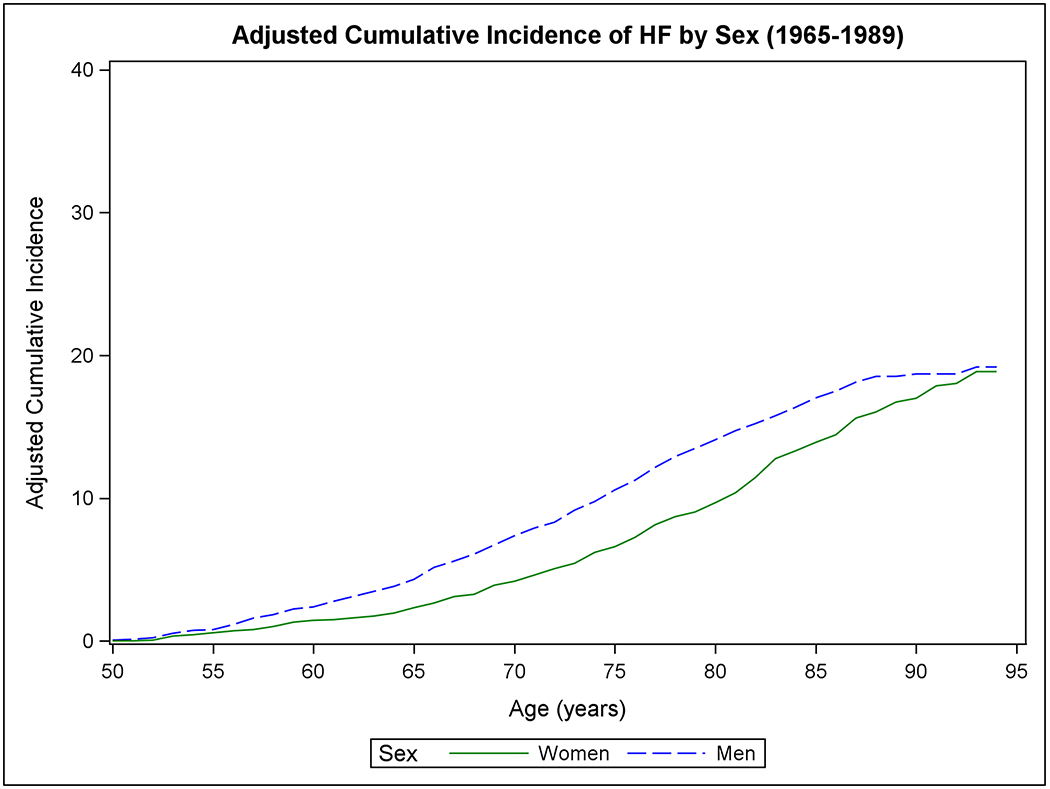
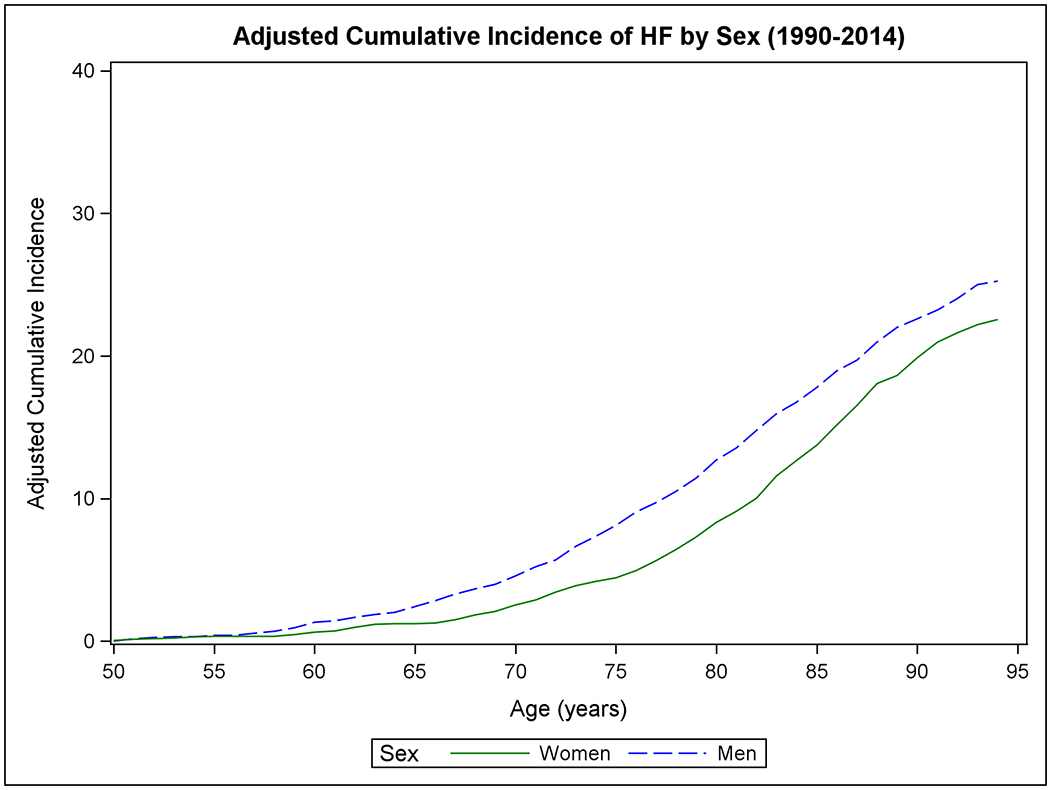
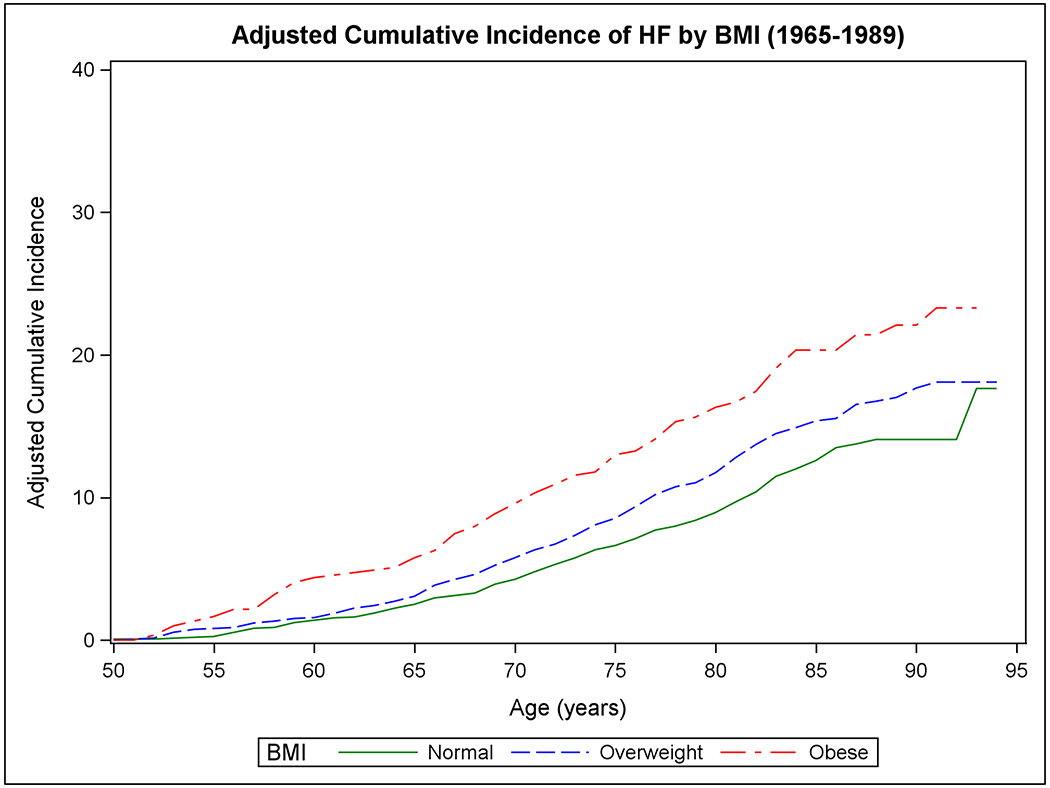
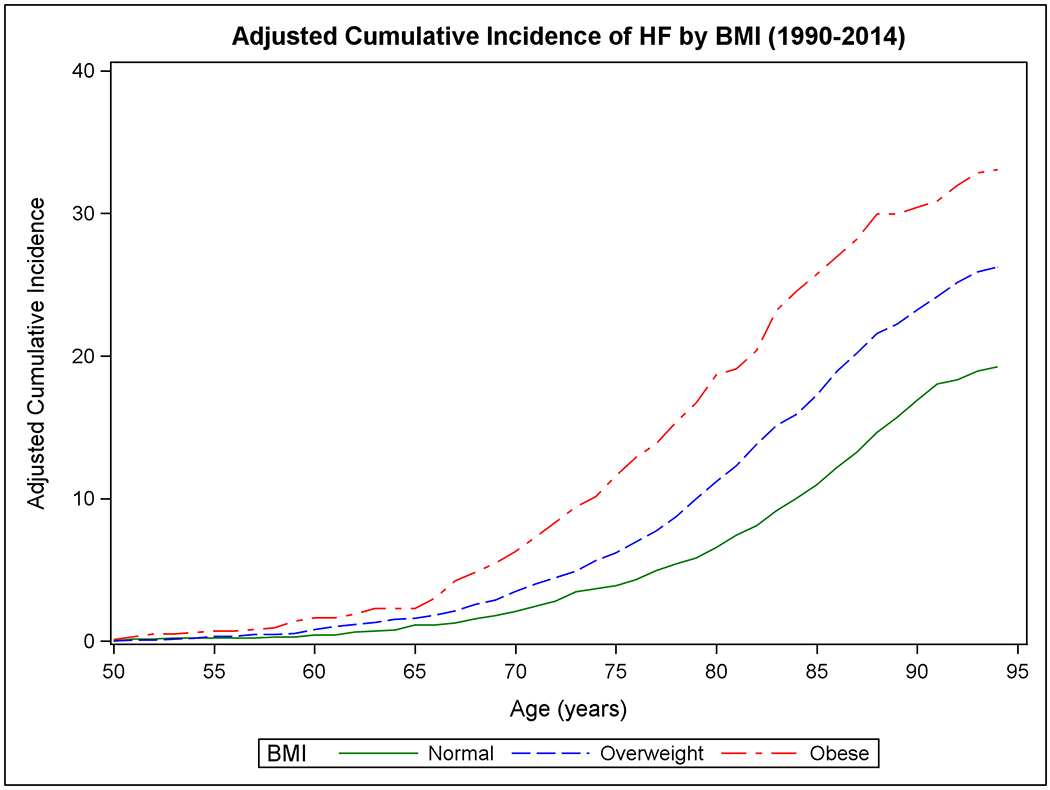
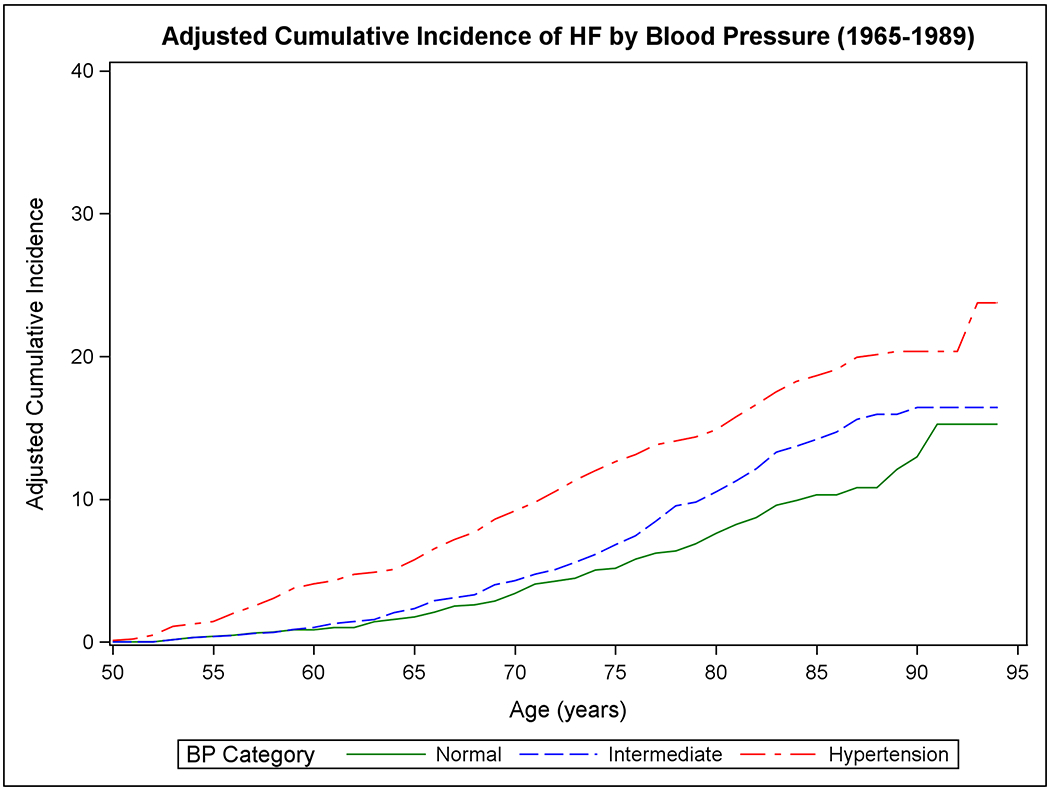
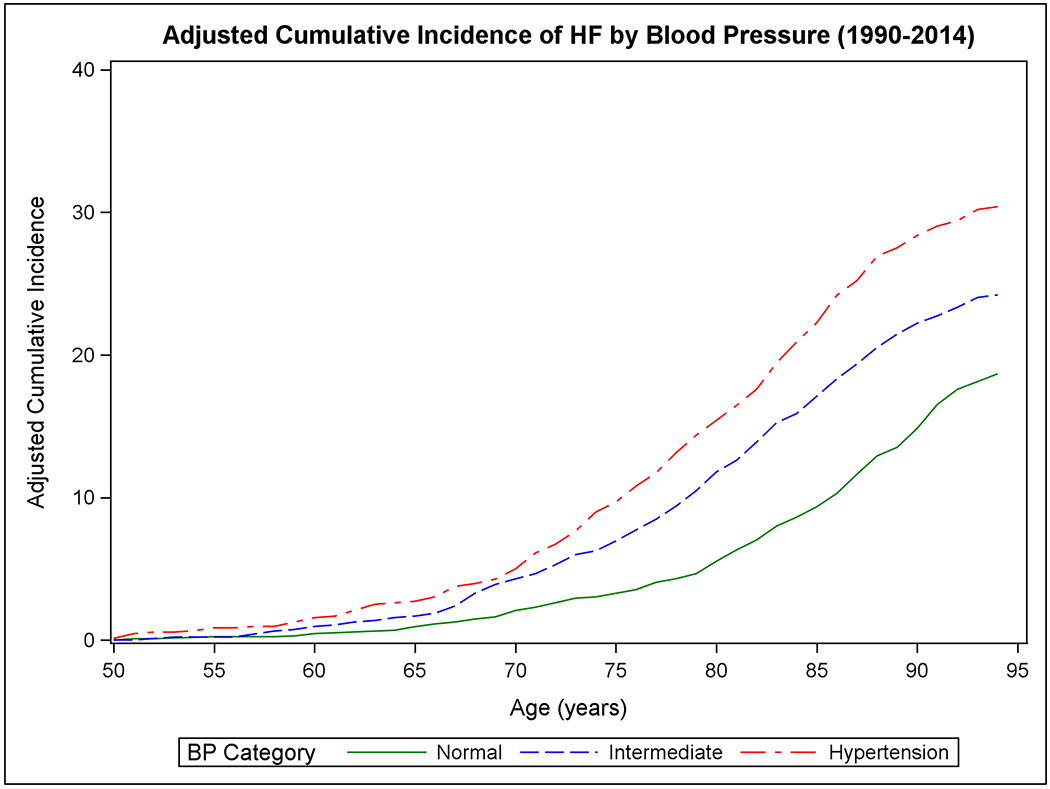
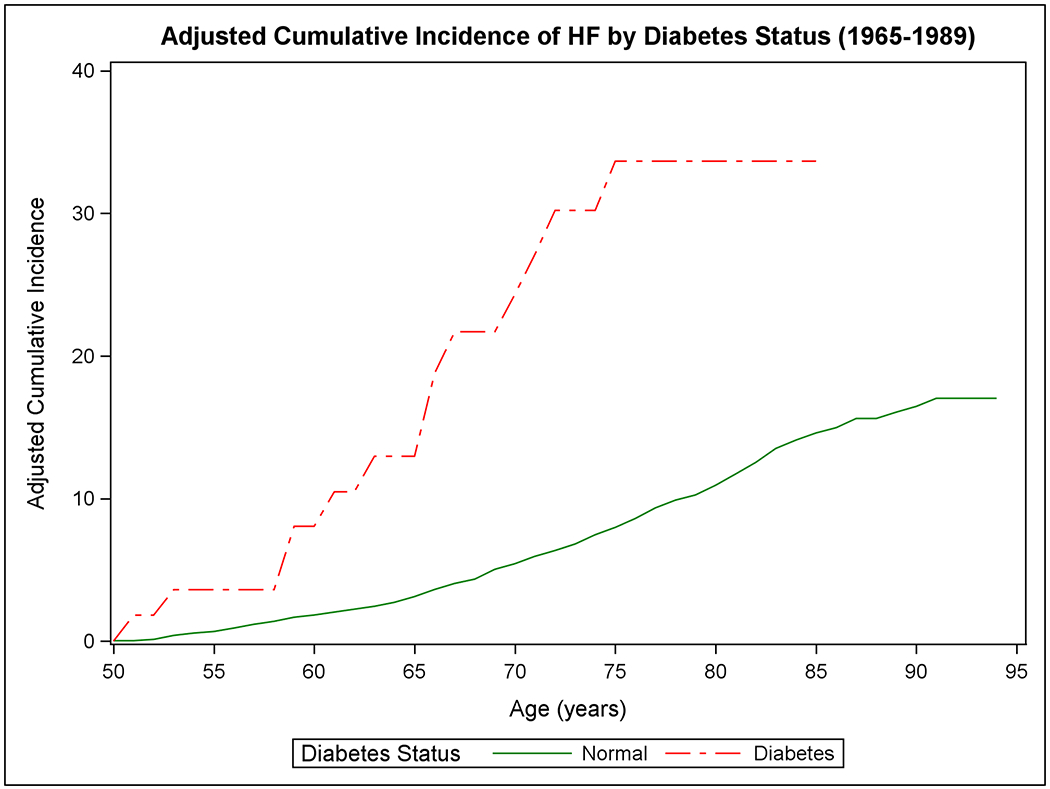
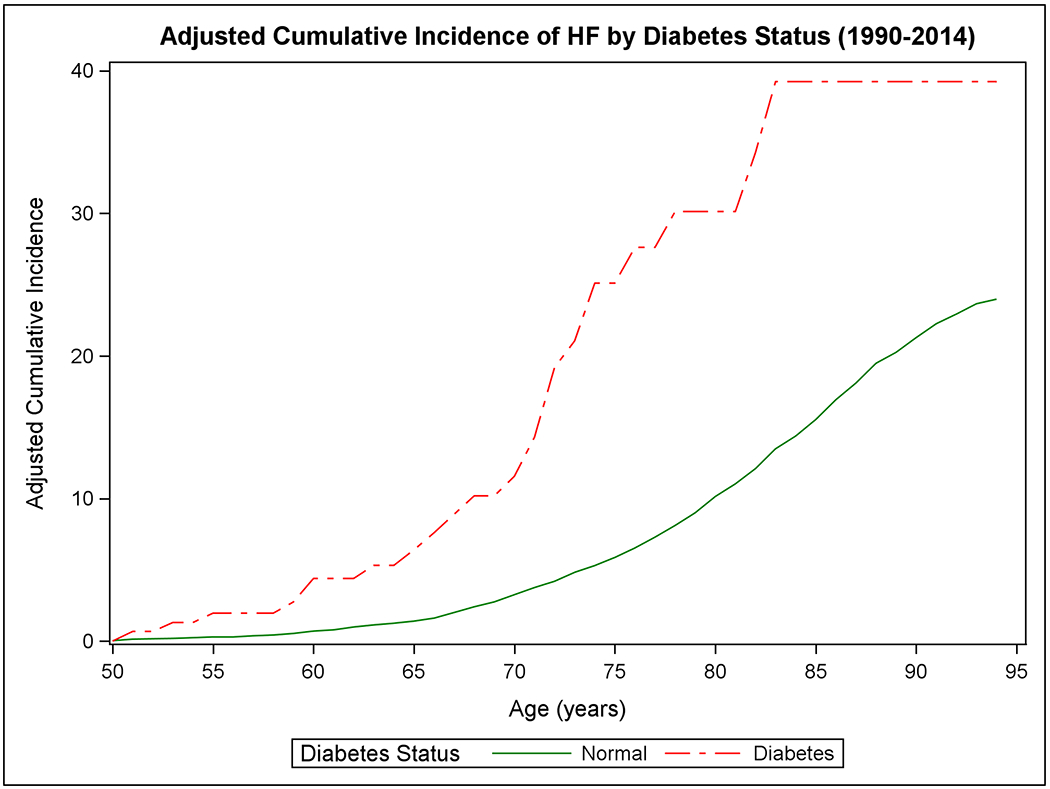
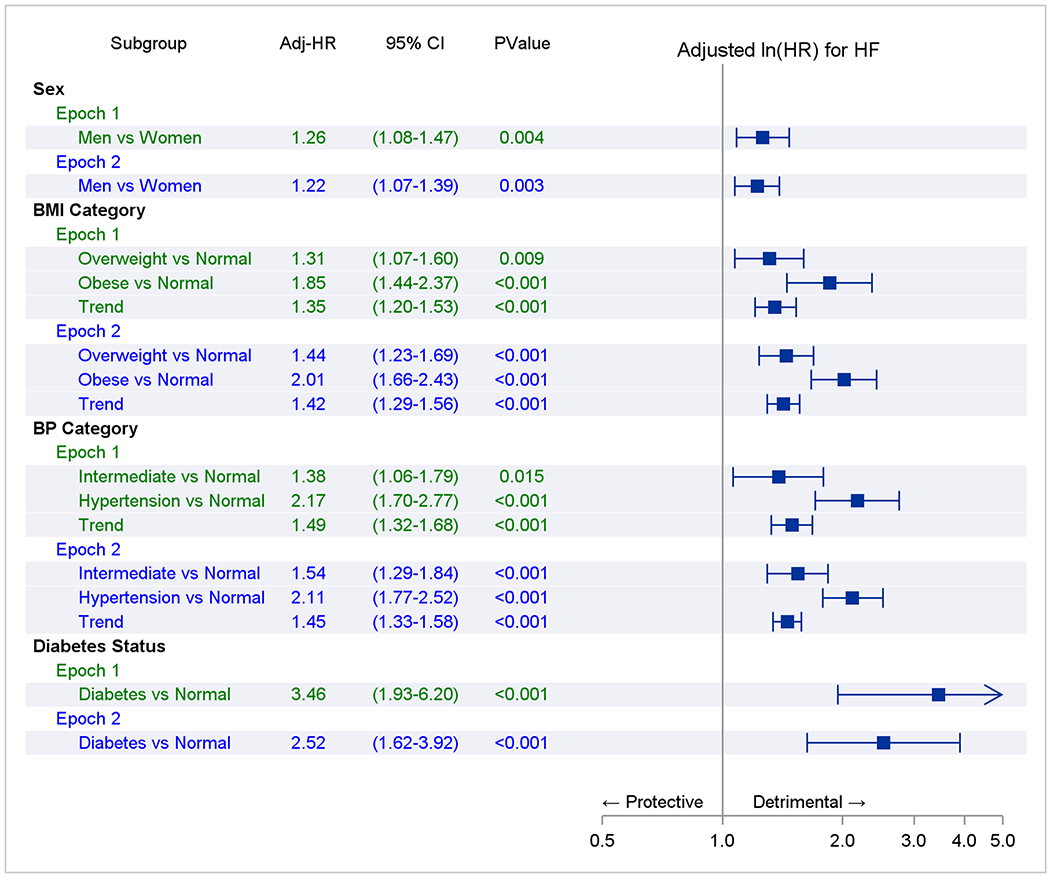
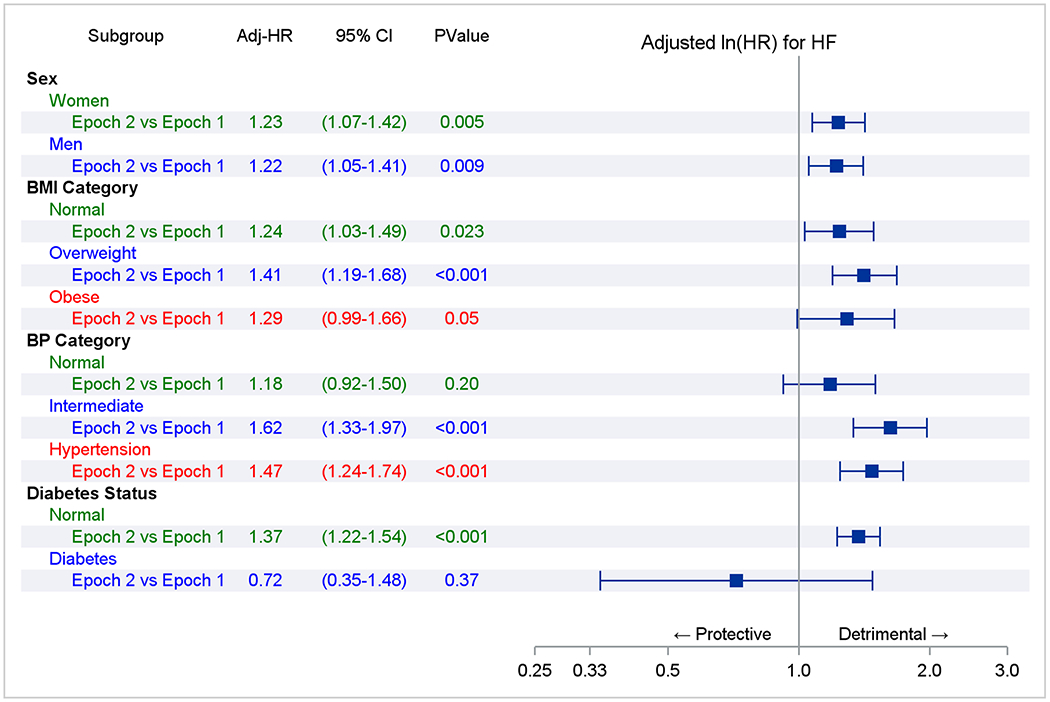
Methods: We compared the RLR of HF at age 50 years (adjusting for competing risk of death) in the 2 epochs in Framingham Study participants overall and in the following strata: sex, body mass index, blood pressure, and diabetes.

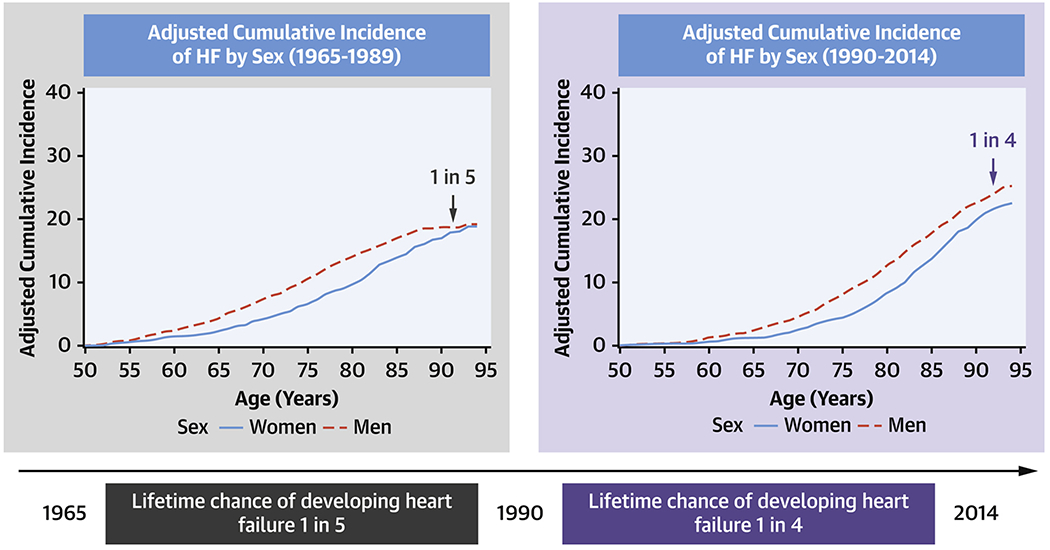
Results: Mean life expectancy increased from 75.9 to 82.1 years in women and 72.5 to 78.1 years in men. We observed 624 HF events over 111,351 person-observations in epoch 1, and 875 HF events over 128,903 person-observations in epoch 2. The mean age at onset of HF increased across the epochs by 6.6 years (women) to 7.2 years (men). The RLR of HF at age 50 years increased across epochs from 18.86% to 22.55% (absolute increase 3.69; 95% CI: 0.90-6.49; P = 0.01) in women, and from 19.19% to 25.25% (absolute increase 6.06; 95% CI: 3.08-9.04; P < 0.001) in men. The increase in RLR of HF in the second epoch was consistent across strata with excess body mass index or higher blood pressure (relative increase of 28%-47%) and in participants without prior myocardial infarction (relative increase of 23%).

Conclusions: The RLR of HF has increased in our community-based sample of White individuals over the last 5 decades, possibly caused by an increase in life expectancy.

Keywords: cohort studies; epidemiology; heart failure; lifetime risk; period effects.


Conflict of interest statement

Funding Support and Author Disclosures This work is supported by Contracts NO1-HC-25195, HHSN268201500001I, and 75N92019D00031 from the National Heart, Lung, and Blood Institute. Dr Vasan is supported in part by the Evans Medical Foundation and the Jay and Louis Coffman Endowment from the Department of Medicine, Boston University School of Medicine. All other authors have reported that they have no relationships relevant to the contents of this paper to disclose.

Figures

Figure 1.
Figure 1.. Mortality-adjusted cumulative incidence of heart failure at age 50 years.
The cumulative incidence of heart failure in the two epochs is displayed by sex in Panels A-B, by BMI categories in Panels C-D, according to BP groups in Panels E-F, and by diabetes status in Panels G-H.
Figure 1.
Figure 1.. Mortality-adjusted cumulative incidence of heart failure at age 50 years.
The cumulative incidence of heart failure in the two epochs is displayed by sex in Panels A-B, by BMI categories in Panels C-D, according to BP groups in Panels E-F, and by diabetes status in Panels G-H.
Figure 1.
Figure 1.. Mortality-adjusted cumulative incidence of heart failure at age 50 years.
The cumulative incidence of heart failure in the two epochs is displayed by sex in Panels A-B, by BMI categories in Panels C-D, according to BP groups in Panels E-F, and by diabetes status in Panels G-H.
Figure 1.
Figure 1.. Mortality-adjusted cumulative incidence of heart failure at age 50 years.
The cumulative incidence of heart failure in the two epochs is displayed by sex in Panels A-B, by BMI categories in Panels C-D, according to BP groups in Panels E-F, and by diabetes status in Panels G-H.
Figure 1.
Figure 1.. Mortality-adjusted cumulative incidence of heart failure at age 50 years.
The cumulative incidence of heart failure in the two epochs is displayed by sex in Panels A-B, by BMI categories in Panels C-D, according to BP groups in Panels E-F, and by diabetes status in Panels G-H.
Figure 1.
Figure 1.. Mortality-adjusted cumulative incidence of heart failure at age 50 years.
The cumulative incidence of heart failure in the two epochs is displayed by sex in Panels A-B, by BMI categories in Panels C-D, according to BP groups in Panels E-F, and by diabetes status in Panels G-H.
Figure 1.
Figure 1.. Mortality-adjusted cumulative incidence of heart failure at age 50 years.
The cumulative incidence of heart failure in the two epochs is displayed by sex in Panels A-B, by BMI categories in Panels C-D, according to BP groups in Panels E-F, and by diabetes status in Panels G-H.
Figure 1.
Figure 1.. Mortality-adjusted cumulative incidence of heart failure at age 50 years.
The cumulative incidence of heart failure in the two epochs is displayed by sex in Panels A-B, by BMI categories in Panels C-D, according to BP groups in Panels E-F, and by diabetes status in Panels G-H.
Figure 2.
Figure 2.. Association of risk factors with heart failure incidence (Fine-Gray regression).
Panel A represents comparisons within an epoch. The referent groups are normal body mass index (BMI), blood pressure (BP), or no diabetes (e.g., overweight vs. normal BMI in epoch 1). Trend indicates a test of a trend across risk factor categories (e.g., across BMI categories in epoch 1). Panel B compares the adjusted-incidence of heart failure associated with a risk factor stratum in epoch 2 versus 1 (referent; e.g., overweight in epoch 2 versus overweight in epoch 1). The point estimate of the hazards ratios and their 95% CI are represented by solid rectangles and the lines on either side.
Central Illustration.
Central Illustration.. Change in lifetime risk of heart failure.
The lifetime risk of developing HF has increased from 1 in 5 during 1965-1989 to 1 in 4 during 1990-2014.

Comment in

References

    1. Bragazzi NL, Zhong W, Shu J et al. Burden of heart failure and underlying causes in 195 countries and territories from 1990 to 2017. Eur J Prev Cardiol 2021. DOI: 10.1093/eurjpc/zwaa147 - DOI - PubMed
    1. Virani SS, Alonso A, Aparicio HJ et al. Heart Disease and Stroke Statistics;2021 Update. Circulation 2021;143:e254–e743. - PubMed
    1. Heidenreich PA, Albert NM, Allen LA et al. Forecasting the impact of heart failure in the United States: a policy statement from the American Heart Association. Circ Heart Fail 2013;6:606–619. - PMC - PubMed
    1. Groenewegen A, Rutten FH, Mosterd A, Hoes AW. Epidemiology of heart failure. Eur J Heart Fail 2020;22:1342–1356. - PMC - PubMed
    1. Jafari LA, Suen RM, Khan SS. Refocusing on the Primary Prevention of Heart Failure. Curr Treat Options Cardiovasc Med 2020;22:13. - PMC - PubMed

Publication types