. 2022 May;81(5):446-455.
doi: 10.1016/j.eururo.2021.12.039. Epub 2022 Jan 17.

Pre-existing Castration-resistant Prostate Cancer-like Cells in Primary Prostate Cancer Promote Resistance to Hormonal Therapy

Affiliations

Pre-existing Castration-resistant Prostate Cancer-like Cells in Primary Prostate Cancer Promote Resistance to Hormonal Therapy

Qing Cheng et al. Eur Urol. 2022 May.

Erratum in

Abstract

Background: Hormonal therapy targeting the androgen receptor inhibits prostate cancer (PCa), but the tumor eventually recurs as castration-resistant prostate cancer (CRPC).

Objective: To understand the mechanisms by which subclones within early PCa develop into CRPC.

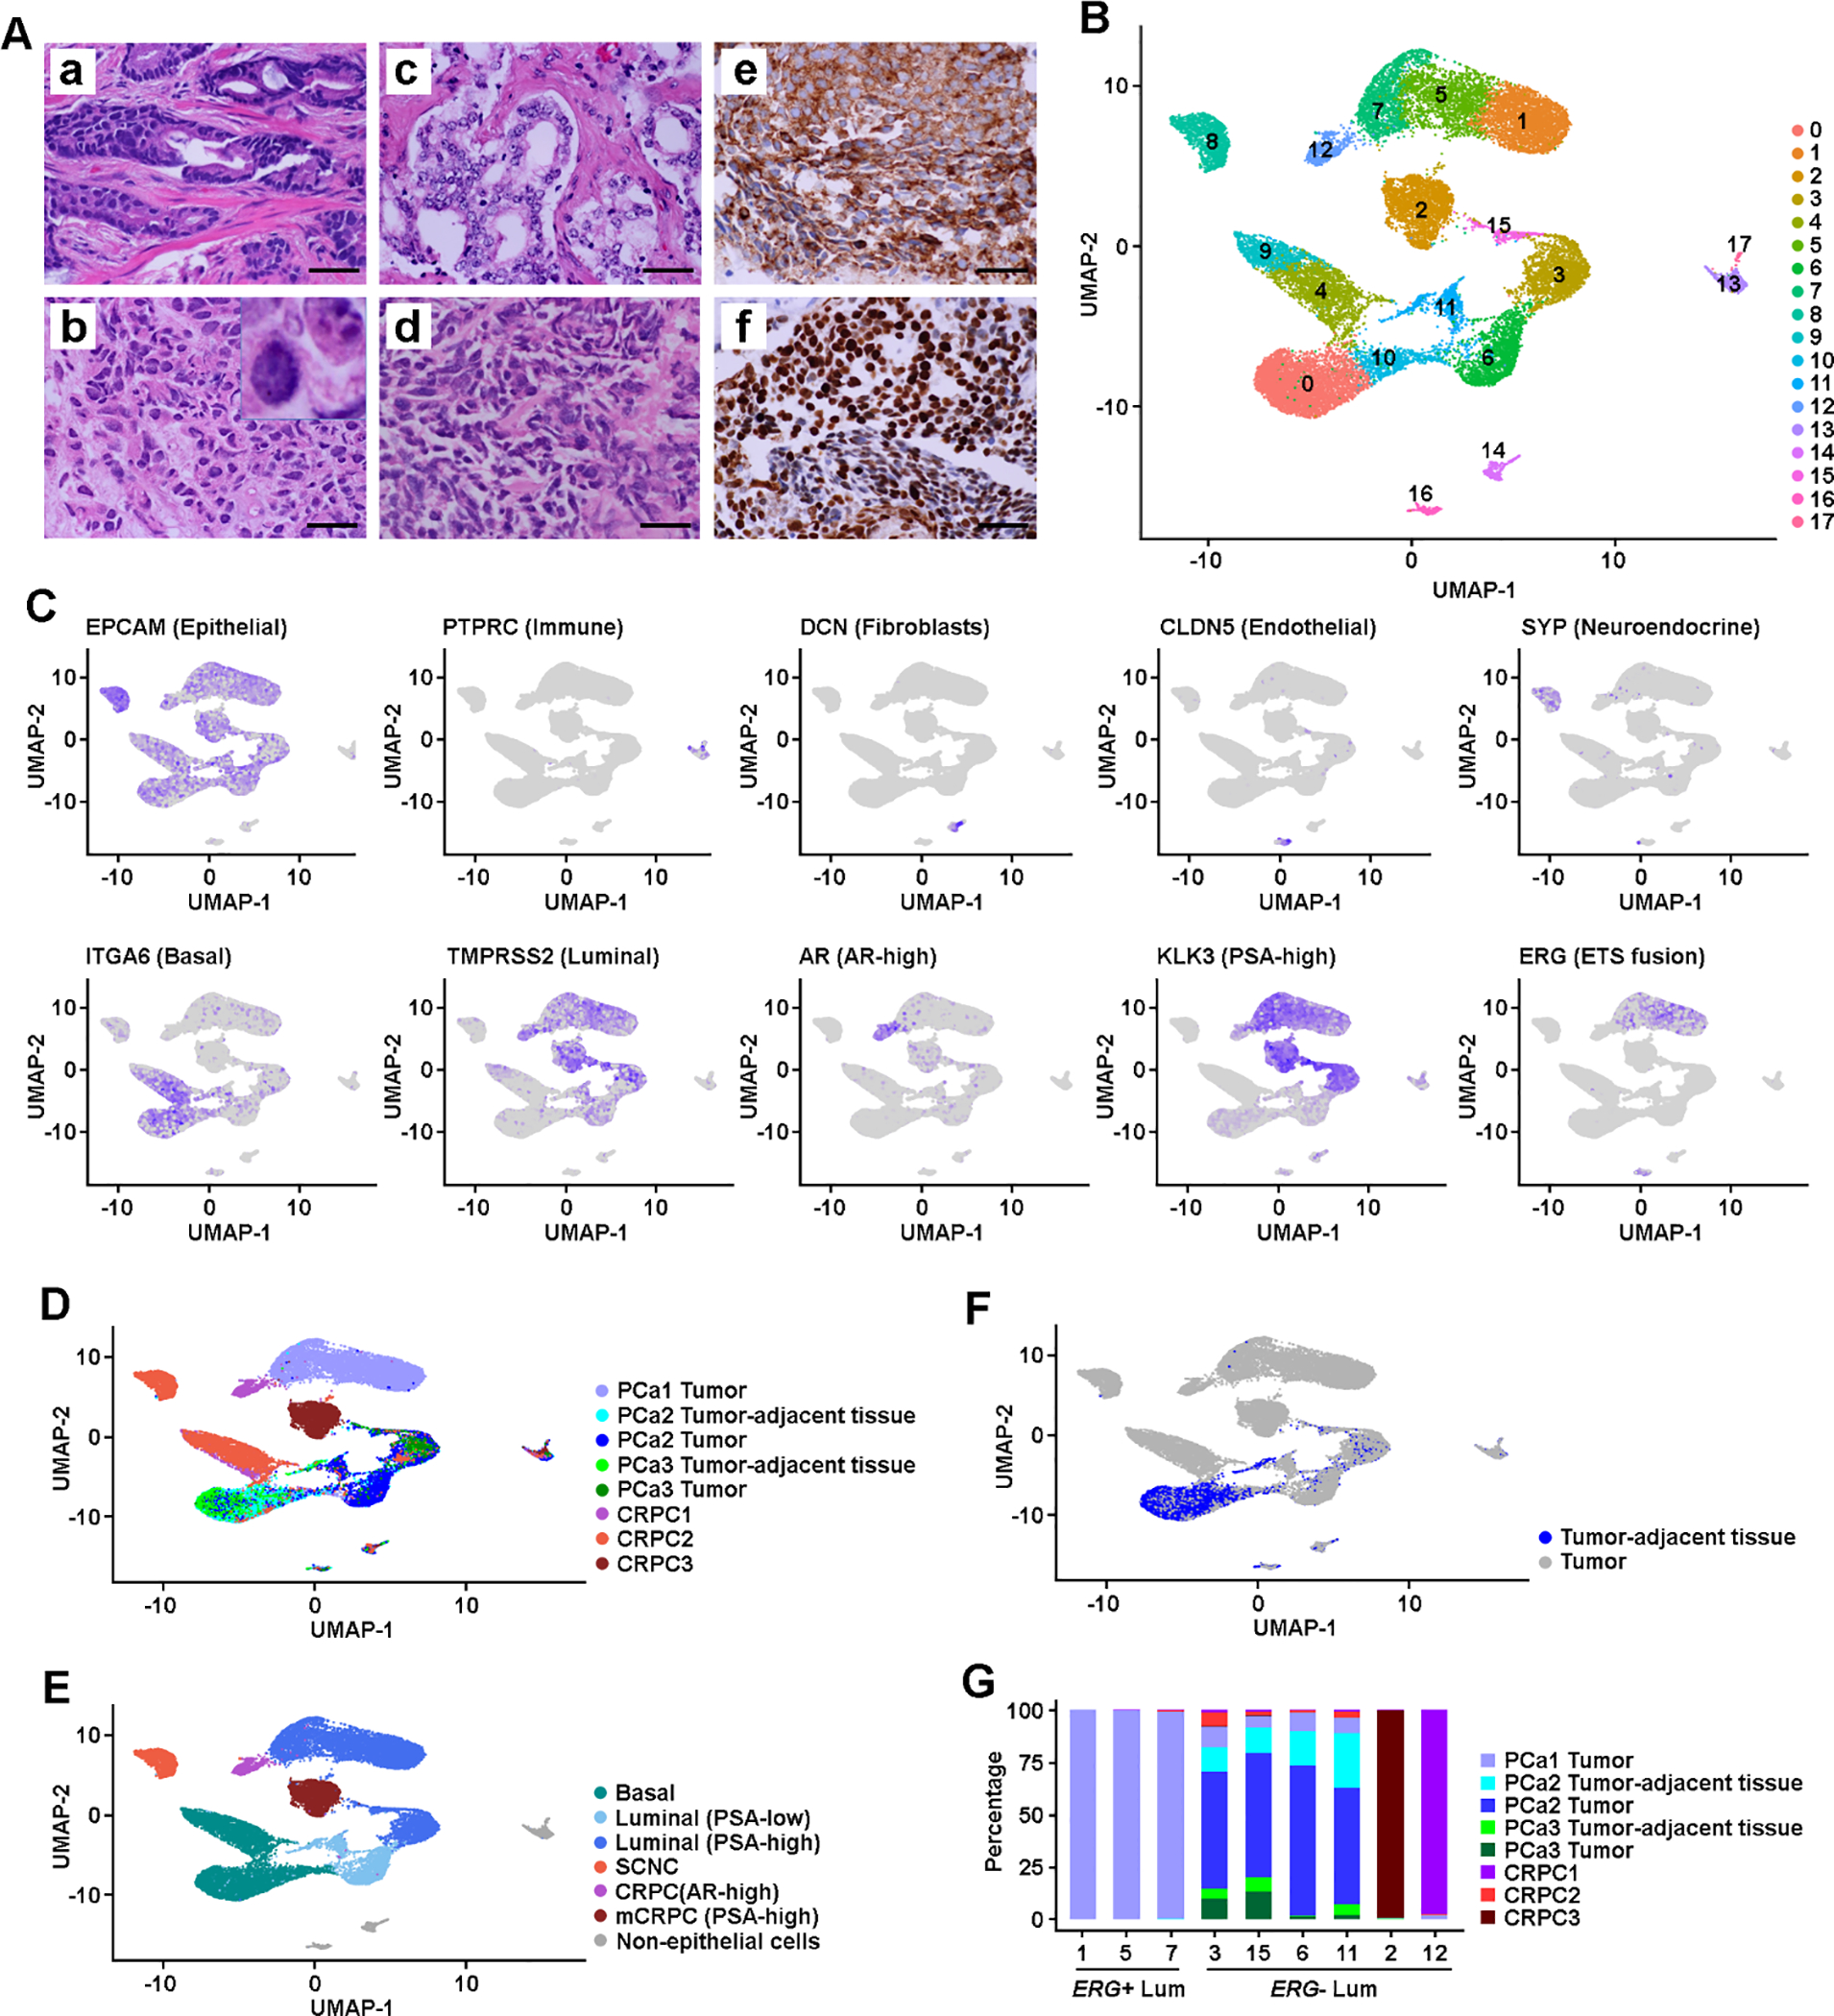
Design, setting, and participants: We isolated epithelial cells from fresh human PCa cases, including primary adenocarcinoma, locally recurrent CRPC, and metastatic CRPC, and utilized single-cell RNA sequencing to identify subpopulations destined to become either CRPC-adeno or small cell neuroendocrine carcinoma (SCNC).

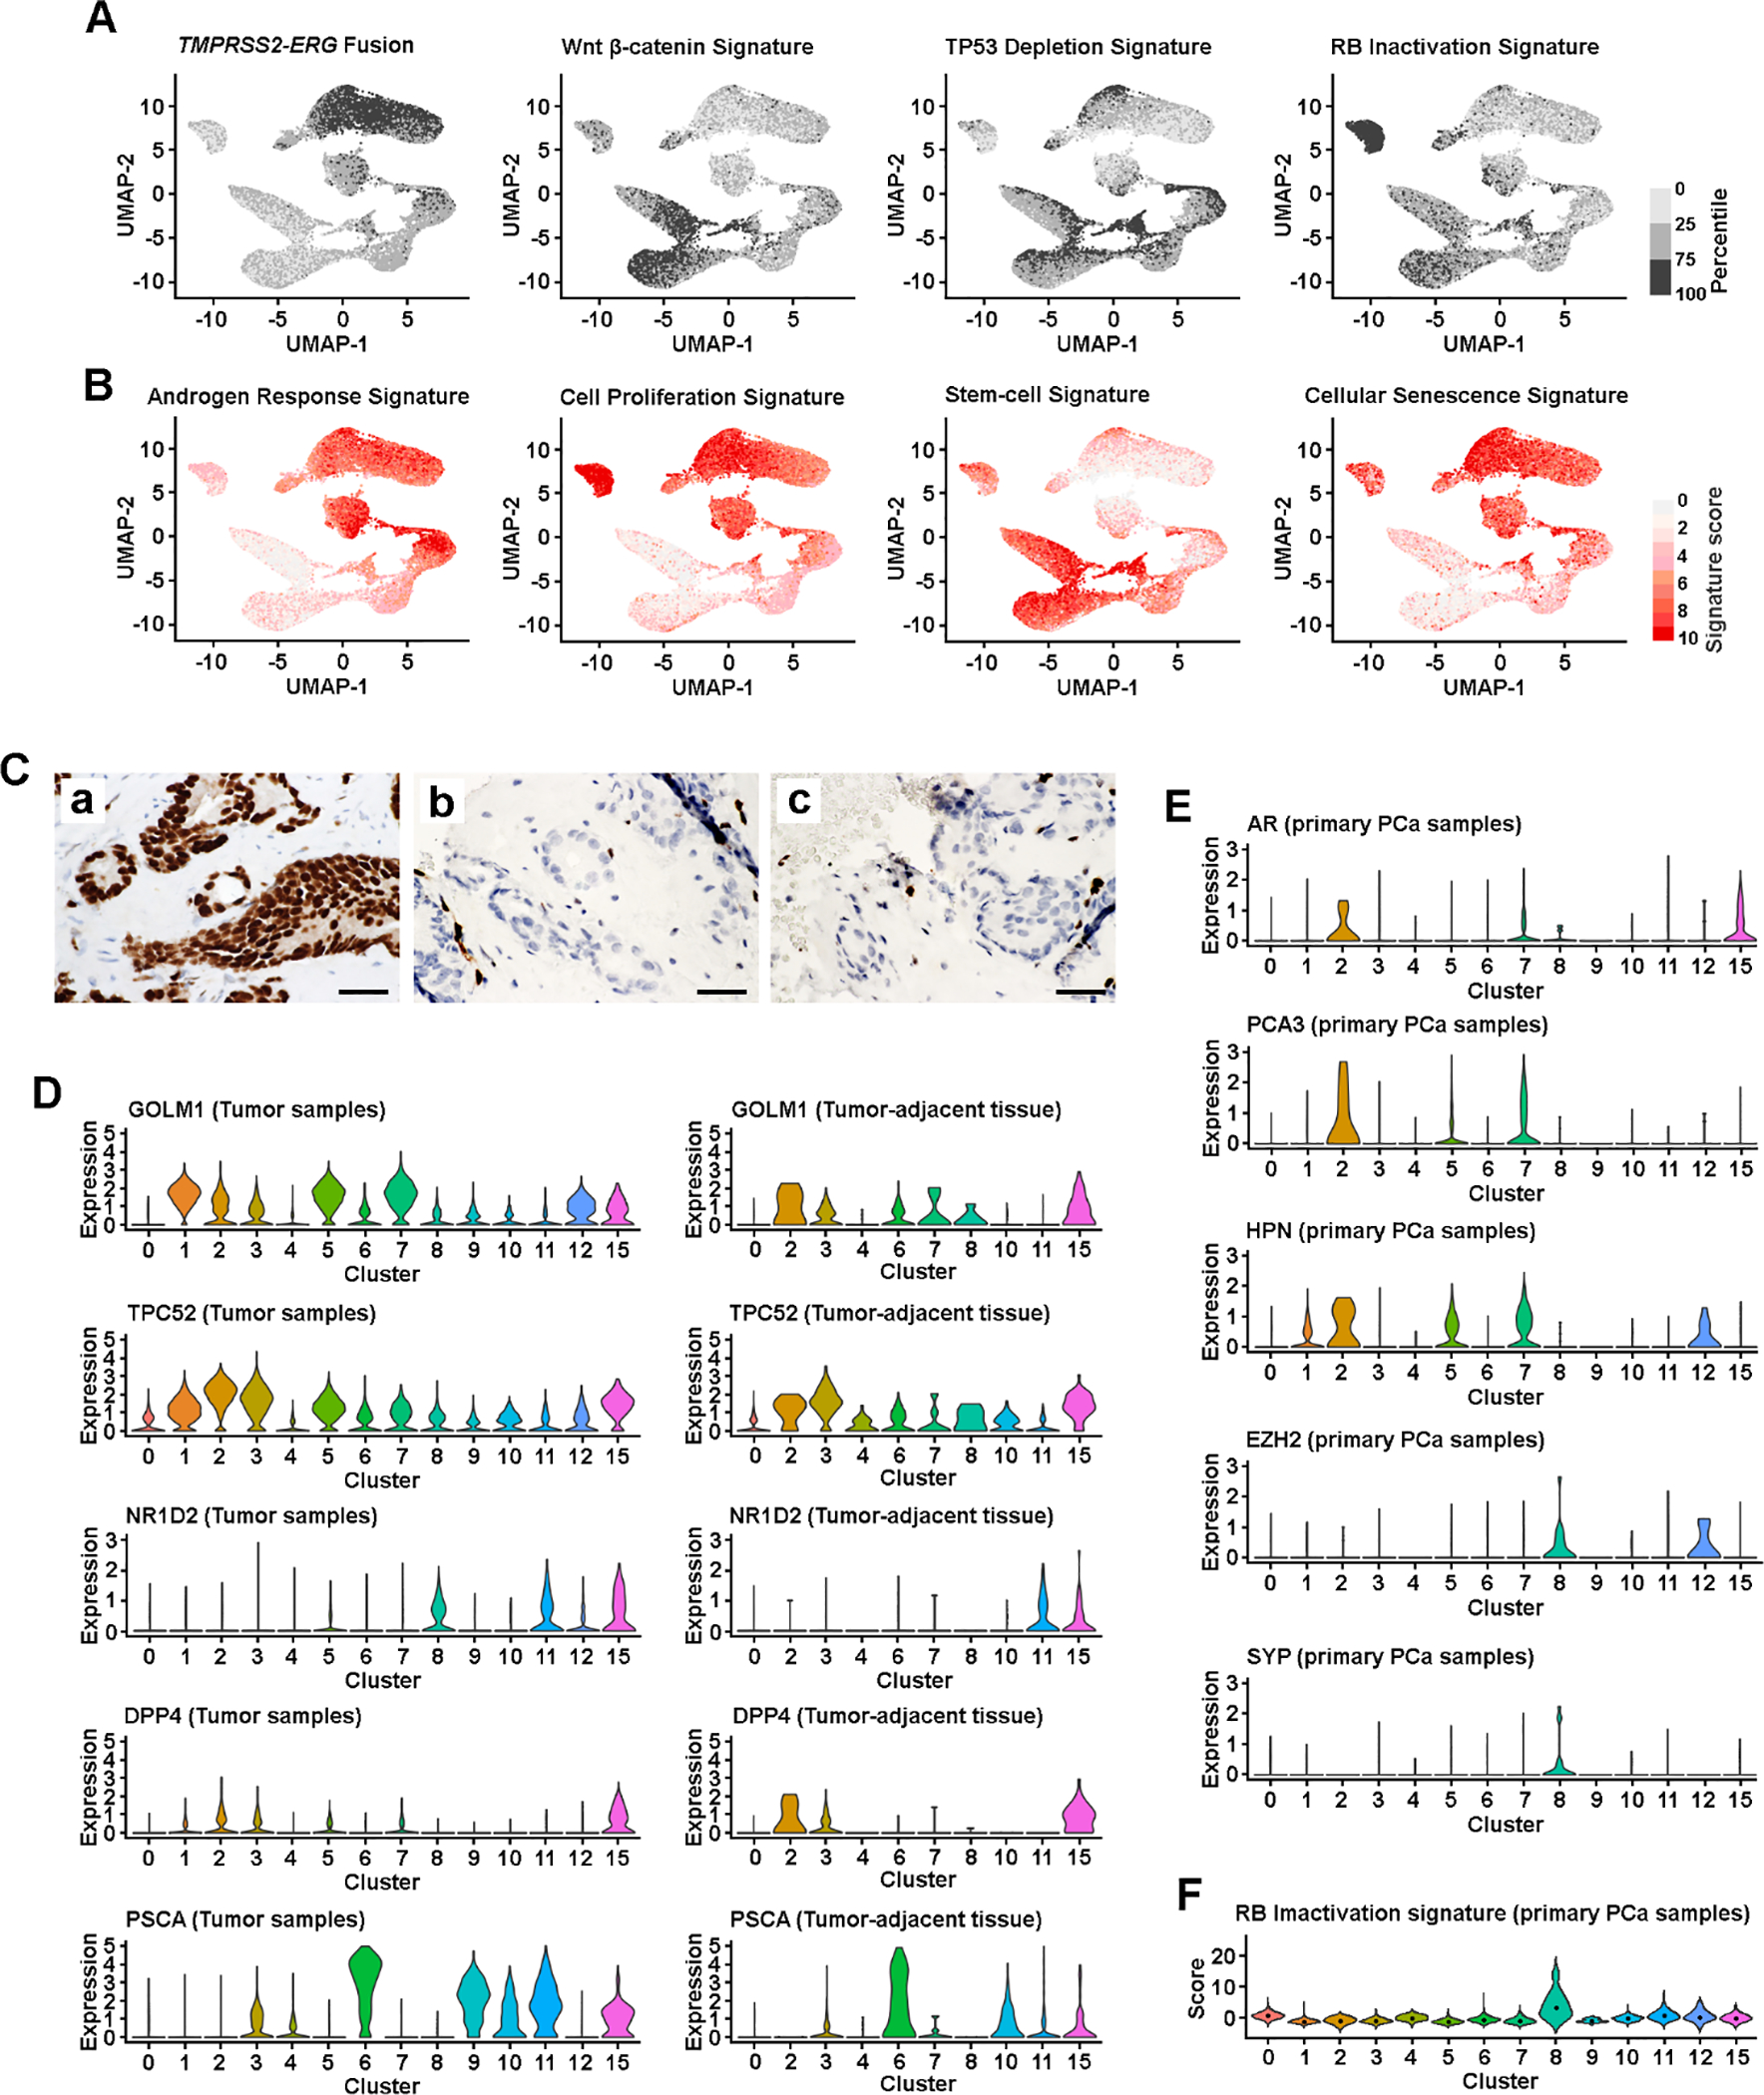
Outcome measurements and statistical analysis: We revealed dynamic transcriptional reprogramming that promotes disease progression among 23226 epithelial cells using single-cell RNA sequencing, and validated subset-specific progression using immunohistochemistry and large cohorts of publically available genomic data.

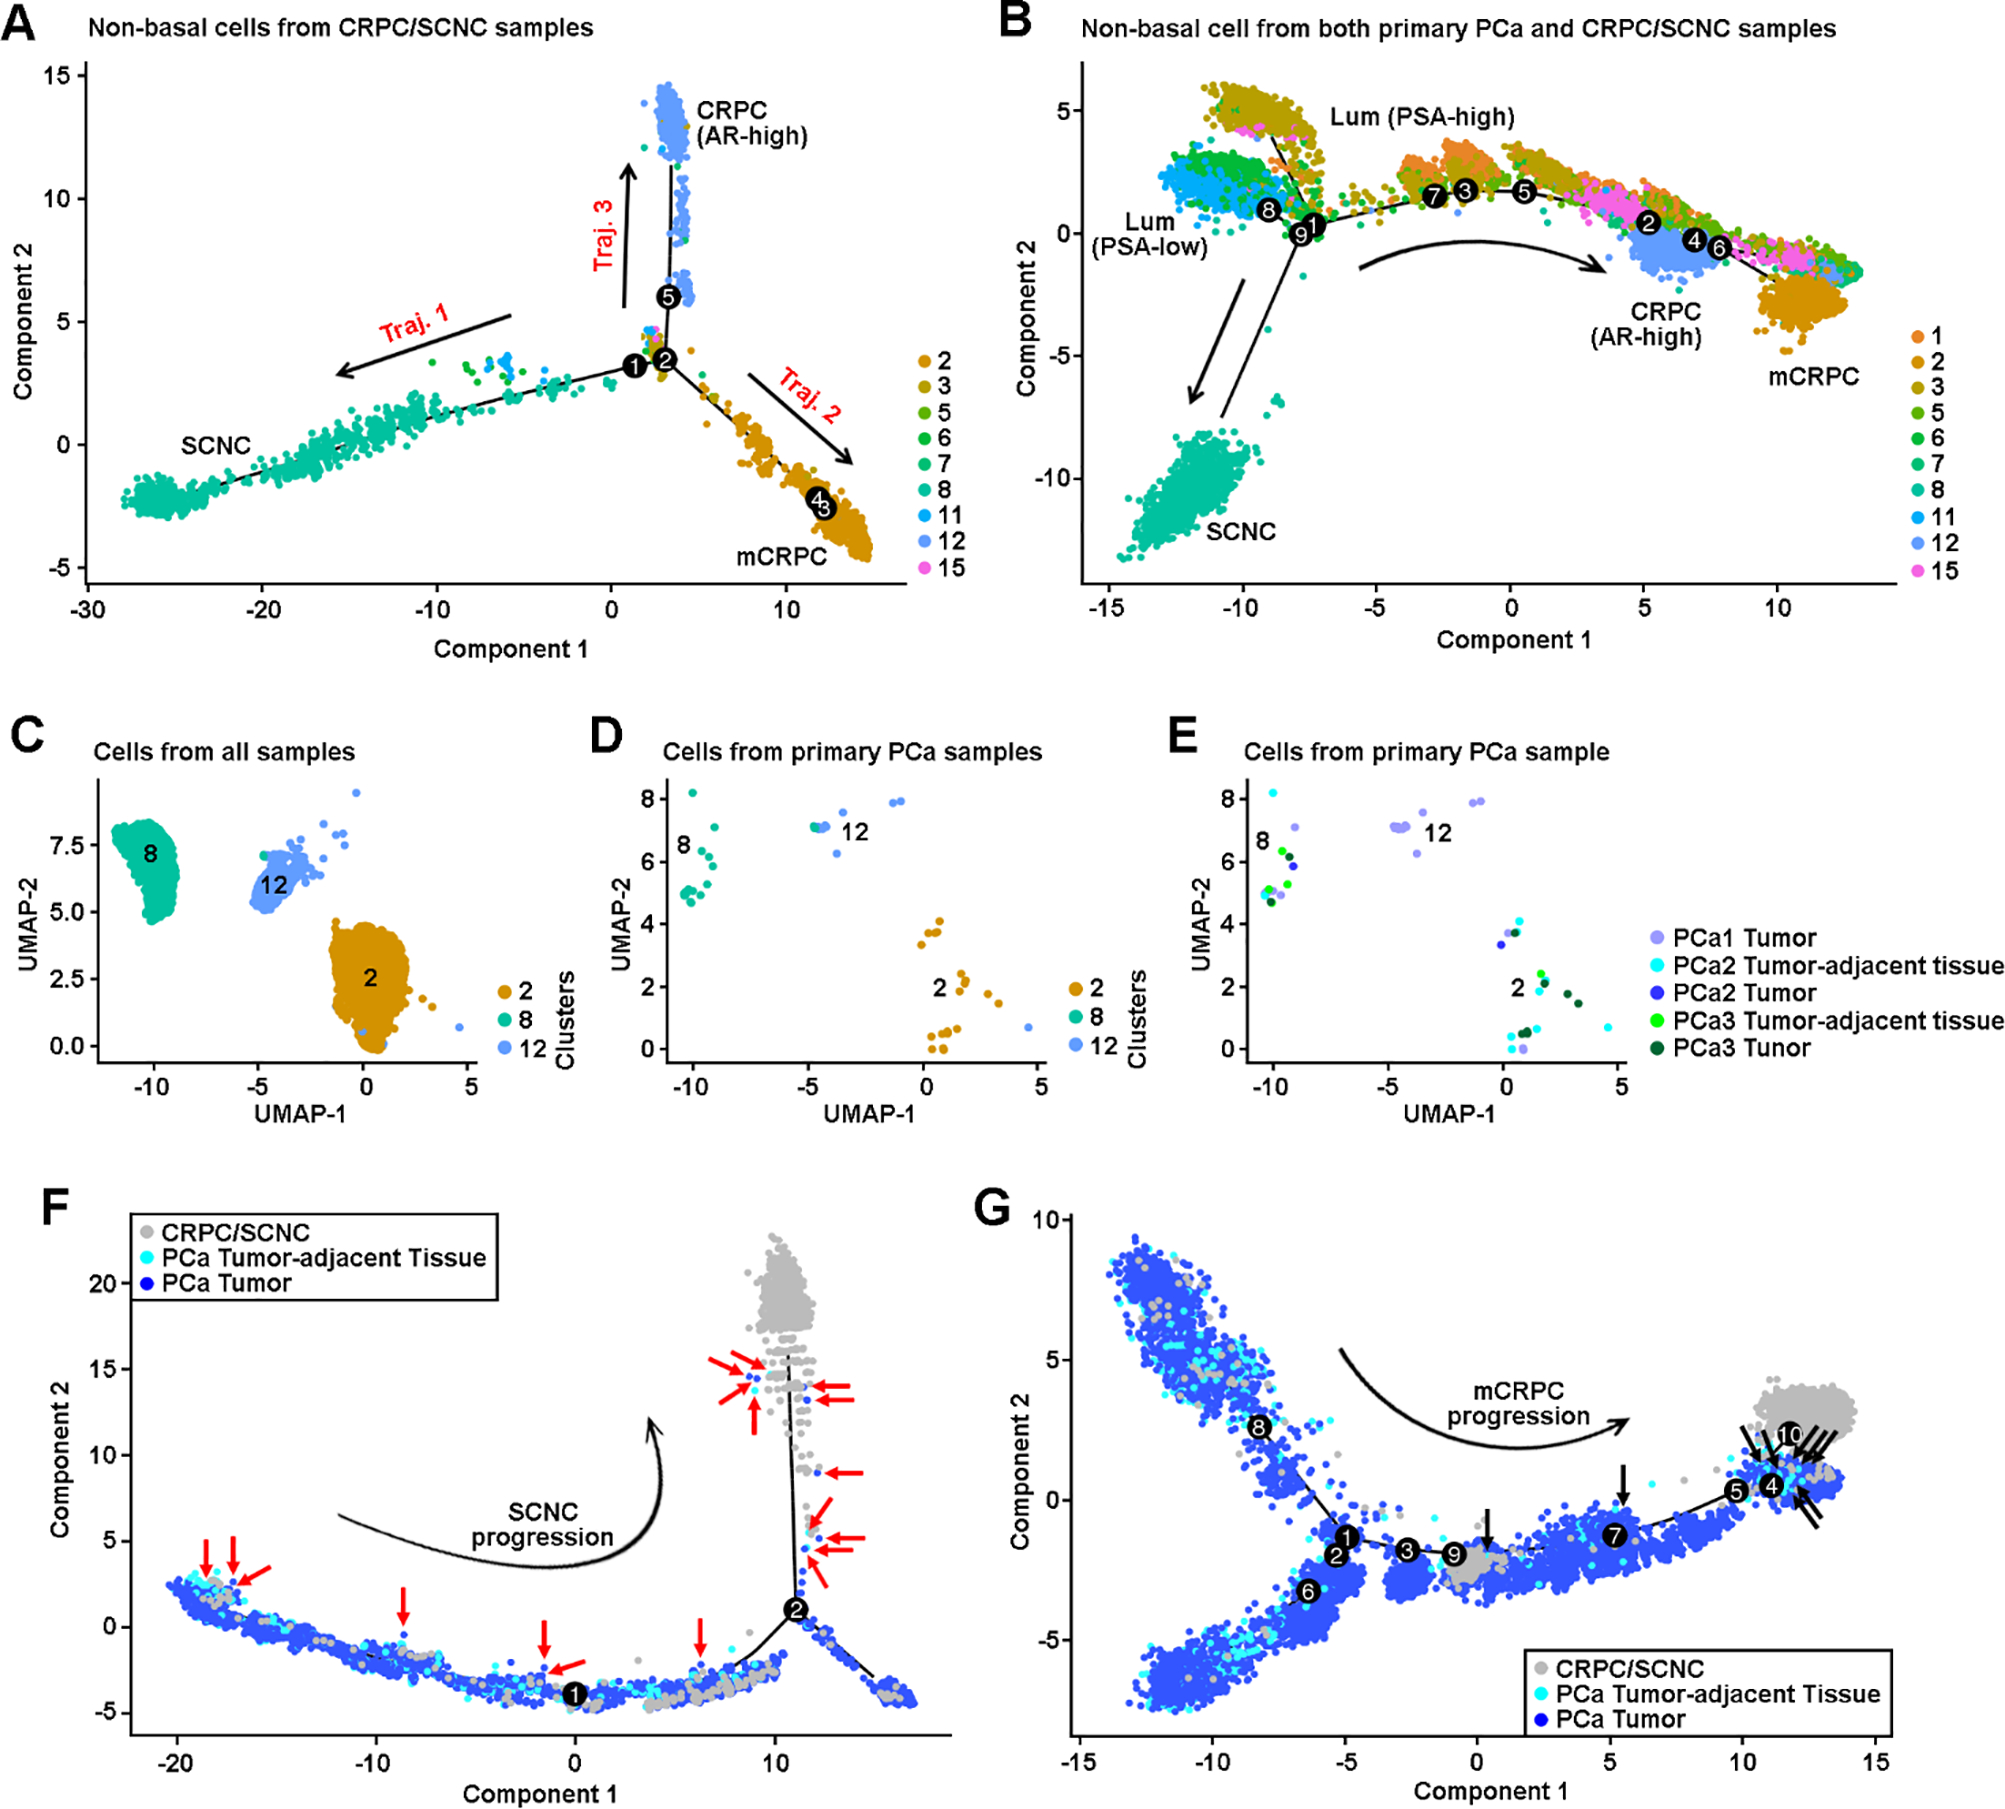
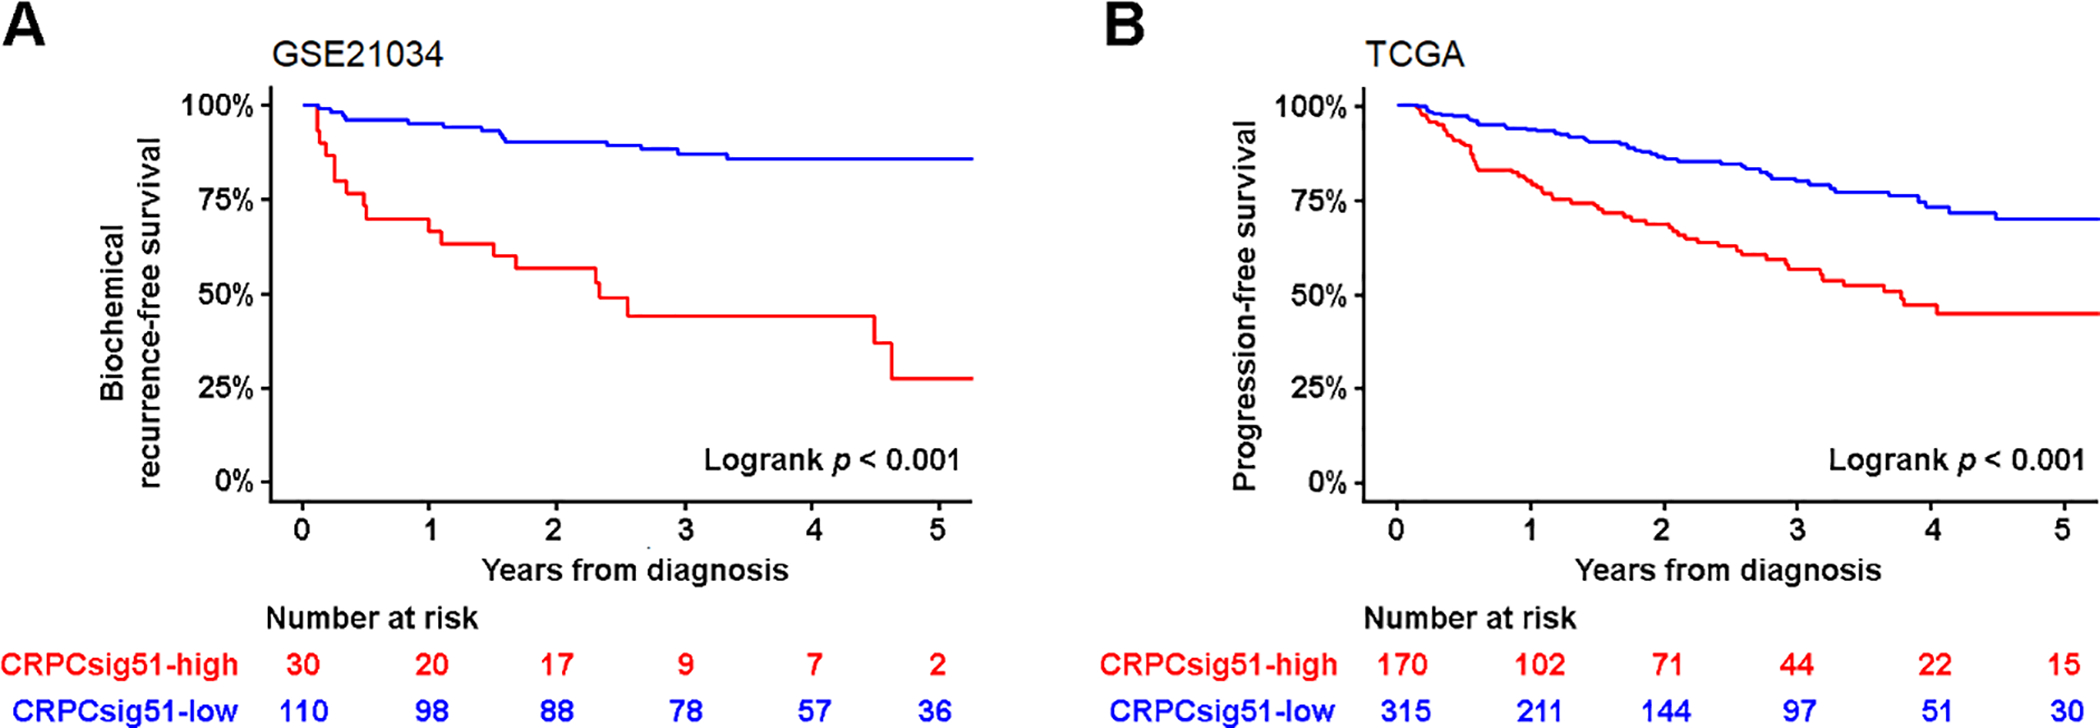
Results and limitations: We identified a small fraction of highly plastic CRPC-like cells in hormone-naïve early PCa and demonstrated its correlation with biochemical recurrence and distant metastasis, independent of clinical characteristics. We show that progression toward castration resistance was initiated from subtype-specific lineage plasticity and clonal expansion of pre-existing neuroendocrine and CRPC-like cells in early PCa.

Conclusions: CRPC-like cells are present early in the development of PCa and are not exclusively the result of acquired evolutionary selection during androgen deprivation therapy. The lethal CRPC and SCNC phenotypes should be targeted earlier in the disease course of patients with PCa.

Patient summary: Here, we report the presence of pre-existing castration-resistant prostate cancer (CRPC)-like cells in primary prostate cancer, which represents a novel castration-resistant mechanism different from the adaptation mechanism after androgen deprivation therapy (ADT). Patients whose tumors harbor increased pre-existing neuroendocrine and CRPC-like cells may become rapidly resistant to ADT and may require aggressive early intervention.

Keywords: Castration-resistant prostate cancer; Castration-resistant prostate cancer–like cells; Critical transcription regulator; Evolutionary trajectory; Intratumor heterogeneity; Large population validation; Neuroendocrine differentiation; Primary prostate cancer; Single-cell transcriptomes.


Conflict of interest statement

Financial disclosures: Jiaoti Huang certifies that all conflicts of interest, including specific financial interests and relationships and affiliations relevant to the subject matter or materials discussed in the manuscript (eg, employment/affiliation, grants or funding, consultancies, honoraria, stock ownership or options, expert testimony, royalties, or patents filed, received, or pending), are the following: Jiaoti Huang is a consultant for or owns shares in the following companies: Kingmed, MoreHealth, OptraScan, Genetron, Omnitura, Vetonco, York Biotechnology, Genecode, VIVA Biotech, and Sisu Pharma. None of these companies contributed to or directed any of the research reported in this article. The other authors declare that they have no competing interests.

Figures

Fig. 1
Fig. 1. Intratumoral heterogeneity in primary PCa and CRPC.
(A) Histology and IHC images: (a) Representative image of primary PCa (GS 4 + 3); (b) locally recurrent CRPC-adeno (the insert shows a higher magnification of tumor cells with nuclear features of adenocarcinoma); (c) Metastatic CRPC (mCRPC) to pelvic side wall, tumor shows classic features of CRPC-adeno; (d) locally recurrent PCa shows classic architectural and cytologic features of SCNC; (e) positive cytoplasmic staining of SCNC cells in (d) for the expression of an NE marker synaptophysin; and (f) positive nuclear staining of SCNC cells in (d) for the expression of an NE marker TTF-1. Scale bars in each panel are equal to 50 μm. (B) UMAP projection of expression profiles of 24 385 cells isolated from primary PCa and CRPC/SCNC samples. Dots represent single cells, colored by cell clusters. (C) Feature plots of cell type and lineage markers. Color represents expression level, from no expression (gray) to high level expression (dark blue). (D) UMAP view of cells colored by sample. (E) UMAP view of cells colored by lineage subtypes. Cell clusters were classified as basal, NE (in primary PCa), PSA-low and PSA-high luminal (in primary PCa), mCRPC with PSA-high, local CRPC with AR-high, SCNC, and lymphocyte. (F) UMAP view of tumor-adjacent tissue cell distribution among the cell clusters. (G) Distribution of cells isolated from tumor-adjacent tissue, PCa, and CRPC/SCNC samples among luminal clusters. AR = androgen receptor; CRPC = castration-resistant prostate cancer; GS = Gleason score; IHC = immunohistochemical; Lum = luminal; NE = neuroendocrine; PCa = prostate cancer; PSA = prostate-specific antigen; SCNC = small cell neuroendocrine carcinoma; UMAP = uniform manifold approximation and projection.
Fig. 2
Fig. 2. Subtype-specific oncogenic signaling.
(A) UMAP view of cellular pathway signaling, colored by the quartiles of signature score. (B) UMAP view of cellular gene set signature scores. Color represents signature score level, from no expression (light gray) to high level expression (red). (C) Antibody-based IHC detection of ERG rearrangement: (a) PCa1 sample, (b) PCa2 sample, and (c) PCa3 sample. Scale bars in each panel are equal to 50 μm. (D) PCa markers defined subtype differences in tumor (both PCa and CRPC cells) and tumor-adjacent tissue. Violin plot visualized cellular gene expression within a cluster. Dot represents the median score level. (E) Lineage and PCa marker defined subtype differences among the cells isolated from primary PCa samples. (F) RB inactivation status among the cells isolated from primary PCa samples. Violin plot visualized the cellular signature score within a cluster. Dot represents the median score level. AR = androgen receptor; CRPC = castration-resistant prostate cancer; IHC = immunohistochemical; PCa = prostate cancer; SYP = synaptophysin.
Fig. 3
Fig. 3. Characterization of evolutionary trajectories and CRPC-like cells in primary PCa samples.
(A) Alignment of cells along trifurcating trajectories of CRPC progression. The trajectory analysis was performed using nonbasal clusters, and only cells isolated from CRPC samples were analyzed. Dots represent single cells. Solid lines represent distinct cell trajectories defined by single-cell transcriptomes. Color represents individual cell cluster. Arrow line represents trajectory direction. (B) Bifurcating trajectories of CRPC progression through AR-dependent and AR-independent mechanisms. Both PCa and CRPC cells from nonbasal clusters were included in this analysis. (C) UMAP view of cells in C2, C8, and C12 clusters isolated from both primary PCa and CRPC/SCNC samples, colored by cell clusters. (D) UMAP view of cells in C2, C8, and C12 clusters isolated from primary PCa samples, colored by cell clusters. (E) UMAP view of cells in C2, C8, and C12 clusters, isolated from primary PCa samples, colored by primary PCa tumor and tumor-adjacent tissue. (F) Distribution of NE cells on the trajectory of SCNC progression (trajectory 1), colored by samples. Nonbasal cells from both primary PCa and CRPC/SCNC samples were analyzed. Cells from mCRPC (C2) and CRPC-adeno (C12) clusters were excluded. We determined the NE cells by visualizing which C8 cells (Supplementary Fig. 7A) were isolated from primary PCa samples. Rad arrow indicates the NE cells. (G) Distribution of CRPC-like cells on the trajectory of mCRPC progression (trajectory 2), colored by samples. Nonbasal cells from both primary PCa and CRPC/SCNC samples were analyzed. Cells from SCNC (C8) and CRPC-adeno (C12) clusters were excluded. We determined the CRPC-like cells by visualizing which C2 or C12 cells (Supplementary Fig. 7C) were isolated from primary PCa samples. Black arrow indicates the CRPC-like cells. AR = androgen receptor; CRPC = castration-resistant prostate cancer; Lum = luminal; mCRPC = metastatic CRPC; NE = neuroendocrine; PCa = prostate cancer; SCNC = small cell neuroendocrine carcinoma; UMAP = uniform manifold approximation and projection.
Fig. 4
Fig. 4. Prognosis of the CRPC-like cells related to CRPC/SCNC evolutionary signature (CRPCsig51).
(A) Association between CRPCsig51 signature and biochemical recurrence (BCR)-free survival. Kaplan-Meier estimates of BCR-free survival in 140 PCa cases obtained from GSE21034 (p < 0.001, HR = 22.10, 95% CI: 8.70, 56.13). By assessing the diagnostic ability of CRPCsig51 for local and distant metastasis (N1 or M1, AJCC stage IV), Youden’s index was selected as the cut-point for CRPCsig51-high versus CRPCsig51-low samples. Red line represents CRPCsig51-high samples and blue line represents CRPCsig51-low samples. The p values were calculated using Mantel-Cox test. (B) CRPCsig51-high was significantly associated with a higher risk of PCa disease progression (both clinical recurrence and BCR). Kaplan-Meier estimates of progression-free survival in 485 PCa cases were obtained from TCGA (p < 0.001; HR = 3.10; 95% CI: 2.10, 4.58). AJCC = American Joint Committee on Cancer; CI = confidence interval; CRPC = castration-resistant prostate cancer; HR = hazard ratio; PCa = prostate cancer; SCNC = small cell neuroendocrine carcinoma; TCGA = The Cancer Genome Atlas.
Fig. 5
Fig. 5. Distribution of CRPC-like cells in primary PCa and CRPC/mCRPC samples.
(A) Visualization of CRPC-like and NE cells in hormone-sensitive PCa samples. Representative IHC images of paired hormone-sensitive PCa slides staining with (a) TOP2A, (b) CHGA, (c) NUSAP1, (d) CHGA, (e) TOP2A, and (f) CHGA. CRPC-like cells are negative for NE marker, while NE cell is negative for CRPC-like markers. Red arrow indicates the positive staining cells. Scale bars in each panel are equal to 25 μm. (B) CRPC-like cells are highly enriched in CRPC and mCRPC samples. Representative IHC images of hormone-sensitive PCa staining with (a) TOP2A, (b) NUSAP1, and (c) PHGR1; CRPC staining with (d) TOP2A, (e) NUSAP1, and (f) PHGR1; and mCRPC staining with (g) TOP2A, (h) NUSAP1, and (i) PHGR1. Scale bars in each panel are equal to 25 μm. (C) Visualization of PCa samples with enriched CRPC-like cells in an independent dataset of 685 samples, using CRPCsig51 score, SYP expression, and the expression of eight CRPC-like cell markers. The combined dataset of 685 PCa samples was developed using nine datasets (E-TABM-26, GSE17951, GSE2443, GSE25136, GSE32269, GSE32448, GSE3325, GSE6956, and GSE8218) the gene expression profiles of which were measured using the Affymetrix U133A or U133 Plus 2.0 expression array. CRPC = castration-resistant prostate cancer; IHC = immunohistochemical; mCRPC = metastatic CRPC; Met. = metastasis; NE = neuroendocrine; PCa = prostate cancer.

Comment in

References

    1. Sharifi N, Gulley JL, Dahut WL. Androgen deprivation therapy for prostate cancer. JAMA 2005;294:238–44 - PubMed
    1. Watson PA, Arora VK, Sawyers CL. Emerging mechanisms of resistance to androgen receptor inhibitors in prostate cancer. Nat Rev Cancer 2015;15:701–11. - PMC - PubMed
    1. Ku SY, Rosario S, Wang Y, et al. Rb1 and Trp53 cooperate to suppress prostate cancer lineage plasticity, metastasis, and antiandrogen resistance. Science 2017;355:78–83. - PMC - PubMed
    1. Mu P, Zhang Z, Benelli M, et al. SOX2 promotes lineage plasticity and antiandrogen resistance in. Science 2017;355:84–8. - PMC - PubMed
    1. Karthaus WR, Hofree M, Choi D, et al. Regenerative potential of prostate luminal cells revealed by single-cell analysis. Science 2020;368:497–505. - PMC - PubMed

Publication types

MeSH terms