. 2022 Jan;10(1):e004034.
doi: 10.1136/jitc-2021-004034.

Checkpoint blockade-induced CD8+ T cell differentiation in head and neck cancer responders

Affiliations

Checkpoint blockade-induced CD8+ T cell differentiation in head and neck cancer responders

Liye Zhou et al. J Immunother Cancer. 2022 Jan.

Abstract

Background: Immune checkpoint blockade (ICB) response in recurrent/metastatic head and neck squamous cell carcinoma (HNSCC) is limited to 15%-20% of patients and underpinnings of resistance remain undefined.

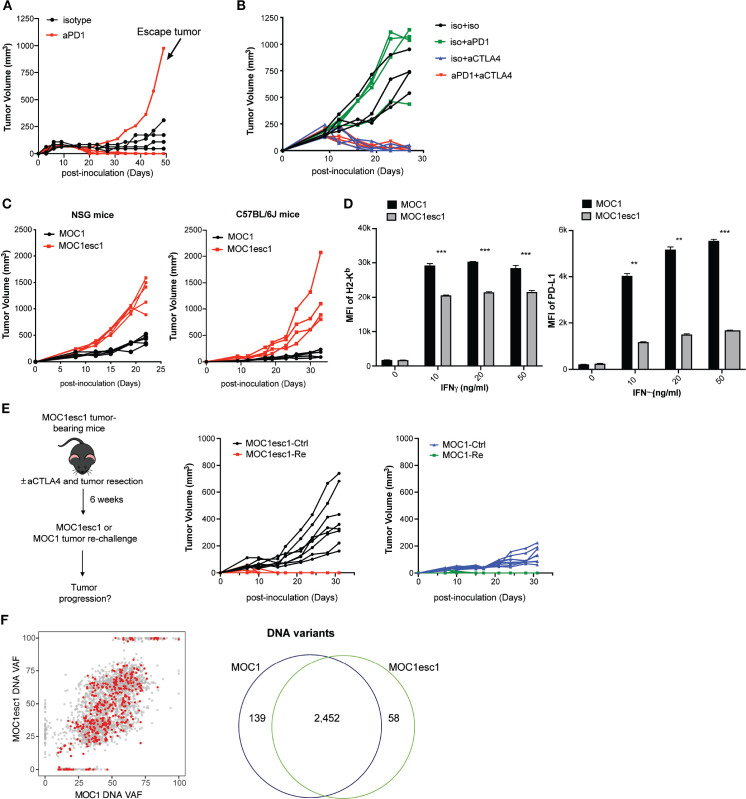
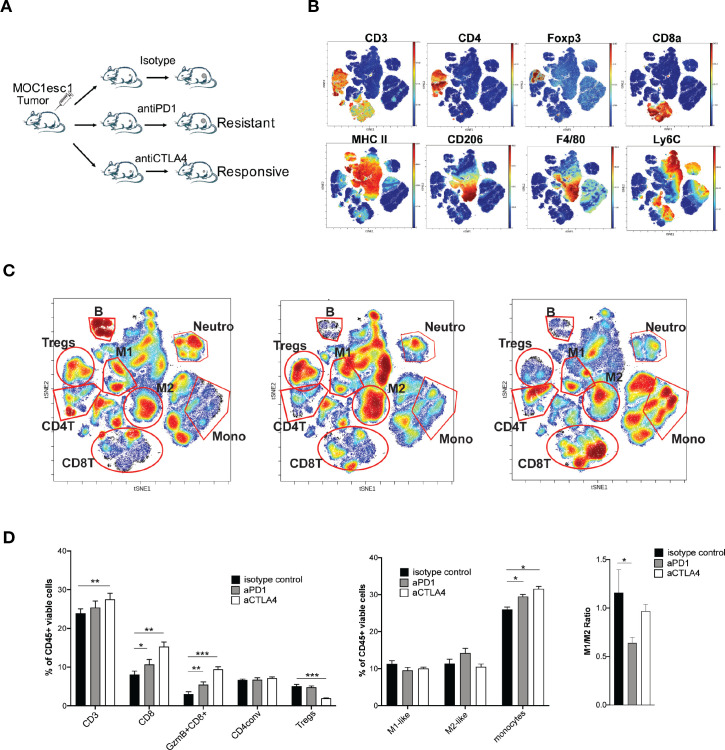
Methods: Starting with an anti-PD1 sensitive murine HNSCC cell line, we generated an isogenic anti-PD1 resistant model. Mass cytometry was used to delineate tumor microenvironments of both sensitive parental murine oral carcinoma (MOC1) and resistant MOC1esc1 tumors. To examine heterogeneity and clonal dynamics of tumor infiltrating lymphocytes (TILs), we applied paired single-cell RNA and TCR sequencing in three HNSCC models.

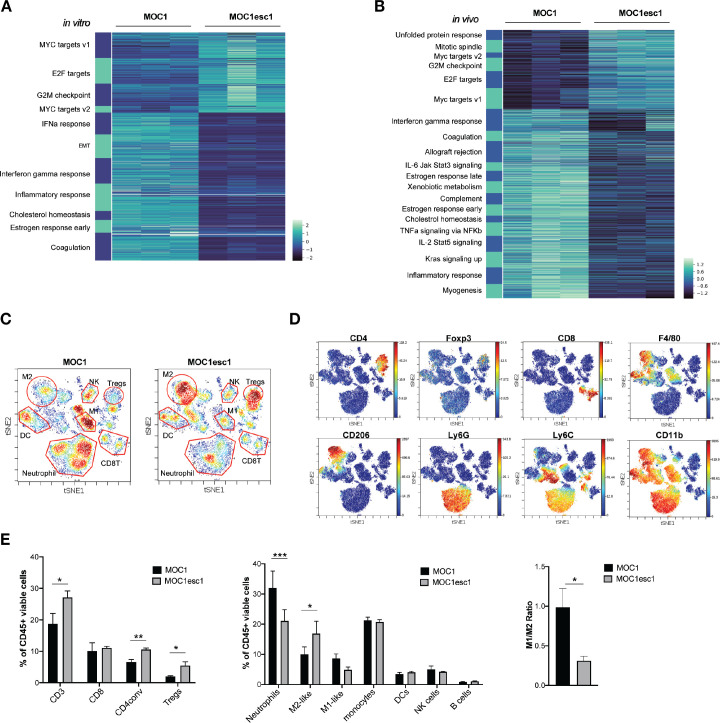
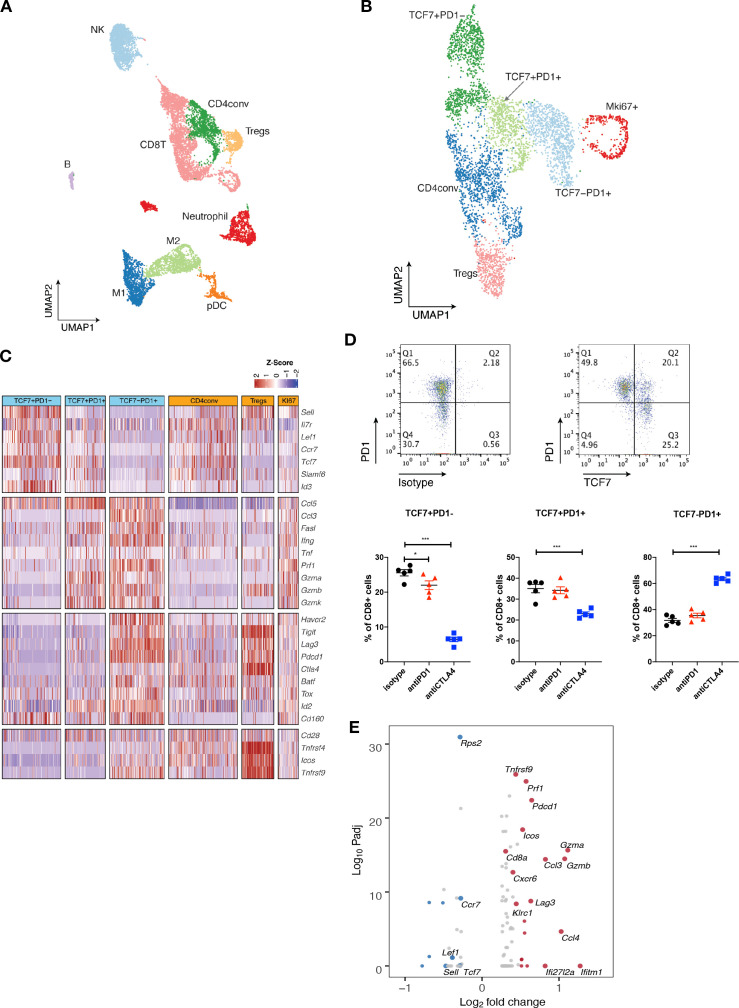
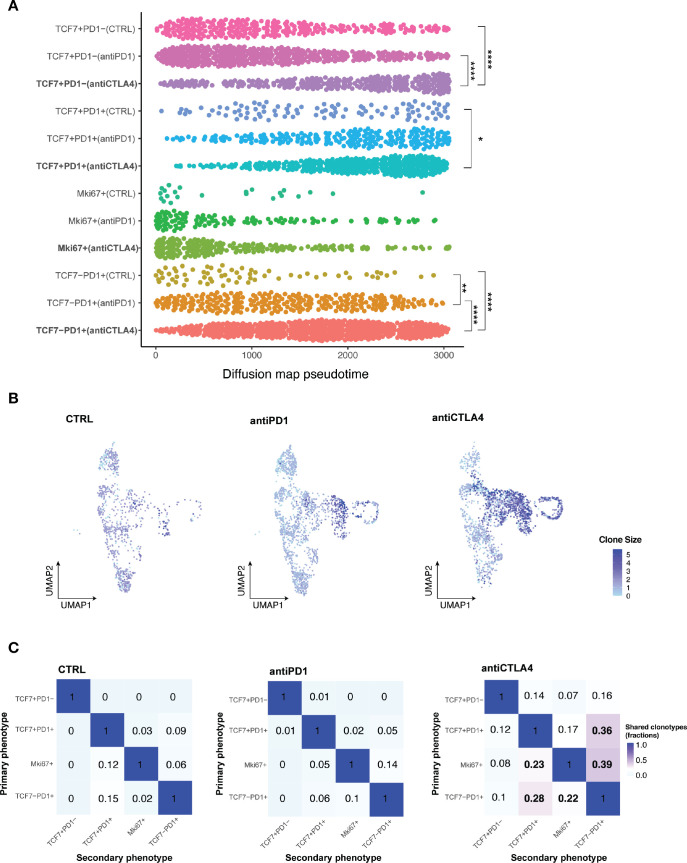
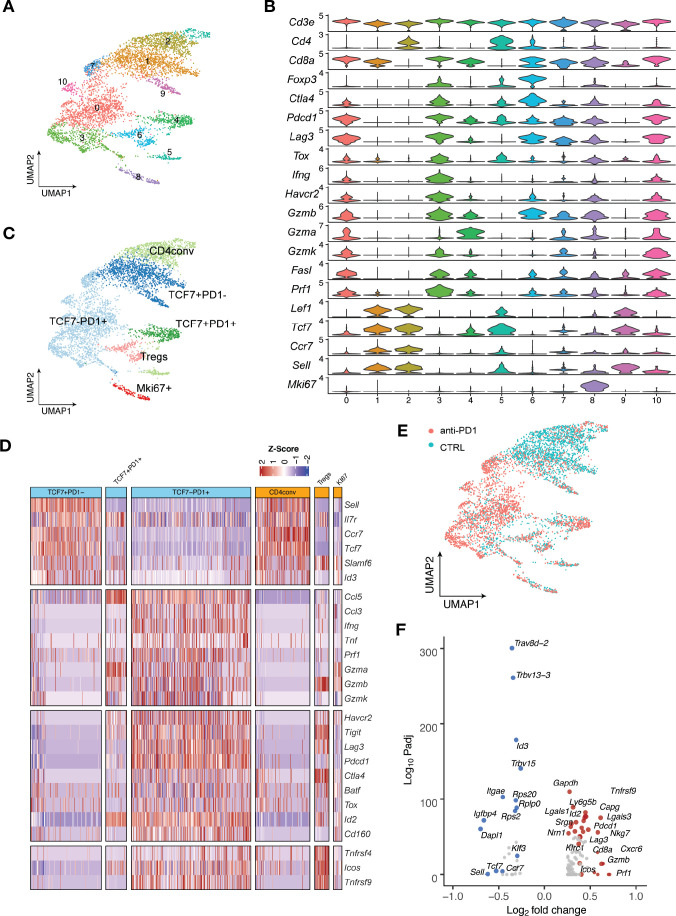
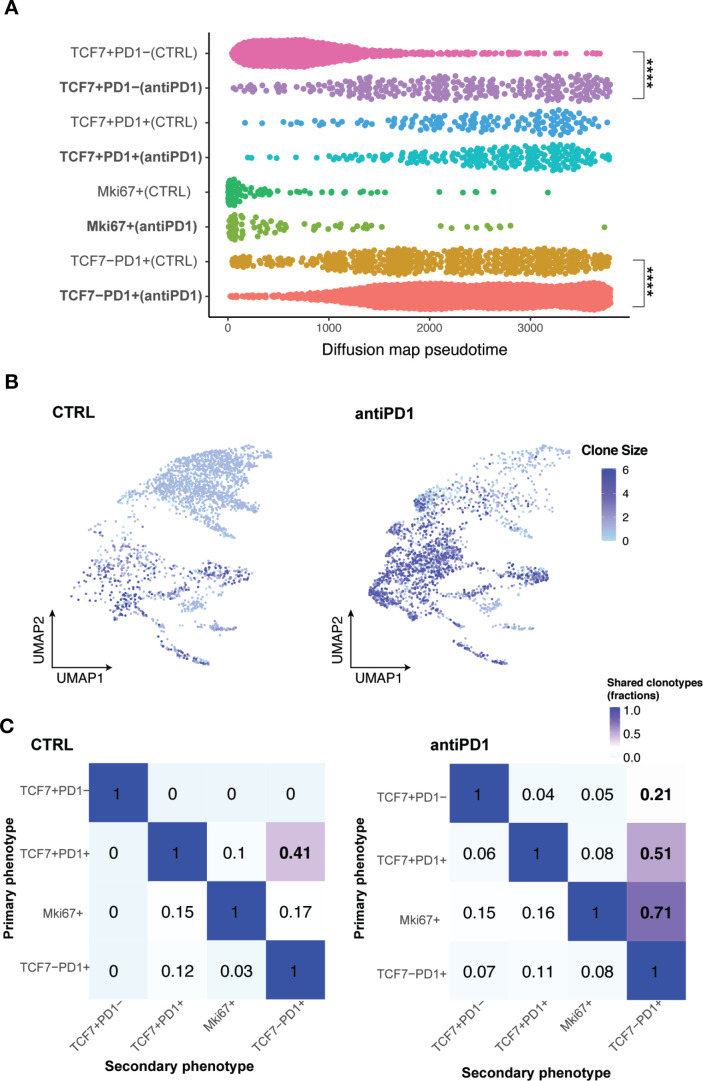
Results: Anti-PD1 resistant MOC1esc1 line displayed a conserved cell intrinsic immune evasion signature. Immunoprofiling showed distinct baseline tumor microenvironments of MOC1 and MOC1esc1, as well as the remodeling of immune compartments on ICB in MOC1esc1 tumors. Single cell sequencing analysis identified several CD8 +TIL subsets including Tcf7 +Pd1- (naïve/memory-like), Tcf7 +Pd1+ (progenitor), and Tcf7-Pd1+ (differentiated effector). Mapping TCR shared fractions identified that successful anti-PD1 or anti-CTLA4 therapy-induced higher post-treatment T cell lineage transitions.

Conclusions: These data highlight critical aspects of CD8 +TIL heterogeneity and differentiation and suggest facilitation of CD8 +TIL differentiation as a strategy to improve HNSCC ICB response.

Keywords: head and neck neoplasms; lymphocytes; tumor microenvironment; tumor-infiltrating.


Conflict of interest statement

Competing interests: RU serves on a Merck head and neck cancer advisory board. The MOC models developed by RU have been filed with the Washington University Office of Technology Management and are licensed for distribution by Kerafast. XSL is a cofounder, board member and Scientific Advisor of GV20 Oncotherapy, and on the Scientific Advisory Board of 3DMed Care. JS receives research support from Merck, BMS, Regeneron, Debiopharm, consulting/Scientific Advisory Board/travel fees from Genentech, Immunitas, Debiopharm, BMS, Nanobiotix, Tilos, AstraZeneca, LEK, Catenion, ACI Clinical, Astellas, Stimit., has stock options in Immunitas and equity in Doximity. RH consults for BMS, Merck, AstraZeneca, Pfizer, GSK, Genentech, Celgene, and Bayer, and received esearch Support from GSK, Merck, BMS, Pfizer, AstraZeneca, Genentech, and Kura.

Figures

Figure 1
Figure 1
A carcinogen-induced HNSCC model, MOC1, displays adaptive resistance to anti-PD1. (A) MOC1 anti-PD1 sensitivity and escape tumor growth. MOC1 bearing C57BL/6 mice were treated with anti-PD1 or isotype control on days 3, 6 and 9 (n=4–5 each group). This experiment was repeated two times. The indicated escape tumor was harvested and cultured to generate polyclonal MOC1esc1. (B) C57BL/6 mice bearing MOC1esc1 tumors were resistant to anti-PD1, but sensitive to anti-CTLA4 therapy (n=4 per group). (C) Growth curves of MOC1 and MOC1esc1 tumors in immunodeficient NSG or immunocompetent C57BL/6 mice (n=4 per group). (D) Cell surface protein levels of H2-Kb and PD-L1 on MOC1 and MOC1esc1 treated with indicated IFNγ concentrations for 48 hours were measured by flow cytometry (**p<0.01, ***p<0.001). Significance was calculated by unpaired Student’s t-test. Data are shown as Mean±SD, n=3 per group. (E) Tumor rechallenge studies. C57BL/6 mice implanted with MOC1esc1 tumors were cured of tumor with anti-CTLA4 (50%) and surgical resection as needed (50%) of any residual or growing tumors. After 6 weeks of rest, tumor free mice were rechallenged with parental MOC1 or MOC1esc1 lines and monitored for tumor growth. Age-matched naive C57BL/6 mice were implanted with MOC1 or MOC1esc1 as control groups. n=6–8 per group. (F) Clonality plots comparing variant allele frequency (VAF) of single nucleotide variants (SNVs) in MOC1 and MOC1esc1 lines, with red dots representing predicted neoantigens. Venn diagram showing the numbers of SNVs in MOC1 and MOC1esc1 lines. HNSCC, head and neck squamous cell carcinoma; MOC1, murine oral carcinoma.
Figure 2
Figure 2
MOC1esc1 tumors are highly infiltrated by Tregs and M2-like TAMs. (A) In vitro RNA-seq analysis revealed distinct transcriptomic changes between MOC1 and MOC1esc1 lines. Enriched hallmark gene sets are shown by heatmap of gene mRNA expression levels. All gene sets were enriched with FDR<0.001. (B) RNA-seq analysis of MOC1 and MOC1esc1 bulk tumor samples from day 14 after implantation (N=3 per group). Hallmark gene sets enriched for upregulated and downregulated mRNAs were visualized using mRNA expression value heatmaps. All gene sets were enriched with FDR<0.001 between MOC1 and MOC1esc1 tumors ranked by normalized enrichment score. (C) Immune profiling of MOC1 and MOC1esc1 TME in treatment naïve tumors using mass cytometry. Tumors were harvested on day 14 after implantation and stained with a 37-marker antibody panel. Density viSNE plots were used to visualize an even number of CD45 +cells from MOC1 or MOC1esc1 tumors. (D) ViSNE plots of tumor infiltrating CD45 +cells overlaid with the expression of selected markers. (E) Frequency within CD45 +cells of major immune cell compartments in treatment naïve MOC1 and MOC1esc1 TME. The percentage of CD45 +live cells in each condition is: MOC1:88.3±5.8%, MOC1esc1: 77±5.8%. (*P<0.05, **p<0.01, ***p<0.001. Significance was calculated by unpaired Student’s t-test. Data are shown as mean±SEM, N=4 per group). DC, dendritic cell; FDR, false discovery rates; MOC1, murine oral carcinoma; ViSNE: visual stochastic network embedding; TAMs, tumor-associated macrophage.
Figure 3
Figure 3
Tregs and M2-like TAMs contribute to MOC1esc1 anti-PD1 resistance. (A) Schematic of MOC1esc1 tumor bearing mice treatment and analysis. MOC1esc1-bearing mice were treated with isotype control, anti-PD1, or anti-CTLA4 monoclonal antibodies on days 3, 6, 9 after tumor implantation. Tumors were harvested on day 12 and subsequently analyzed by a 37-marker panel using CyTOF. (B) ViSNE plots of tumor infiltrating CD45 +cells overlaid with the expression of selected markers. T cells: CD3+, CD8 +T cells: CD3 +CD8+, GzmB +CD8+T cells: CD3 +CD8+GzmB+, Tregs: CD3 +CD4+Foxp3+, CD4conv: CD3 +CD4+Foxp3-, B cells: CD19+, NK cells: NK1.1+, M2-like macrophage: CD11b+F4/80+Ly6C-Ly6G-CD206+, M1-like macrophage: CD11b+F4/80+Ly6C-Ly6G-CD206-, Neutrophils: CD11c-CD11b+Ly6G+, Monocytes: CD11c-CD11b+Ly6G-Ly6C+. (C) Profiling of MOC1esc1 TME under indicated treatments gated on CD45 +cells. Density viSNE plots were used to visualize an even number of CD45 +cells from three indicated treatment groups. Selected major immune populations were labeled. (D) Frequency of major immune compartments in MOC1esc1 tumors under different treatment conditions. The percentage of CD45 +live cells in each condition is: isotype control: 88.2±3.1%, anti-PD1:87.4±1.3%, anti-CTLA4:89.9±2%. (*P<0.05, **p<0.01, ***p<0.001. Significance was calculated by one-way ANOVA. Data are shown as mean±SEM, n=5 mice per group). ANOVA, analysis of variance; MOC1, murine oral carcinoma; TAMs, tumor-associated macrophages; TME, tumor microenvironment.
Figure 4
Figure 4
Single-cell RNA-seq analysis defines distinct subsets of CD8 TILs. (A) UMAP of scRNA-seq results of total tumor infiltrating CD45 +cells pooled from different treatment groups. Tumor infiltrating CD45 +cells from 5 mice in the same treatment group were pooled and subjected to single cell sequencing. (B) UMAP of total T cells in MOC1esc1 tumors colored by indicated major subsets. T cells from all three conditions were pooled for clustering analysis. (C) Heatmap illustrating the relative gene expression levels of genes in major T cell subsets in MOC1esc1 tumors. (D) Tcf7 +Pd1−, Tcf7 +Pd1+, and Tcf7-Pd1+CD8+T cells in MOC1esc1 tumors were detected by flow cytometry. Dot plot was pre-gated on live CD8 +T cells. Percentages of CD8 +subsets in MOC1esc1 tumors at indicated treatment condition are shown. MOC1esc1 tumors treated with isotype control, anti-PD1, or anti-CTLA4 were harvested at day 12 postinoculation and analyzed by flow cytometry for CD8 +T cell subset distribution (*p<0.05, ***p<0.001). Significance was calculated by one-way ANOVA. Data are shown as mean±SEM, n=5 mice per group.) (E) Pseudo-bulk differential expression analysis was performed in total CD8 +T cells between responder (anti-CTLA4) and control MOC1esc1 tumors. Colors of dots represent the anti-CTLA4 treated MOC1esc1 infiltrating CD8 +T cell upregulated genes (red) and downregulated genes (blue) compared with control. The statistical significance (log10 FDR) was plotted against the log2 fold-change of gene expression levels. ANOVA, analysis of variance; FDR, false discovery rates; MOC1, murine oral carcinoma; TILs, tumor infiltrating lymphocytes; UMAP, uniform manifold approximation and projection.
Figure 5
Figure 5
Subsets of CD8 +TILs differentially respond to ICB. (A) Diffusion pseudotime of indicated CD8 +T cell major subsets in distinct treatment conditions. (*P<0.05, **p<0.01, ***p<0.001, ****p<0.0001). Significance was calculated by one-way ANOVA.) (B) Heatmap of TCR clone size. Cells were colored by TCR clone size on a log2 scale in the UMAP of T cells in indicated conditions of MOC1esc1 tumors. (C) Shared fraction analysis heatmaps of TCR clonotypes between primary and secondary phenotypes in indicated conditions of MOC1esc1 tumors. ANOVA, analysis of variance; ICB, immune checkpoint blockade; MOC1, murine oral carcinoma; TILs, tumor infiltrating lymphocytes; UMAP, uniform manifold approximation and projection.
Figure 6
Figure 6
Major TIL subsets and the transcriptomic dynamics in MOC22 tumors with anti-PD1 treatment. A total of 5, 548 T cells were sequenced in MOC22 tumors treated with isotype control or anti-PD1. T cells from five mice in each treatment group were pooled and subjected to single cell sequencing. (A) UMAP of T cells in MOC22 tumors colored by individual clusters. (B) Violin plots showing expression of selected immune cell marker genes across clusters. The y axis represents the normalized gene expression levels. (C) UMAP of total T cells in MOC22 tumors colored by indicated major subsets. T cells from both conditions were pooled for clustering analysis. (D) Heatmap illustrating the relative gene expression levels of genes in major T cell subsets in MOC22 tumors. (E) UMAP of T cells in MOC22 tumors colored by treatment conditions. (F) Pseudobulk differential expression analysis was performed in total CD8 +T cells between anti-PD1 and isotype control treated MOC22 tumors. The results were presented by a color-coded volcano plot. The statistical significance (log10 FDR) was plotted against the log2 fold-change of gene expression levels. Each dot represents one gene, which is color coded by the most highly enriched genes. FDR, false discovery rates; MOC, murine oral carcinoma; TIL, tumor infiltrating lymphocytes.
Figure 7
Figure 7
TCR-based lineage tracing showing CD8 +TILs differentiation in MOC22 tumors with anti-PD1 treatment. (A) Diffusion pseudotime of indicated CD8 +T cell subsets in different treatment conditions. ****p<0.0001. Significance was calculated by two-tailed Student’s t-test.) (B) Heatmap of TCR clone size in MOC22 tumors. Cells were colored by TCR clone size on a log2 scale in the UMAP of T cells in indicated conditions. (C) Shared fraction analysis heatmaps of TCR clonotypes between primary and secondary phenotypes in indicated conditions of MOC22. MOC, murine oral carcinoma; TILs, tumor infiltrating lymphocytes.

Similar articles

Cited by

References

    1. Ferris RL, Blumenschein G, Fayette J, et al. . Nivolumab for recurrent squamous-cell carcinoma of the head and neck. N Engl J Med Overseas Ed 2016;375:1856–67. 10.1056/NEJMoa1602252 - DOI - PMC - PubMed
    1. Burtness B, Harrington KJ, Greil R, et al. . Pembrolizumab alone or with chemotherapy versus cetuximab with chemotherapy for recurrent or metastatic squamous cell carcinoma of the head and neck (KEYNOTE-048): a randomised, open-label, phase 3 study. Lancet 2019;394:1915–28. 10.1016/S0140-6736(19)32591-7 - DOI - PubMed
    1. Van Allen EM, Miao D, Schilling B, et al. . Genomic correlates of response to CTLA-4 blockade in metastatic melanoma. Science 2015;350:207–11. 10.1126/science.aad0095 - DOI - PMC - PubMed
    1. Hugo W, Zaretsky JM, Sun L, et al. . Genomic and transcriptomic features of response to anti-PD-1 therapy in metastatic melanoma. Cell 2016;165:35–44. 10.1016/j.cell.2016.02.065 - DOI - PMC - PubMed
    1. Rosenberg JE, Hoffman-Censits J, Powles T, et al. . Atezolizumab in patients with locally advanced and metastatic urothelial carcinoma who have progressed following treatment with platinum-based chemotherapy: a single-arm, multicentre, phase 2 trial. Lancet 2016;387:1909–20. 10.1016/S0140-6736(16)00561-4 - DOI - PMC - PubMed

Publication types

Substances