. 2022 Jan 25;119(4):e2117137119.
doi: 10.1073/pnas.2117137119.

Remodeling of lateral geniculate nucleus projections to extrastriate area MT following long-term lesions of striate cortex

Affiliations

Remodeling of lateral geniculate nucleus projections to extrastriate area MT following long-term lesions of striate cortex

Nafiseh Atapour et al. Proc Natl Acad Sci U S A. .

Abstract

Here, we report on a previously unknown form of thalamocortical plasticity observed following lesions of the primary visual area (V1) in marmoset monkeys. In primates, lateral geniculate nucleus (LGN) neurons form parallel pathways to the cortex, which are characterized by the expression of different calcium-binding proteins. LGN projections to the middle temporal (MT) area only originate in the koniocellular layers, where many neurons express calbindin. In contrast, projections to V1 also originate in the magnocellular and parvocellular layers, where neurons express parvalbumin but not calbindin. Our results demonstrate that this specificity is disrupted following long-term (1 to 3 y) unilateral V1 lesions, indicating active rearrangement of the geniculocortical circuit. In lesioned animals, retrograde tracing revealed MT-projecting neurons scattered throughout the lesion projection zone (LPZ, the sector of the LGN that underwent retrograde degeneration following a V1 lesion). Many of the MT-projecting neurons had large cell bodies and were located outside the koniocellular layers. Furthermore, we found that a large percentage of magno- and parvocellular neurons expressed calbindin in addition to the expected parvalbumin expression and that this coexpression was present in many of the MT-projecting neurons within the LPZ. These results demonstrate that V1 lesions trigger neurochemical and structural remodeling of the geniculo-extrastriate pathway, leading to the emergence of nonkoniocellular input to MT. This has potential implications for our understanding of the neurobiological bases of the residual visual abilities that survive V1 lesions, including motion perception and blindsight, and reveals targets for rehabilitation strategies to ameliorate the consequences of cortical blindness.

Keywords: blindsight; brain plasticity; extrastriate cortex; primate; striate cortex lesion.


Conflict of interest statement

The authors declare no competing interest.

Figures

Fig. 1.
Fig. 1.
Neurons retrogradely labeled by tracer injection in area MT concentrate in the LPZ. Each panel shows a low-power view of a coronal section through the marmoset LGN. (Scale bar, 500 µm.) (A and B) Adult lesion case (WA18). (C and D) Case with lesion incurred at 6 wk of age (W6I). The dashed lines indicate the borders of the LPZs, where the majority of neurons had undergone retrograde degeneration (4). In all panels, large FB-labeled neurons are visible, which collectively span the dorsoventral axis of LGN within the degenerated area. White and yellow arrows point to examples of MT-projecting neurons within and outside the LPZ, respectively.
Fig. 2.
Fig. 2.
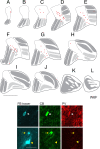
Localization and neurochemistry of MT-projecting LGN neurons in an animal with V1 lesions. AL are drawings of equally spaced coronal sections spanning from the caudal (A) to the rostral (L) poles of the LGN in case W6F. (Scale bar, 1 mm.) In these drawings, dotted lines designate the approximate borders of the LPZ, dark and light gray indicate parvo- and magnocellular layers outside the LPZ, and red circles show the locations of neurons retrogradely labeled with FB. MT-projecting neurons collectively span the entire dorsoventral extent of the LPZ. (Bottom) Confocal images of neurons sampled from F (boxed area) showing the tracer FB and immunoreactivity to CB and PV. White arrows point to a neuron expressing both CB and PV; yellow arrows point to a neuron expressing CB only, and yellow arrowheads point to a neuron with no immunoreactivity to either CB or PV. (Scale bar, 50 µm.)
Fig. 3.
Fig. 3.
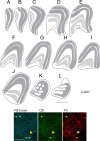
Localization and neurochemistry of MT-projecting neurons in the LGN of a nonlesioned animal. AL are drawings of equally spaced coronal sections spanning from the caudal (A) to the rostral (L) poles of the LGN in case CJ207. (Scale bar, 1 mm.) Conventions as in Fig. 2. All MT-projecting neurons are localized within K layers. (Bottom) Confocal images of neurons sampled from E (boxed area) showing the tracer FB and immunoreactivity to CB and PV. Yellow arrows point to neurons expressing only CB and the yellow arrowheads to a neuron with no immunopositivity to either CB or PV. (Scale bar, 100 µm.)
Fig. 4.
Fig. 4.
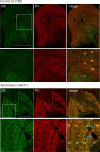
Unexpected expression of CB in the M and P layers of the LGN. (Top) LGN of a normal adult animal (CJ185). (Bottom) LGN of an animal (WA11) with V1 lesion in adulthood, with the dashed line indicating the LPZ. In both cases, the boxed area in the CB-stained images (Left) are shown in higher magnification. In the bottom row, blue arrows point to examples of M neurons with colocalized expression of CB and PV, which are only visible in lesioned cases. Other abbreviations: K1 through K4: koniocellular layers; ME: magnocellular external layer; MI: magnocellular internal layer; PE: parvocellular external layer; PI: parvocellular internal layer. (Scale bar, 1 mm.)
Fig. 5.
Fig. 5.
Quantification of CB expression in the LGN following V1 lesions. Data obtained from the LGN ipsilateral to the lesion are from regions outside the LPZ. All quantification is based on three animals with best staining in each group. (A) Percentage of CB+ (CB-expressing) M and P neurons in the LGN for each animal. In control animals (CON), only one LGN was evaluated. The asterisk indicates unavailability of data from the LGN contralateral to the lesion in case WA11. (B) Mean ± SEM percentage of CB-expressing M and P neurons in the LGN of V1-lesioned animals. (C) Data from both hemispheres (in B) are pooled to indicate coexpression in M and P neurons separately. In B and C, individual points show the mean of data for each animal across multiple sections. (D) Percentage CB expression in the M neurons of contralateral LGN as a function of postlesion survival. (E) Ratio of the percentages of CB-expression in M and P neurons in the LGNs contralateral and ipsilateral to the lesion as a function of postlesion survival.
Fig. 6.
Fig. 6.
Coexpression of CB and PV in surviving LGN neurons of the LPZ. (A) Immunostaining for CB and PV in WA13 (adult lesion) and W6G (neonatal lesion). White dashed borders highlight neurons expressing only CB, fitting to the K neurons. Arrows point to examples of surviving neurons coexpressing CB and PV, which are putative M and P neurons. Layer abbreviations are as in Fig. 4. (Scale bar, 100 µm.) (B) Percentage of neurons coexpressing CB and PV (CB+/PV+) among the population of CB-expressing (CB+) neurons in the LPZ. (C) CB+ neurons in the LPZ expressed as percentage of all surviving neurons labeled by NeuN. In B and C, individual points show the mean of data across several sections for each animal. Mean ± SEM; *P < 0.05.
Fig. 7.
Fig. 7.
Magnocellular neurons project to the area MT following V1 lesions. Confocal images of parts of LGN containing tracer-labeled neurons located within M layers in two adult lesion cases (Top: WA13, Middle: WA15) and one neonatal lesion case (Bottom: W6J). Three representative neurons, shown in higher magnification, coexpress CB and PV. (Top) An FB-traced neuron located within the magnocellular internal (MI) layer. (Middle) An FB-traced neuron located within the magnocellular external (ME) layer. (Bottom) A DY-labeled neuron within the MI layer. (Scale bars, Top and Middle, 0.5 mm; Bottom, 100 µm.) Layer abbreviations are as in Fig. 4.
Fig. 8.
Fig. 8.
Quantification of MT-projecting neurons in the LGN following V1 lesions. (A) Number and neurochemical identity of MT-projecting neurons in the LGN of different animals. (B) Mean ± SEM of the percentages of MT-projecting neurons in the LGN of control, neonatal V1 lesion, and adult V1 lesion animals classified as CB-only expressing (CB+), CB and PV coexpressing (CB+ and PV+), or those expressing neither protein. (C) Mean ± SEM of the number of MT-projecting neurons in the LGN of control and lesioned animals, normalized as the percentage of the number of tracer-labeled neurons in the thalamic intralaminar nuclei. (D) Correlation between the number of MT-projecting neurons in LGN and V1 lesion size (estimated by the reduction in the volume of the ipsilesional LGN relative to the contralesional LGN).

References

    1. Horton J. C., Hoyt W. F., The representation of the visual field in human striate cortex. A revision of the classic Holmes map. Arch. Ophthalmol. 109, 816–824 (1991). - PubMed
    1. Vanburen J. M., Trans-synaptic retrograde degeneration in the visual system of primates. J. Neurol. Neurosurg. Psychiatry 26, 402–409 (1963). - PMC - PubMed
    1. Cowey A., Stoerig P., Projection patterns of surviving neurons in the dorsal lateral geniculate nucleus following discrete lesions of striate cortex: Implications for residual vision. Exp. Brain Res. 75, 631–638 (1989). - PubMed
    1. Atapour N., Worthy K. H., Lui L. L., Yu H. H., Rosa M. G. P., Neuronal degeneration in the dorsal lateral geniculate nucleus following lesions of primary visual cortex: Comparison of young adult and geriatric marmoset monkeys. Brain Struct. Funct. 222, 3283–3293 (2017). - PubMed
    1. Atapour N., Worthy K. H., Rosa M. G. P., Neurochemical changes in the primate lateral geniculate nucleus following lesions of striate cortex in infancy and adulthood: Implications for residual vision and blindsight. Brain Struct. Funct. 226, 2763–2775 (2021). - PubMed