. 2022 Jan 20;11(1):20.
doi: 10.1038/s41377-021-00707-2.

Nanoscale mapping of optically inaccessible bound-states-in-the-continuum

Affiliations

Nanoscale mapping of optically inaccessible bound-states-in-the-continuum

Zhaogang Dong et al. Light Sci Appl. .

Abstract

Bound-states-in-the-continuum (BIC) is an emerging concept in nanophotonics with potential impact in applications, such as hyperspectral imaging, mirror-less lasing, and nonlinear harmonic generation. As true BIC modes are non-radiative, they cannot be excited by using propagating light to investigate their optical characteristics. In this paper, for the 1st time, we map out the strong near-field localization of the true BIC resonance on arrays of silicon nanoantennas, via electron energy loss spectroscopy with a sub-1-nm electron beam. By systematically breaking the designed antenna symmetry, emissive quasi-BIC resonances become visible. This gives a unique experimental tool to determine the coherent interaction length, which we show to require at least six neighboring antenna elements. More importantly, we demonstrate that quasi-BIC resonances are able to enhance localized light emission via the Purcell effect by at least 60 times, as compared to unpatterned silicon. This work is expected to enable practical applications of designed, ultra-compact BIC antennas such as for the controlled, localized excitation of quantum emitters.


Conflict of interest statement

The authors declare no competing interests.

Figures

Fig. 1
Fig. 1. Experimental setup for exciting and probing bound-states-in-the-continuum (BIC) modes via a sub-1-nm electron beam.
a Schematic of the experimental setup in a STEM where a high-energy electron beam focused to ~1 nm is used to probe an array of Si nanoantennas on a 30-nm thick suspended Si3N4 membrane. Complementary measurements of the energy lost by electrons, and energy of emitted photons result in EELS and CL spectra respectively. b Bright-field STEM image of an amorphous Si nanoantenna array supporting quasi-BIC modes on a 30-nm-thick Si3N4 membrane. “True” BIC occurs when θ=90
Fig. 2
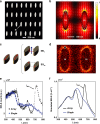
Fig. 2. Probing of a “true” BIC resonance mode by Electron Energy Loss Spectroscopy.
a STEM annular dark-field image of a silicon nanoantenna array with elliptic cylinders aligned at a tilt angle θ = 90°. b Simulated near-field mode pattern of the “true” BIC mode, with arrows indicating the electric field direction; their length being proportional to the amplitude. c Schematic of the multipole moments comprising the “true” BIC mode: the z-polarized magnetic dipole (MDz) and the electric quadrupole (EQxy). d Experimental EELS map of the elliptic cylinder nanoantenna array with the “true” BIC mode resembling the E-field maps in (b). e EELS spectrum (black color) as measured at the position near the tip of the ellipse as indicated in (d) demonstrating the excitation of the “true” BIC mode. For benchmarking, the EELS spectrum measured from an isolated single antenna element of the same size (blue color) clearly shows the missing peak associated with the BIC mode. More information about the single antenna measurements can be found in the Fig. S3. f FEM-simulated EELS spectra for the nanoantenna array (black), showing a BIC resonance, and for a single antenna element (blue), showing no BIC resonance
Fig. 3
Fig. 3. Evolution of CL and EELS spectra for nanoantenna arrays with different tilt angles.
a Measured EELS spectra, b reflectance spectra under x-polarized incidence condition, and c CL spectra from the nanoantenna array with different tilt angle θ of 90°, 80°, and 70°. d Spatial distribution of the electric field |E| at the quasi-BIC resonance at ~720 nm for the nanoantenna array with a tilt angle θ of 70°. The arrows denote the electric field direction, the length of the arrows being proportional to the amplitude. e Multipolar decomposition of the scattering cross-section (SCS) and corresponding schematics of the multipoles excited at the quasi-BIC mode
Fig. 4
Fig. 4. Characterizing the coherent interaction length of the quasi-BIC resonance in a Si nanoantenna array with a tilt angle θ of 70°.
a STEM HAADF image, showing the corner of a fabricated Si nanoantenna array with 130 × 130 elements. The white dotted rectangle highlights the area used for the CL mapping experiment and the colored dots denote the measurement positions for investigating the CL spectrum evolution. b CL intensity map at 722 nm, the quasi-BIC resonance wavelength; note the lower emission closer to the array edge. The wavelength bandwidth for the CL integration is 17 nm. c CL spectra from the “tip” position and “middle” position of one selected antenna as highlighted by the white dashed line in (b). The 722 nm emission at the “tip” position is strongly enhanced due to the quasi-BIC resonance. The CL spectrum as measured from un-patterned 90-nm-thick Si film is plotted in gray for benchmarking. d Evolution of the measured CL emission spectra when going from the array edge towards the array center. It shows that the quasi-BIC resonance requires the presence of neighboring array antennas. e, f CL maps at the Mie resonance wavelengths of the individual antennas (e) 522 nm and (f) 614 nm; note the uniform emission all the way to the array edge. g Simulations of the CL spectrum evolution

References

    1. von Neumann J, Wigner EP. Über merkwürdige diskrete Eigenwerte. Physikalische Z. 1929;30:465–467.
    1. Capasso F, et al. Observation of an electronic bound state above a potential well. Nature. 1992;358:565–567.
    1. Herrick DR. Construction of bound states in the continuum for epitaxial heterostructure superlattices. Phys. B+C. 1976;85:44–50.
    1. Stillinger FH. Potentials supporting positive-energy eigenstates and their application to semiconductor heterostructures. Phys. B+C. 1976;85:270–276.
    1. Parker R. Resonance effects in wake shedding from parallel plates: some experimental observations. J. Sound Vib. 1966;4:62–72.