. 2022 Jan 20;13(1):427.
doi: 10.1038/s41467-021-27683-w.

Macrophages in epididymal adipose tissue secrete osteopontin to regulate bone homeostasis

Affiliations

Macrophages in epididymal adipose tissue secrete osteopontin to regulate bone homeostasis

Bingyang Dai et al. Nat Commun. .

Abstract

Epididymal white adipose tissue (eWAT) secretes an array of cytokines to regulate the metabolism of organs and tissues in high-fat diet (HFD)-induced obesity, but its effects on bone metabolism are not well understood. Here, we report that macrophages in eWAT are a main source of osteopontin, which selectively circulates to the bone marrow and promotes the degradation of the bone matrix by activating osteoclasts, as well as modulating bone marrow-derived macrophages (BMDMs) to engulf the lipid droplets released from adipocytes in the bone marrow of mice. However, the lactate accumulation induced by osteopontin regulation blocks both lipolysis and osteoclastogenesis in BMDMs by limiting the energy regeneration by ATP6V0d2 in lysosomes. Both surgical removal of eWAT and local injection of either clodronate liposomes (for depleting macrophages) or osteopontin-neutralizing antibody show comparable amelioration of HFD-induced bone loss in mice. These results provide an avenue for developing therapeutic strategies to mitigate obesity-related bone disorders.


Conflict of interest statement

The authors declare no competing interests.

Figures

Fig. 1
Fig. 1. A high-fat diet induces alterations of adipose tissue and trabecular bone.
a Comparison of the body weight between NFD- and HFD-fed mice (n = 5 biologically independent samples). b Quantification of the mass of eWAT (n = 5 biologically independent samples) and iWAT (n = 5 biologically independent samples) of the NFD- and HFD-fed groups. c Representative μCT images (left) and quantification (right, n = 4 biologically independent samples) of rBMAT in the proximal tibiae of the NFD- and HFD-fed groups at the indicated time points. Scale bar: 500 μm. d Representative μCT images (left) and quantification of bone mass in proximal tibiae (right, n = 5 biologically independent samples). Scale bar: 500 μm. e Linear regression analysis of the BV/TV and body weight in HFD-fed mice (n = 17 biologically independent samples). f ITTs were performed at weeks 6, 8, and 12 in the NFD- and HFD-fed groups (n = 5 biologically independent samples). Images are representative of 3 independent experiments. All data are presented as mean ± SD. Two-way ANOVA with Sidak’s post-hoc test (ad and f) were used. Source data are provided as a Source Data file.
Fig. 2
Fig. 2. A high-fat diet induces inflammation in eWAT.
a Representative H&E staining (left) and quantification of CLS area percentage (right, n = 4) of eWAT from NFD- and HFD-fed mice at the indicated time points. Scale bar: 100 μm. b Representative H&E staining (left) and quantification of CLS area percentage (right, n = 4) of iWAT from NFD- or HFD-fed mice at the indicated time points. Scale bar, 100 μm. ce Relative expression of Tnfa, Il-1b, and Il-10 in eWAT (n = 4) (c), iWAT (n = 4) (d), and bone marrow (BM, n = 4) (e) over the course of the feeding regimen. n = 4 biologically independent samples per group. Images are representative of 3 independent experiments. All data are presented as mean ± SD. Two-way ANOVA with Sidak’s post-hoc test (ae) were used. Source data are provided as a Source Data file.
Fig. 3
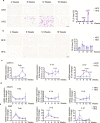
Fig. 3. Removal of bilateral eWAT (eWATx) alters bone mass and rBMAT mass.
a, b Representative μCT images (a) and quantification (n = 5 biologically independent samples) (b) of proximal tibiae from NFD- and HFD-fed mice that had undergone either sham surgery or removal of the bilateral eWAT (eWATx). Scale bar: 500 μm. c, d Representative μCT images (c) and quantification (n = 3 biologically independent samples) (d) of rBMAT in tibiae at week 8 of feeding and eWATx or not. Scale bar: 500 μm. e ITTs were performed at weeks 6, 8, and 12 of NFD- and HFD-fed mice that had undergone eWATx (n = 5 biologically independent samples). Images are representative of 3 independent experiments. All data are presented as mean ± SD. Two-way ANOVA with Tukey’s post-hoc test (b, d) and two-way ANOVA with Sidak’s post-hoc test (e) were used. Source data are provided as a Source Data file. See also Supplementary Tables 2 and 3.
Fig. 4
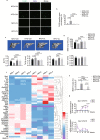
Fig. 4. Infiltrating ATMs in eWAT are related to bone marrow metabolism.
a Immunofluorescence staining of macrophages (F4/80) in eWAT after mice were injected with clodronate liposomes (CL) or control liposomes (Ctrl) into bilateral eWAT for 8 weeks. Green, F4/80; blue, DAPI stain for cell nuclei. Scale bar: 75 μm. b Quantification of the F4/80-positive area percentage with immunofluorescence staining from A (n = 5 biologically independent samples). c, d Representative μCT image (c) and quantification (n = 5 biologically independent samples) (d) of proximal tibiae after mice were injected with control liposomes or CL for 8 weeks. Scale bar: 500 μm. e μCT quantification of rBMAT in tibiae after mice were injected with control liposomes or CL for 8 weeks (n = 4 biologically independent samples). f Heatmap summarizing the fold changes in mRNA expression of different biomarkers in eWAT from NFD- and HFD-fed mice at week 12 (n = 4 biologically independent samples). g Relative expression of Spp1 in eWAT (n = 4 biologically independent samples) and iWAT (n = 4 biologically independent samples) over the course of feeding. Images are representative of 3 independent experiments. All data are presented as mean ± SD. Two-way ANOVA with Tukey’s post-hoc test (b, d, e) and two-way ANOVA with Sidak’s post-hoc test (g) were used. Source data are provided as a Source Data file. See also Supplementary Tables 4 and 5.
Fig. 5
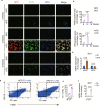
Fig. 5. OPN is primarily secreted by F4/80 + and CD11b+ macrophages in eWAT.
a Representative images of immunofluorescence staining of OPN in eWAT from NFD- and HFD-fed mice at weeks 8, 12, and 16. Scale bar: 100 μm. b Quantification of the F4/80-positive or OPN-positive stained area percentage in eWAT from a (n = 4 biologically independent samples). c Relative expression of Spp1 in the adipocyte fraction (AF) and stromal vascular fraction (SVF) from eWAT or iWAT of HFD-fed mice at week 12 (n = 3 biologically independent samples). d ATMs gated by FACS for F4/80 and CD11b expression from eWAT at week 12 of NFD (left) or HFD feeding (right). Q2 represents the F4/80 + CD11b + (FC + ) ATM population, and Q3 represents the F4/80−CD11b− (FC−) ATM population. e Percentage of FC + ATMs from NFD- and HFD-fed mice at week 12 (n = 4 biologically independent samples). f Relative expression of Spp1 in FC+ and FC− ATMs from HFD-fed mice at week 12 (n = 3 biologically independent samples). Images are representative of 3 independent experiments. All data are presented as mean ± SD. Two-way ANOVA with Sidak’s post-hoc test (b) and two-tailed Welch’s t-test (c, e, f) were used. Source data are provided as a Source Data file.
Fig. 6
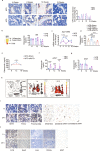
Fig. 6. eWAT-secreted OPN circulates to the bone marrow.
a Representative images of immunohistochemical staining of OPN (left) and the OPN-positive stained areas (right, n = 5 biologically independent samples) of the proximal tibiae of NFD- and HFD-fed groups. Scale bar: 50 μm. b Schematic representation of the isolation of bone marrow supernatant for ELISA (left). Free OPN levels in the bone marrow supernatant of NFD- and HFD-fed mice (right, n = 6 biologically independent samples). c Relative expression of Spp1 in bone marrow over the course of feeding (n = 4 biologically independent samples). d OPN expression in bone marrow supernatant from mice with or without eWATx at week 12 of the indicated diet (n = 6 biologically independent samples). e OPN expression in the serum of the HFD-fed subgroups with and without eWATx at weeks 8, 12, and 16 (n = 5 biologically independent samples). f OPN concentration in eWAT (from NFD- and HFD-fed mice at weeks 8, 12, and 16)-derived conditioned medium (n = 5 biologically independent samples). g OPN concentration in iWAT (from NFD- and HFD-fed mice at weeks 8, 12, and 16)-derived conditioned medium (n = 4 biologically independent samples). h Ex vivo imaging (IVIS200 system) of the indicated organs and tissues collected 1 h (left part of the right box) or 24 h (right part of the right box) after unilateral eWAT injection of rOPN-FITC derived from HFD-fed mice at week 12. i, j Representative images of immunohistochemical staining of OPN (anti-human OPN antibody) in the spine, femur, tibia (proximal and distal), eWAT (ipsilaterally injected depot and contralateral depot) (i), lung, heart, liver, kidney and iWAT (j) of mice injected with rOPN-FITC into the unilateral eWAT for 1 h (top row) and 24 h (bottom row), respectively. Scale bar: 100 μm. BM: bone marrow. Images are representative of 3 independent experiments. All data are presented as mean ± SD. Two-way ANOVA with Sidak’s post-hoc test (ac, eg) and two-way ANOVA with Tukey’s post-hoc test (d) were used. Source data are provided as a Source Data file. See also Supplementary Table 6.
Fig. 7
Fig. 7. eWAT-secreted OPN regulates bone resorption.
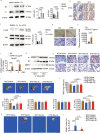
a Representative western blots (left) and quantification (right, n = 3 biologically independent samples) of αv and β3 in BMSCs, BMDMs, and osteoclasts (Oc) in vitro. b Immunohistochemical staining for OPN and cathepsin K (CTSK) in serial sections of tibiae from mice fed for 12 weeks. Scale bar: 50 μm. c Representative western blots (left) and quantification (right, n = 3 biologically independent samples) of the bands of JNK and p-JNK in BMDMs, Oc, and Oc+rOPN after culture for 4 days in vitro. rOPN, 0.5 μg/ml. d Representative images of the osteo-erosion surface (top) and crystal violet staining of the unwashed Osteo Assay surface with or without rOPN treatment under osteoclastogenic induction for 12 days (bottom). Scale bar: 50 μm. e Quantification of the bone resorption area from d (n = 3 biologically independent samples). f Relative expression of Mmp9 in BMDMs with or without rOPN treatment under osteoclastogenic induction for 3 and 6 days, respectively (n = 3 biologically independent samples). g Representative western blots of αv, β3, and MMP9 in the bone marrow of NFD- and HFD-fed mice at week 12. h Immunohistochemical staining of MMP9 from the proximal tibiae of mice after injection of saline or OPN-neutralizing antibody (Neu Ab) into bilateral eWAT for 8 weeks. Scale bar: 100 μm (the bottom row was magnified from the top row, scale bar: 50 µm). i, j Representative μCT images (i) and quantification (n = 5 biologically independent samples) (j) of proximal tibiae after mice were injected with saline or Neu Ab. Scale bar: 500 μm. k, l Representative μCT images (k) and quantification (n = 4 biologically independent samples) (l) of rBMAT of tibiae after mice were injected with saline or Neu Ab. Scale bar: 500 μm. Images are representative of 3 independent experiments. All data are presented as mean ± SD. One-way ANOVA with Tukey’s post-hoc test (a, c), two-tailed Welch’s t-test (e), by two-way ANOVA with Sidak’s post-hoc test (f), and two-way ANOVA with Tukey’s post-hoc test (j, l) were used. Source data are provided as a Source Data file. See also Supplementary Tables 7 and 8.
Fig. 8
Fig. 8. Osteopontin regulates bone marrow-derived macrophages through the lactate/ATP6V0d2 axis.
a Relative expression of different V-ATPase subunits in BMDMs treated with or without (ctrl) rOPN (0.5 μg/ml) under osteoclastogenic induction for 3 days in vitro (n = 3 biologically independent samples). b Representative western blot images (left) and quantification (right, n = 3 biologically independent samples) of ATP6V0d2 in BMDMs, Oc and rOPN-treated Oc for 4 days in vitro. c Total intracellular ATP concentration in BMDMs (ctrl), rOPN (0.5 μg/ml)-treated BMDMs, and BMDMs treated with rOPN (0.5 μg/ml) plus antagonist 27 (100 nM) under osteoclastogenic induction for 0.5 h (n = 4 biologically independent samples). d Intracellular lactate concentration in BMDMs (ctrl), rOPN (0.5 μg/ml)-treated BMDMs, and BMDMs treated with rOPN (0.5 μg/ml) plus antagonist 27 (100 nM) under osteoclastogenic induction for 10 h (n = 4 biologically independent samples). e Relative expression of the indicated V-ATPase subunits in BMDMs stimulated with a gradient concentration of lactate for 24 h under osteoclastogenic induction. #represents significantly decreased (P < 0.0001) expression of Atp6v0d2 in 50 mM lactate-treated BMDMs compared with untreated BMDMs (n = 3 biologically independent samples). f, g Representative images of TRAP staining (f) and counting of Trap+ osteoclasts (n = 6 biologically independent samples) (g) after osteoclastogenic induction in the presence or absence (ctrl) of rOPN (0.5 μg/ml), lactate (50 mM), and rOPN with siRNA Cd61 for 5 days. Scale bar: 50 μm. Images are representative of 3 independent experiments. All data are presented as mean ± SD. Two-way ANOVA with Tukey’s post-hoc test (a, e) and one-way ANOVA with Tukey’s post-hoc test (bd, g) were used. Source data are provided as a Source Data file.
Fig. 9
Fig. 9. OPN induces lysosomal-dependent lipid metabolism in BMDMs.
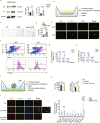
a Representative western blots (left) and quantification (right, n = 3 biologically independent samples) of OPN receptor αv and β3 expression in BMDMs and metabolically activated macrophages (MMes) after culture for 4 days in vitro. b Schematic diagram illustrating the co-culture system as indicated below (c). c, d Representative images (c) and quantification (n = 5 biologically independent samples) (d) of crystal violet staining of BMDMs (ctrl) and MMes treated with or without rOPN for 24 h in a Transwell system. Scale bar: 50 μm. e Immunofluorescence images of buoyant BMDMs (F4/80) containing lipid vesicles (Perilipin 1) isolated from bone marrow supernatant at week 12. Scale bar: 15 μm. f FACS analysis of FC + (F4/80+ and CD11b+ , top) and Perilipin1+ (bottom) BMDMs from NFD- (left) and HFD-fed (right) mice. P9, FC + and Perilipin1+ BMDM population from Q2. g Percentage of FC + and Perilipin1+ BMDMs (n = 5 biologically independent samples). h Lactate concentration in bone marrow supernatant (n = 5 biologically independent samples). i Schematic diagram illustrating the co-culture system as described below (j). j Immunofluorescence staining of the co-cultured BMDMs for 4 days in vitro; the eWAT from mice fed the HFD for 8 weeks was placed in the upper chamber; Neu Ab (2.0 μg/ml) was added into the lower chamber. Scale bar: 50 μm. The right-most image is an enlarged view of the field in the white dashed box. Scale bar: 12.5 μm. k Total intracellular ATP concentration (left, co-culture for 0.5 h) and lactate concentration (right, co-culture for 10 h) in BMDMs with the treatments indicated in j (n = 4 biologically independent samples). l Relative expression of different V-ATPase subunits in ctrl (BMDMs), MMes, and MMes+ rOPN after culture for 24 h (n = 3 biologically independent samples). rOPN, 0.5 μg/ml. Images are representative of 3 independent experiments. All data are presented as mean ± SD. Two-tailed Welch’s t-test (a), one-way ANOVA with Tukey’s post-hoc test (d, k), two-way ANOVA with Sidak’s post-hoc test (g, h), and two-way ANOVA with Tukey’s post-hoc test (l) were used. Source data are provided as a Source Data file.
Fig. 10
Fig. 10. Schematic diagram showing that macrophages in epididymal adipose tissue secrete OPN to regulate bone homeostasis.
eWAT-secreted OPN accumulates in the bone marrow compartment where OPN promotes bone resorption and lipophagocytic mobilization, but the excess accumulation of lactate inhibits pre-osteoclast fusion and neutral lipid hydrolysis via lysosomal-dependent ATP6V0d2 in BMDMs.

References

    1. Tencerova M, et al. High-fat diet-induced obesity promotes expansion of bone marrow adipose tissue and impairs skeletal stem cell functions in mice. J. Bone Miner. Res. 2018;33:1154–1165. - PubMed
    1. Shapses SA, Sukumar D. Bone metabolism in obesity and weight loss. Annu. Rev. Nutr. 2012;32:287–309. - PMC - PubMed
    1. Musso G, Paschetta E, Gambino R, Cassader M, Molinaro F. Interactions among bone, liver, and adipose tissue predisposing to diabesity and fatty liver. Trends Mol. Med. 2013;19:522–535. - PubMed
    1. Osborn O, Olefsky JM. The cellular and signaling networks linking the immune system and metabolism in disease. Nat. Med. 2012;18:363–374. - PubMed
    1. Romacho T, Elsen M, Rohrborn D, Eckel J. Adipose tissue and its role in organ crosstalk. Acta Physiol. 2014;210:733–753. - PubMed

Publication types

MeSH terms