. 2022 Jan 20;9(1):18.
doi: 10.1038/s41597-021-01114-3.

Proteomic cellular signatures of kinase inhibitor-induced cardiotoxicity

Affiliations

Proteomic cellular signatures of kinase inhibitor-induced cardiotoxicity

Yuguang Xiong et al. Sci Data. .

Abstract

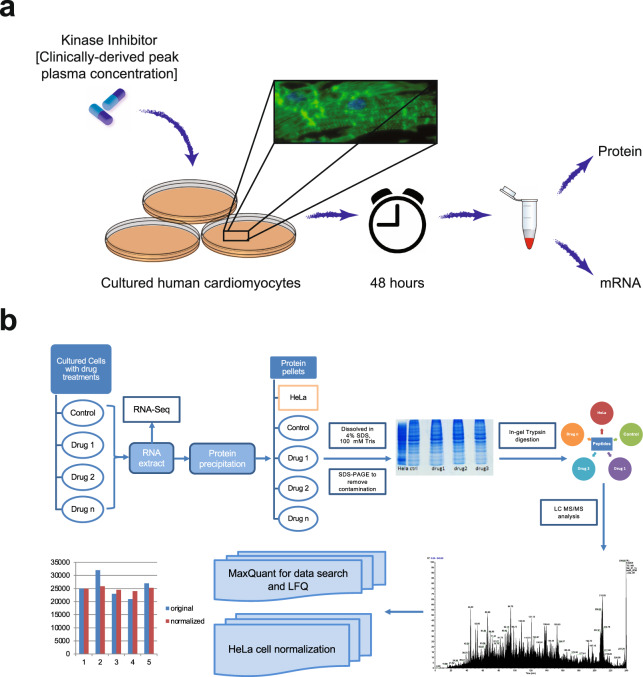
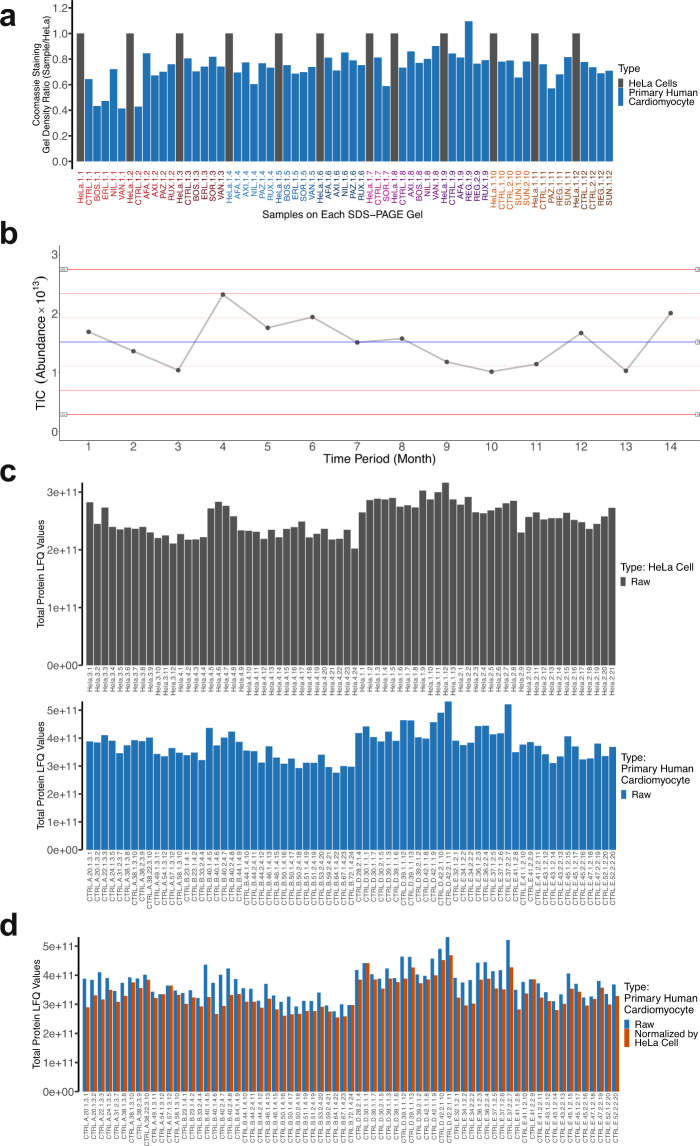
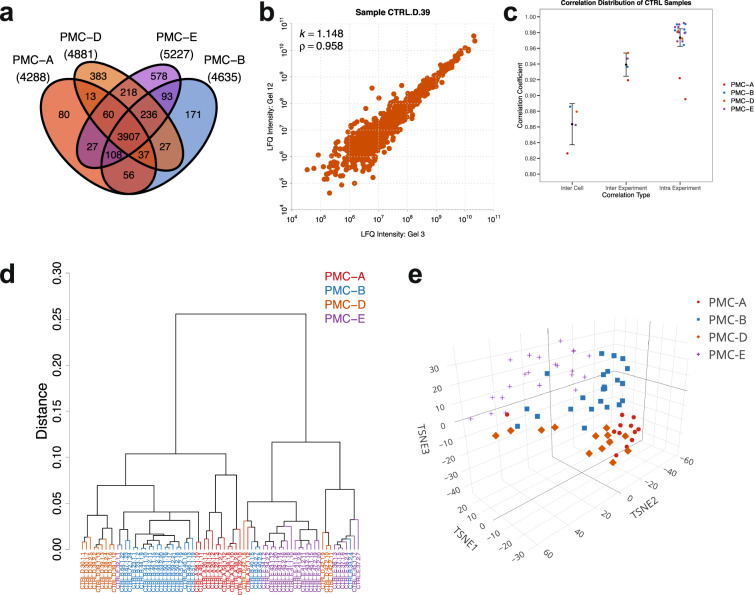
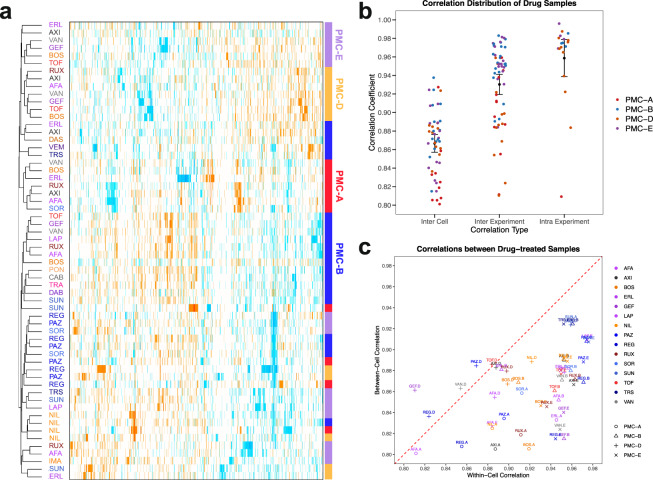
Drug Toxicity Signature Generation Center (DToxS) at the Icahn School of Medicine at Mount Sinai is one of the centers for the NIH Library of Integrated Network-Based Cellular Signatures (LINCS) program. Its key aim is to generate proteomic and transcriptomic signatures that can predict cardiotoxic adverse effects of kinase inhibitors approved by the Food and Drug Administration. Towards this goal, high throughput shotgun proteomics experiments (308 cell line/drug combinations +64 control lysates) have been conducted. Using computational network analyses, these proteomic data can be integrated with transcriptomic signatures, generated in tandem, to identify cellular signatures of cardiotoxicity that may predict kinase inhibitor-induced toxicity and enable possible mitigation. Both raw and processed proteomics data have passed several quality control steps and been made publicly available on the PRIDE database. This broad protein kinase inhibitor-stimulated human cardiomyocyte proteomic data and signature set is valuable for prediction of drug toxicities.


Conflict of interest statement

The authors declare no competing interests.

Figures

Fig. 1
Fig. 1
LFQ proteomics workflow for the DToxS dataset. (a) Drug and cell treatment design and experimental workflow. (b) After drug treatment, RNA was extracted from cell pellets, and the remaining proteins were recovered via protein precipitation. The protein amount for each sample was carefully estimated from its SDS-PAGE staining intensity as measured relative to a HeLa cell lysate standard. Two micrograms of protein from each sample were analyzed by LC-MS/MS, and the resulting proteins were quantified via LFQ approach using MaxQuant.
Fig. 2
Fig. 2
MS/MS quality control for the DToxS dataset. A series of quality control steps have been implemented to obtain high quality data for this dataset. (a) A gel-based method was developed for protein estimation. In each SDS-PAGE gel, 25 µg of HeLa cell protein extract was run as a reference to estimate the total protein amount of each sample (blue verticle lines). Based on the density of the CBB stain of each lane in relation to the HeLa stain density, the protein amount can be calculated (see examples in Online-only Table 1). After the tryptic digestions, the resulting peptides were diluted into 0.5 µg/ml for LC-MS/MS analysis (orange verticle lines), based on the estimated protein amount in each sample. (b) Levey-Jennings performance chart showing instrument stability. Two hundred nanograms of commercial HeLa protein digest was analyzed regulary during the time period of the DToxS LINCS data acquisition. Total ion current (TIC) from each month is shown. Red lines demarcate one, two and three times the standard deviation; LCL/UCL = lower/upper control limit. (c) Deep proteome coverage indicates good instrument sensitivity. Total protein groups identified from each cell line in this study are shown, with over ~5,000 unique proteins identified per cell line. (d) The HeLa protein digests were used for LFQ normalization. Based on the MS1 LFQ counts of the HeLa cells from each gel (top panel), a normalization factor was calculated and applied to the MS1 counts of the samples. After the HeLa cell normalization, the LFQ variation was more stable.
Fig. 3
Fig. 3
Coverage and reproducibility of detected proteins in control samples. (a) Venn diagram of the overlapping and unique protein groups across all samples for the four cardiomyocyte lines PMC-A, B, D, E. (b) Normalized MS1 LFQ intensities for the same sample measured from two separate SDS-PAGE gels in two different MS/MS runs had strong agreement. (c) The correlation (mean and variation) of LFQ intensity between the control samples from the same experiment for each experiment versus the samples from different experiments in each cell line (cell lines PMC-A, B, D, E shown in color coordination). (d) The clustering of all biological replicates from four cell lines under control conditions based on the Eucledian distances of LFQ intensities of replicates. (e) Accordingly, proteomic signatures of the four cell lines under control conditions across 71 biological replicates showed strong clustering based on the source cell line.
Fig. 4
Fig. 4
Reproducibility of differential protein expression measurements for drug-treated samples. (a) Unsupervised clustering of top 100 differentially expressed proteins in KI treated cardiomyocyte-like cell lines. Color-coding on the left reflects the primary target of the drugs (see Table 1 for further details), whereas the bars on the right highlight the cell line. While KIs with weak proteomic signatures cluster along cell lines, those that have strong differential protein expression cluster along the primary target profile of the drugs. (b) The similarity and variability of drug-treated samples within and between cell lines as determined by Pearson correlation between drug treated replicates and controls. (c) A summary of the drugs showing similar profiles between cells versus those showing different profiles within cells.

Dataset use reported in

  • doi: 10.1038/s41467-020-18396-7
  • doi: 10.1038/s41597-021-01008-4

References

    1. Gross S, Rahal R, Stransky N, Lengauer C, Hoeflich KP. Targeting cancer with kinase inhibitors. The Journal of clinical investigation. 2015;125:1780–1789. - PMC - PubMed
    1. Calizo RC, et al. Disruption of podocyte cytoskeletal biomechanics by dasatinib leads to nephrotoxicity. Nat Commun. 2019;10:2061. - PMC - PubMed
    1. Sharma, A. et al. High-throughput screening of tyrosine kinase inhibitor cardiotoxicity with human induced pluripotent stem cells. Science translational medicine9 (2017). - PMC - PubMed
    1. Keenan, A. B. et al. The Library of Integrated Network-Based Cellular Signatures NIH Program: System-Level Cataloging of Human Cells Response to Perturbations. Cell Syst (2017). - PMC - PubMed
    1. Schwanhausser B, et al. Global quantification of mammalian gene expression control. Nature. 2011;473:337–342. - PubMed

Publication types

Substances