. 2022 Jan 20;12(1):1052.
doi: 10.1038/s41598-022-05142-w.

COVID-19 lockdowns reveal the resilience of Adriatic Sea fisheries to forced fishing effort reduction

Affiliations

COVID-19 lockdowns reveal the resilience of Adriatic Sea fisheries to forced fishing effort reduction

Gianpaolo Coro et al. Sci Rep. .

Abstract

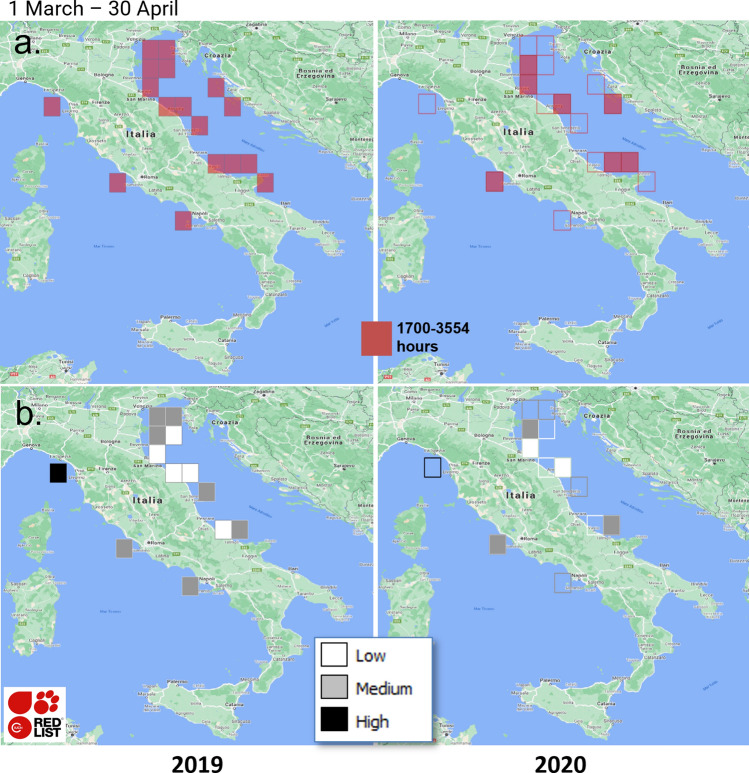
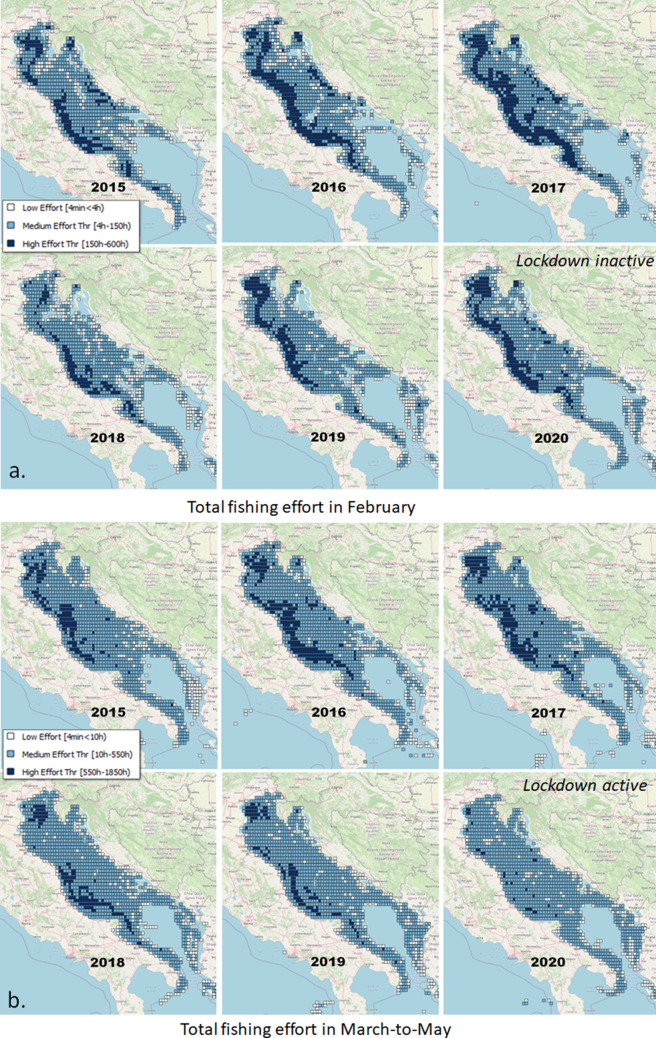
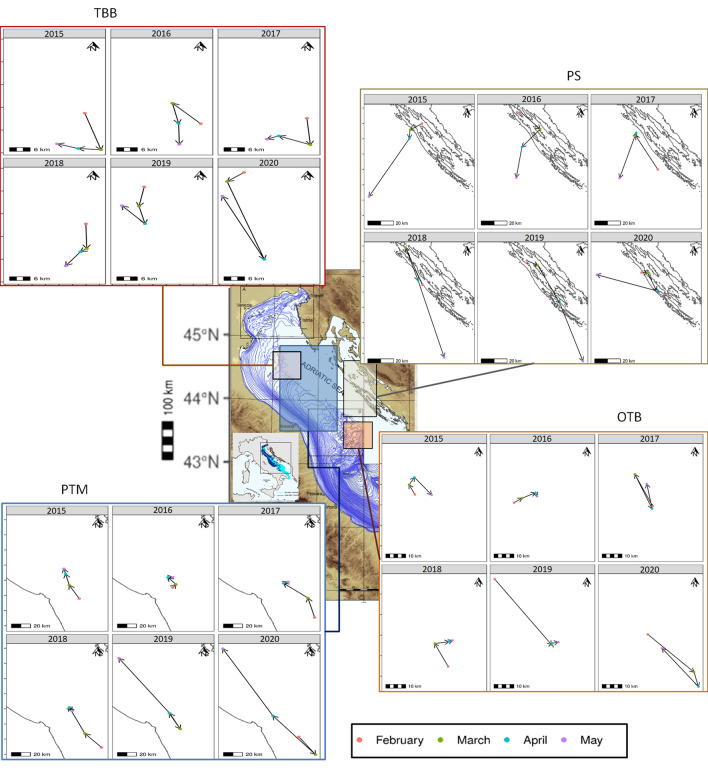
The COVID-19 pandemic provides a major opportunity to study fishing effort dynamics and to assess the response of the industry to standard and remedial actions. Knowing a fishing fleet's capacity to compensate for effort reduction (i.e., its resilience) allows differentiating governmental regulations by fleet, i.e., imposing stronger restrictions on the more resilient and weaker restrictions on the less resilient. In the present research, the response of the main fishing fleets of the Adriatic Sea to fishing hour reduction from 2015 to 2020 was measured. Fleet activity per gear type was inferred from monthly Automatic Identification System data. Pattern recognition techniques were applied to study the fishing effort trends and barycentres by gear. The beneficial effects of the lockdowns on Adriatic endangered, threatened and protected (ETP) species were also estimated. Finally, fleet effort series were examined through a stock assessment model to demonstrate that every Adriatic fishing fleet generally behaves like a stock subject to significant stress, which was particularly highlighted by the pandemic. Our findings lend support to the notion that the Adriatic fleets can be compared to predators with medium-high resilience and a generally strong impact on ETP species.


Conflict of interest statement

The authors declare no competing interests.

Figures

Figure 1
Figure 1
(a) Log-normal selection of 0.5 high-effort fishing locations, in the Italian seas, from Global Fishing Watch data from 1 March to 30 April. (b) Number (high, medium, low) of endangered, threatened and protected (ETP) species recorded at these locations. To enhance the comparison, the outlines of the 2019 cells (left) are reported in the 2020 maps (right). Maps were created with QGIS v.3.20.2 (www.qgis.org) using Google Maps-Satellite as the background map (version of 8 November 2021) (https://maps.google.com/).
Figure 2
Figure 2
Spatial distributions, in the Adriatic Sea, of cumulative 2015–2020 fishing hours by estimated fishing gear at a 0.1 resolution. Maps were created with QGIS v.3.20.2 (www.qgis.org) using the OSM-Standard map of the QuickMapService plugin as the background map.
Figure 3
Figure 3
Comparison of the distributions of total fishing hours in the Adriatic Sea (0.1 resolution) in 2015–2020 in (a) February and (b) March-to-May (aggregated). The classification of the 2015 distribution is used for all years for consistency. Maps were created with QGIS v.3.20.2 (www.qgis.org) using the OSM-Standard map of the QuickMapService plugin as the background map.
Figure 4
Figure 4
Distribution of the annual barycentre shifts over February and May between 2015 and 2020, reported per estimated fishing gear. The coloured bounding boxes depict the maximum extents of the barycentre movements. Acronyms refer to distinct fleets using purse seines (PS), pelagic pair trawls (PTM), beam trawls (TBB) or bottom otter trawls (OTB). The underlying bathymetry map belongs to a previous work of co-author F. Trincardi. Barycentre shift visualisation was realised with R v.4.1.2 (https://cran.r-project.org/bin/windows/base/) using the ggplot2 v.3.3.5, cowplot v.1.1.1, and raster v.3.5.2 packages.
Figure 5
Figure 5
Spatial distribution of the total potential impact of fishing activities on endangered, threatened and protected (ETP) species in (a) February and (b) March-to-May (aggregated). Maps were created with QGIS v.3.20.2 (www.qgis.org) using the OSM-Standard map of the QuickMapService plugin as the background map.
Figure 6
Figure 6
Fishing effort reduction divided by the maximum sustainable reduction reported for all fishing methods as estimated by AMSY: (a) values below the dashed line indicate low fishing hour limitation (low stress), those above the dashed line indicate strong limitation (high stress); (b) detailed representation of the February–November 2020 time series. Acronyms refer to the purse seine (PS), pelagic pair trawl (PTM), beam trawl (TBB) and bottom otter trawl (OTB) fleets.
Figure 7
Figure 7
Number of fishing vessels per fleet over the months from January 2015 to November 2020, with indication of total fishing hours being greater or equal to (green dots) or under (red dots) the maximum sustainable reduction estimated for the fleet. Acronyms refer to the purse seine (PS), pelagic pair trawl (PTM), beam trawl (TBB) and bottom otter trawl (OTB) fleets.

References

    1. Clavelle, T. Global fisheries during COVID-19 (2020). https://globalfishingwatch.org/data-blog/global-fisheries-during-covid-19/
    1. FAO. Food and Agriculture Organization of the United Nations—How is COVID-19 affecting the fisheries and aquaculture food systems (2020). http://www.fao.org/documents/card/en/c/ca8637en/
    1. WWF. World Wide Fund for Nature—Impact of COVID-19 on Mediterranean Fisheries (2020). https://www.wwfmmi.org/what_we_do/fisheries/transforming_small_scale_fis...
    1. Bennett NJ, et al. The Covid-19 pandemic, small-scale fisheries and coastal fishing communities. Coast. Manag. 2020;48:336–347. doi: 10.1080/08920753.2020.1766937. - DOI
    1. Coro, G., Fortunati, L. & Pagano, P. Deriving fishing monthly effort and caught species from vessel trajectories. In 2013 MTS/IEEE OCEANS-Bergen 1–5 (IEEE, 2013).

Publication types