. 2022 Jan;4(1):141-152.
doi: 10.1038/s42255-021-00517-1. Epub 2022 Jan 20.

Circulating metabolite homeostasis achieved through mass action

Affiliations

Circulating metabolite homeostasis achieved through mass action

Xiaoxuan Li et al. Nat Metab. 2022 Jan.

Abstract

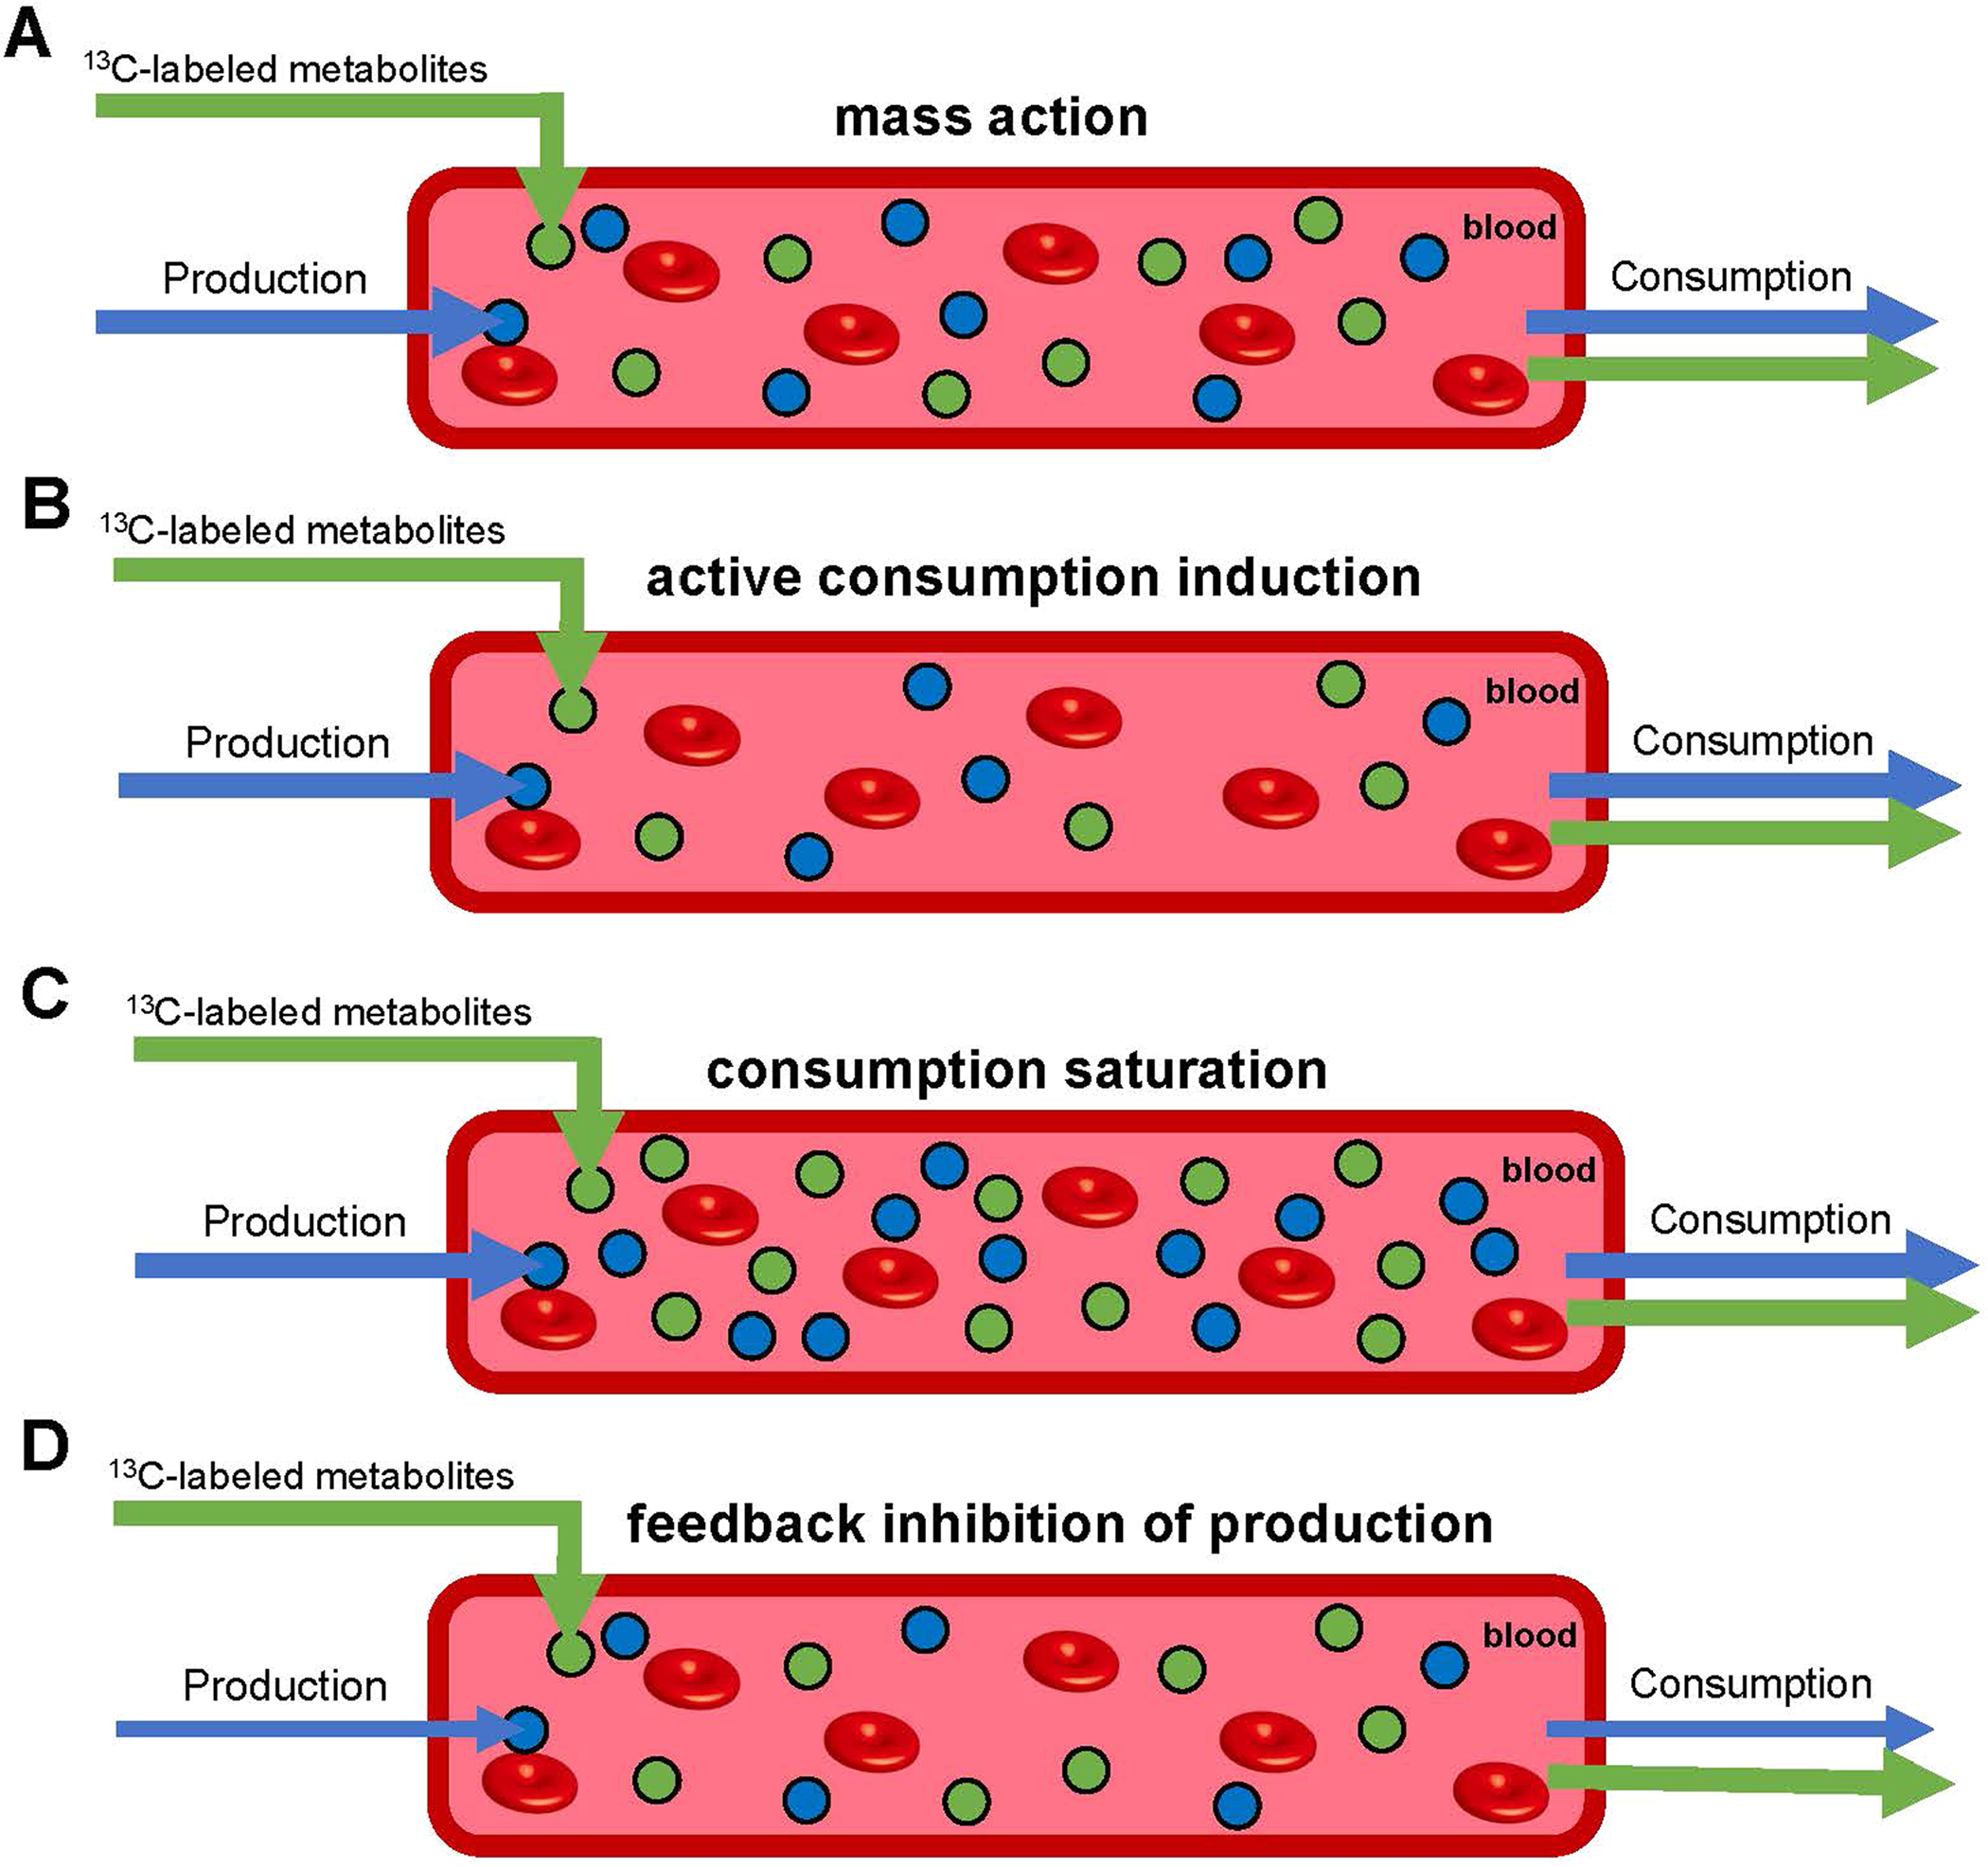
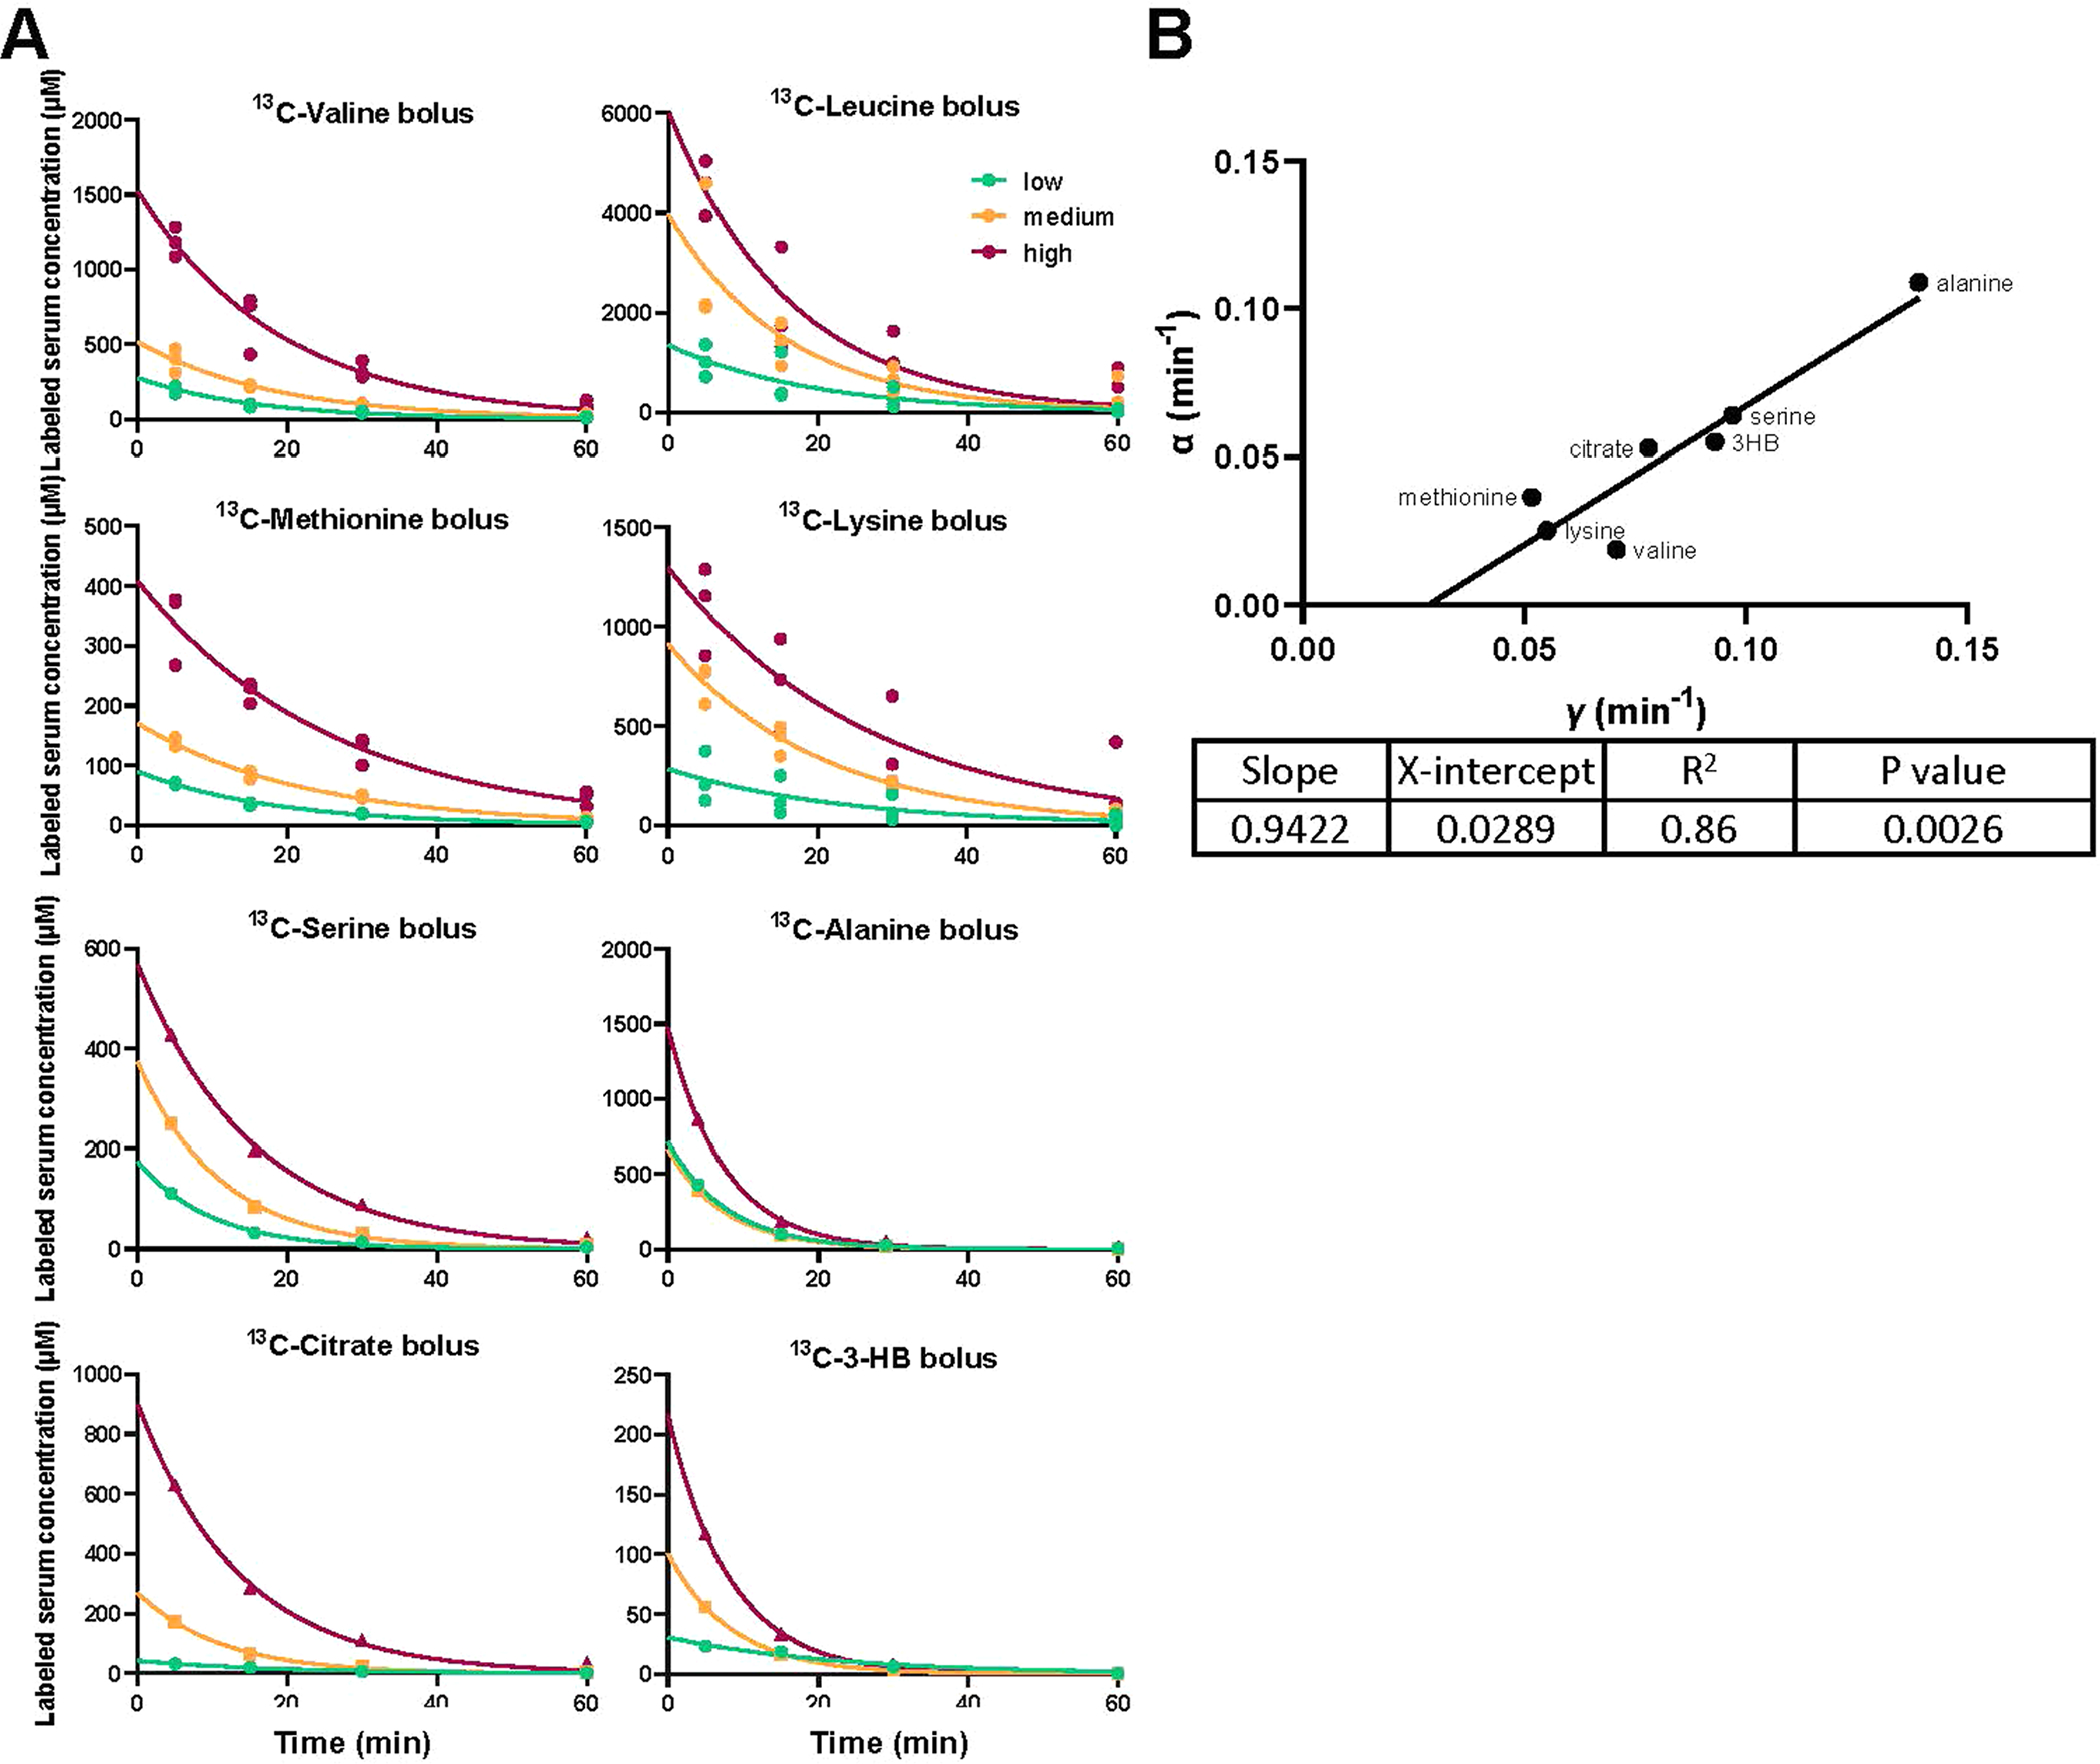
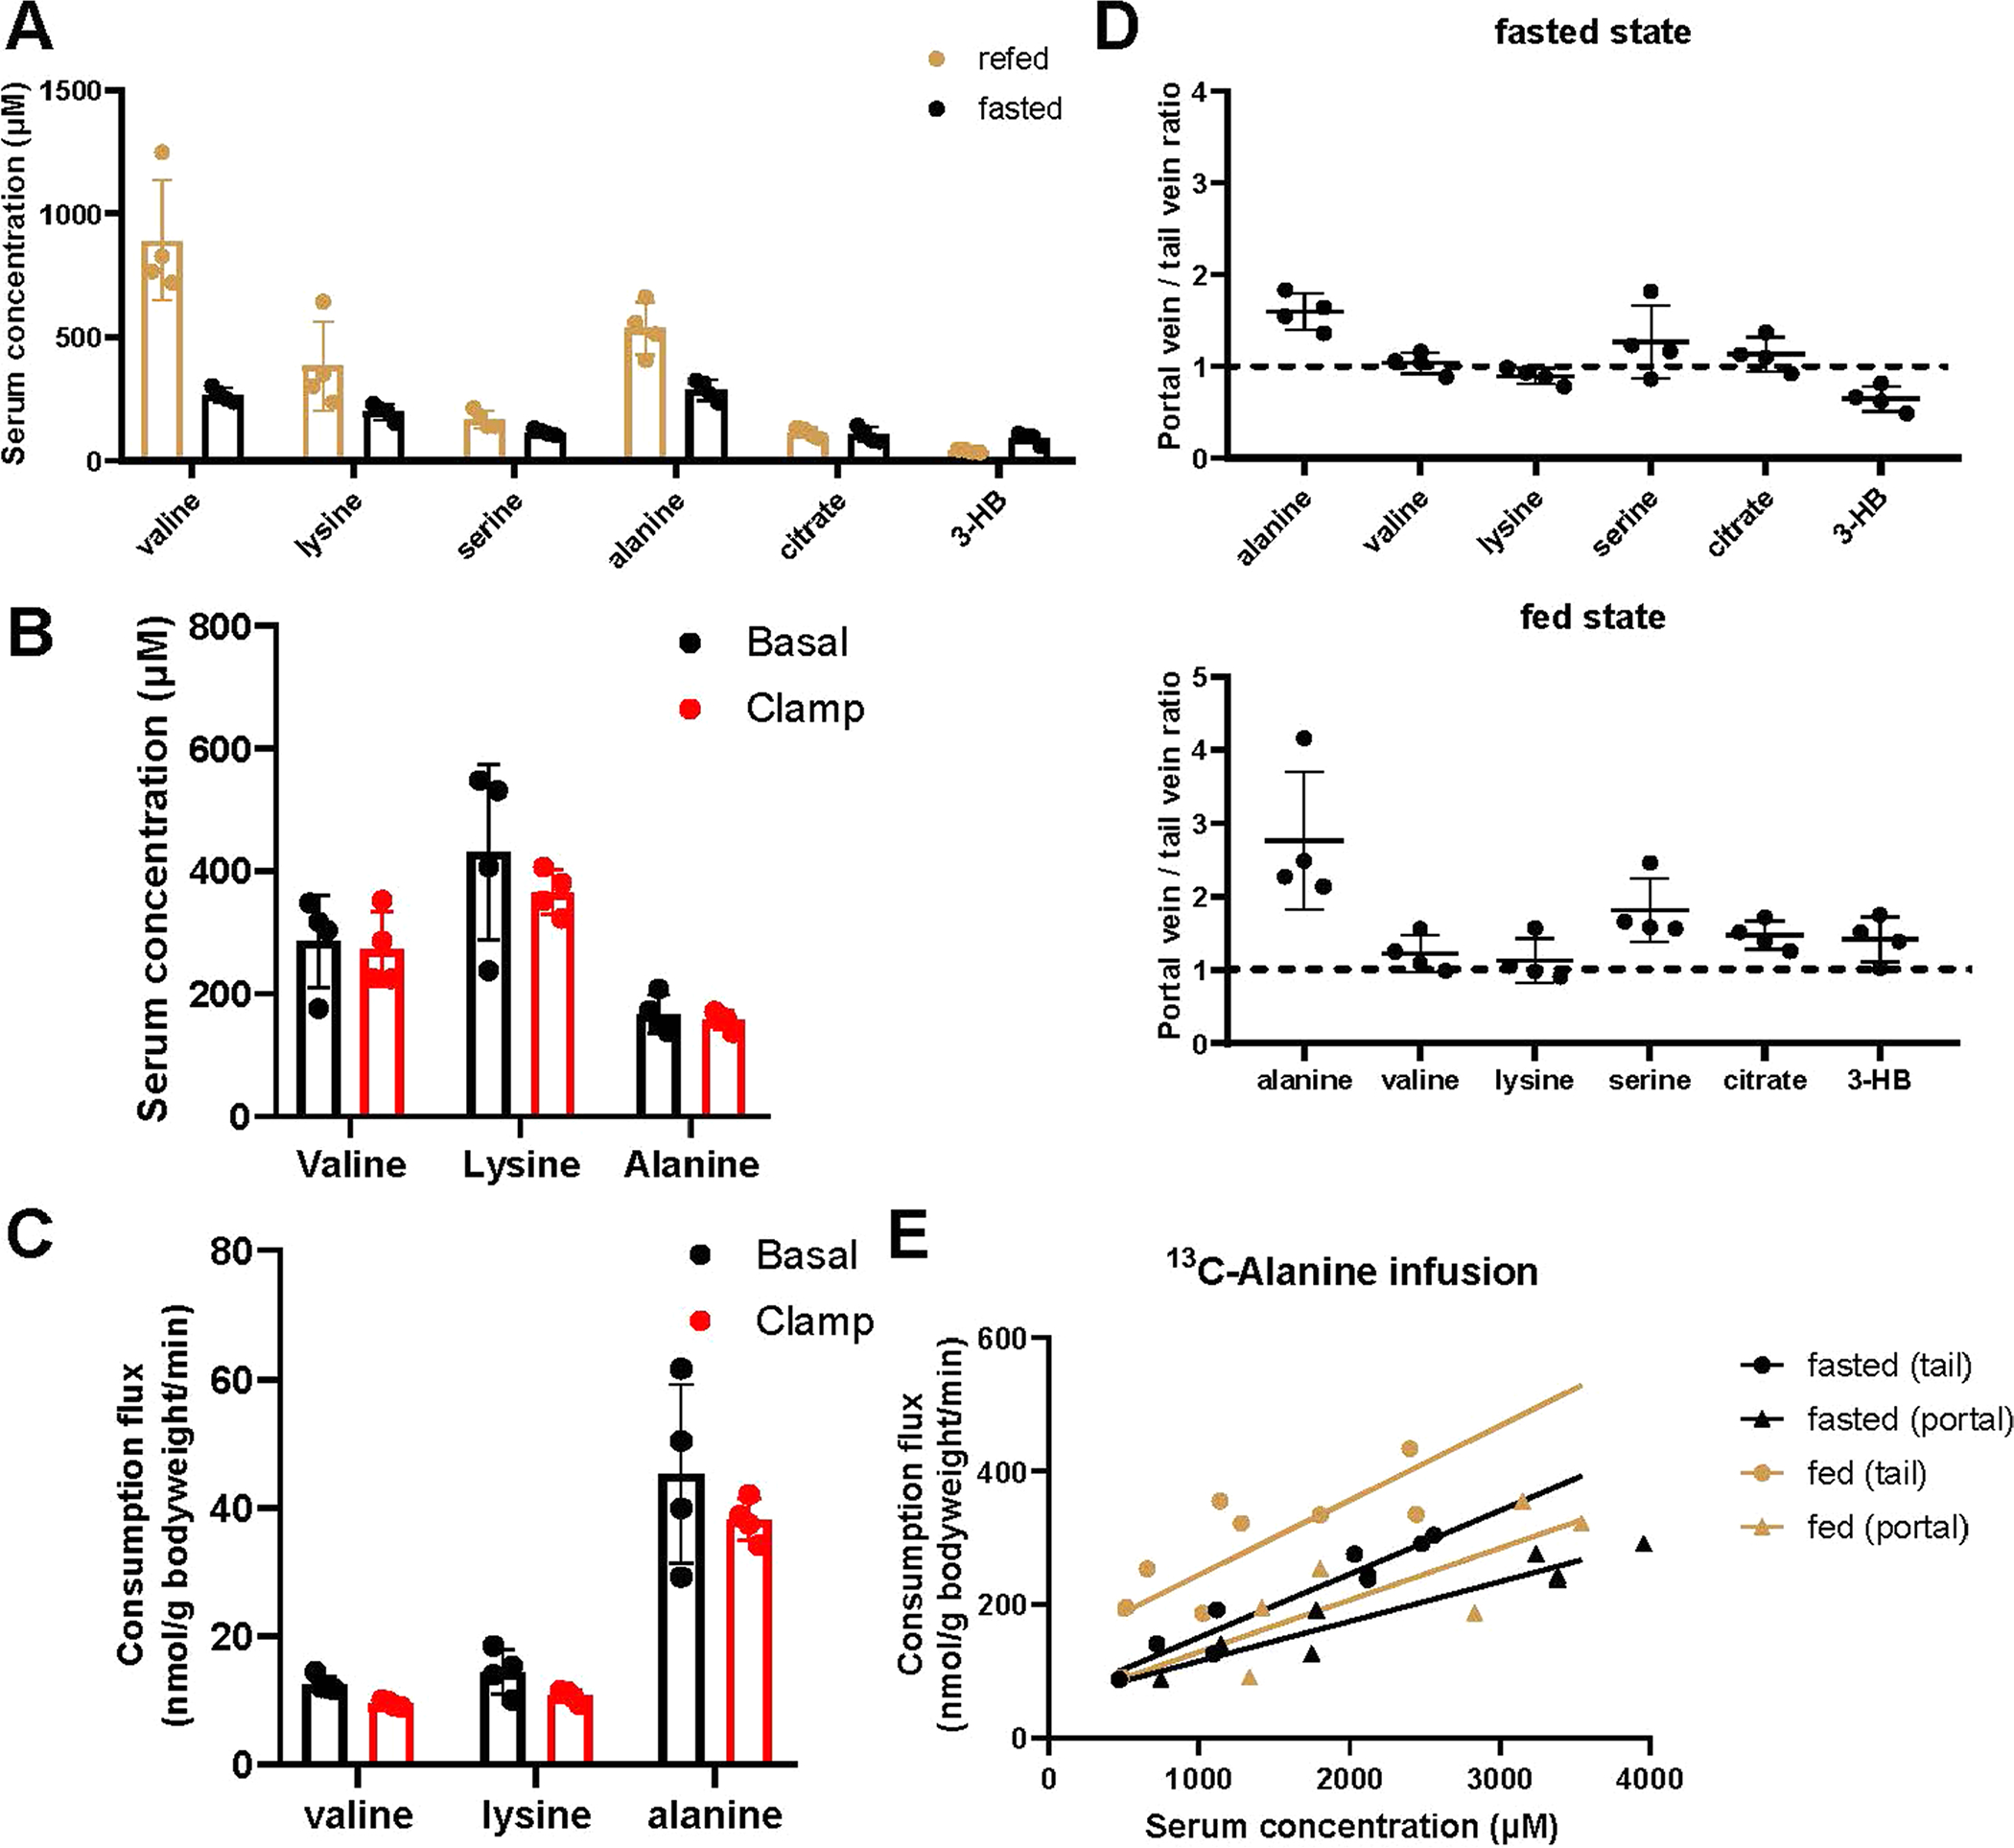
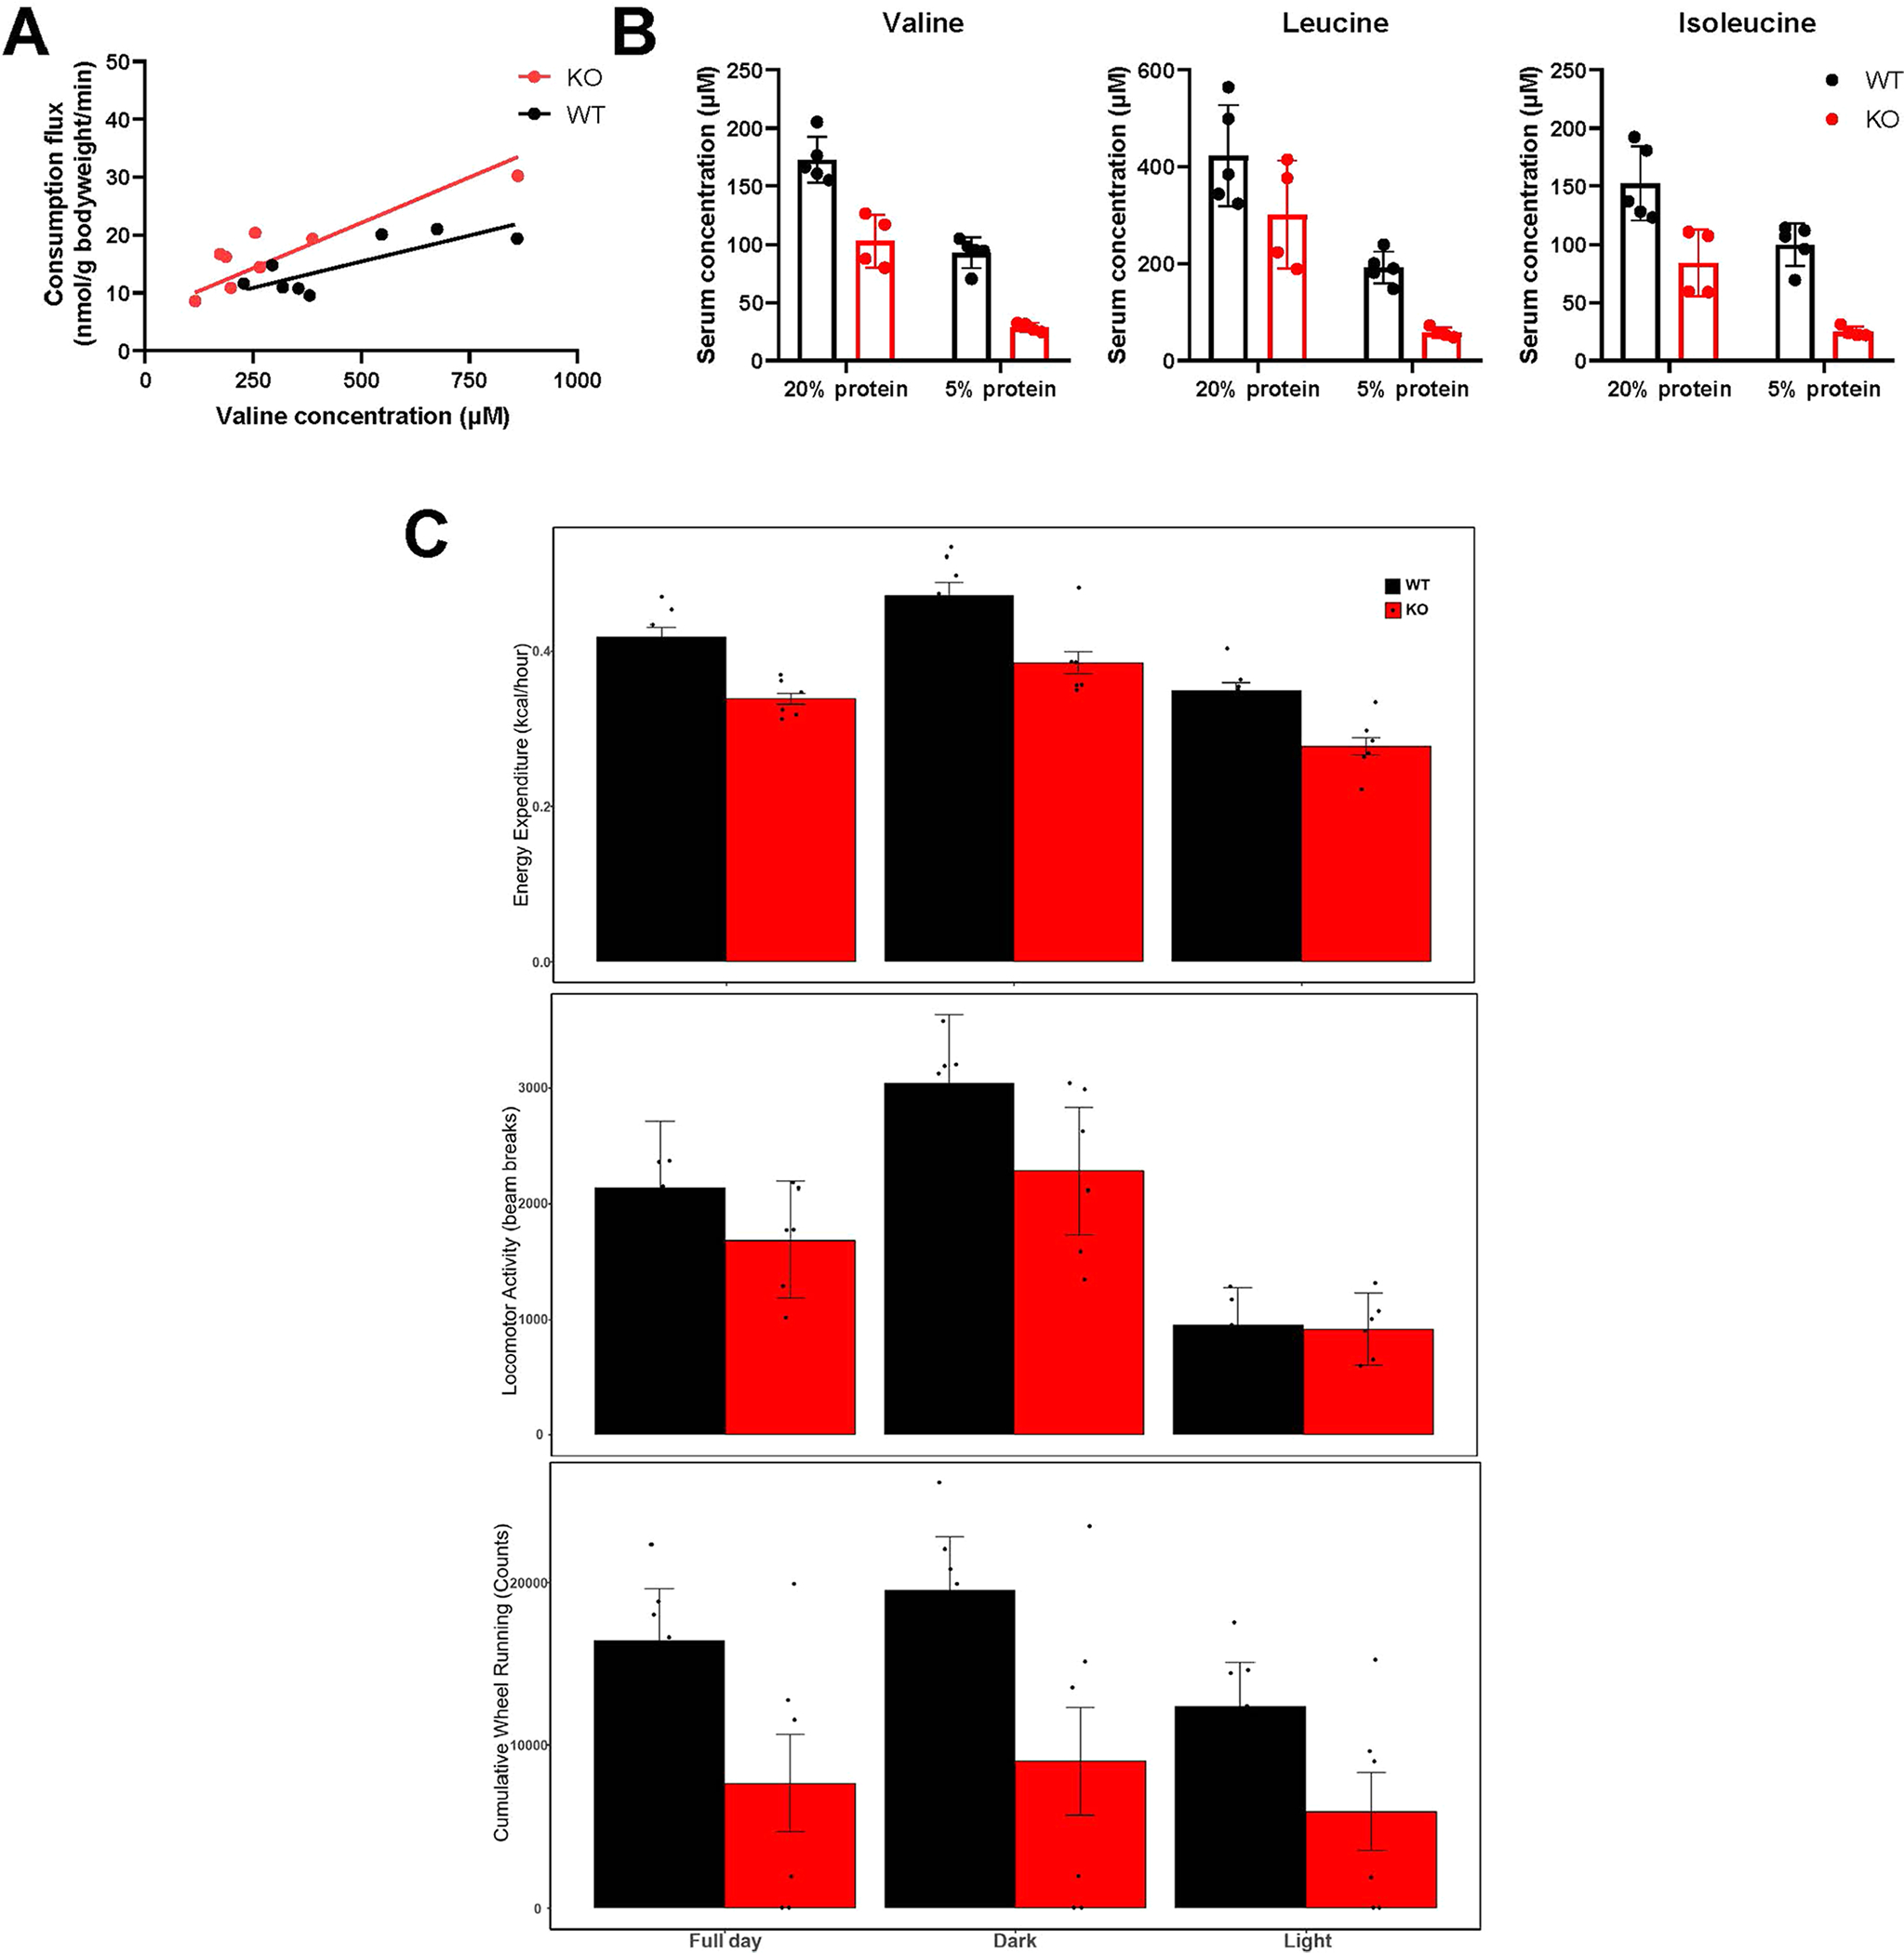
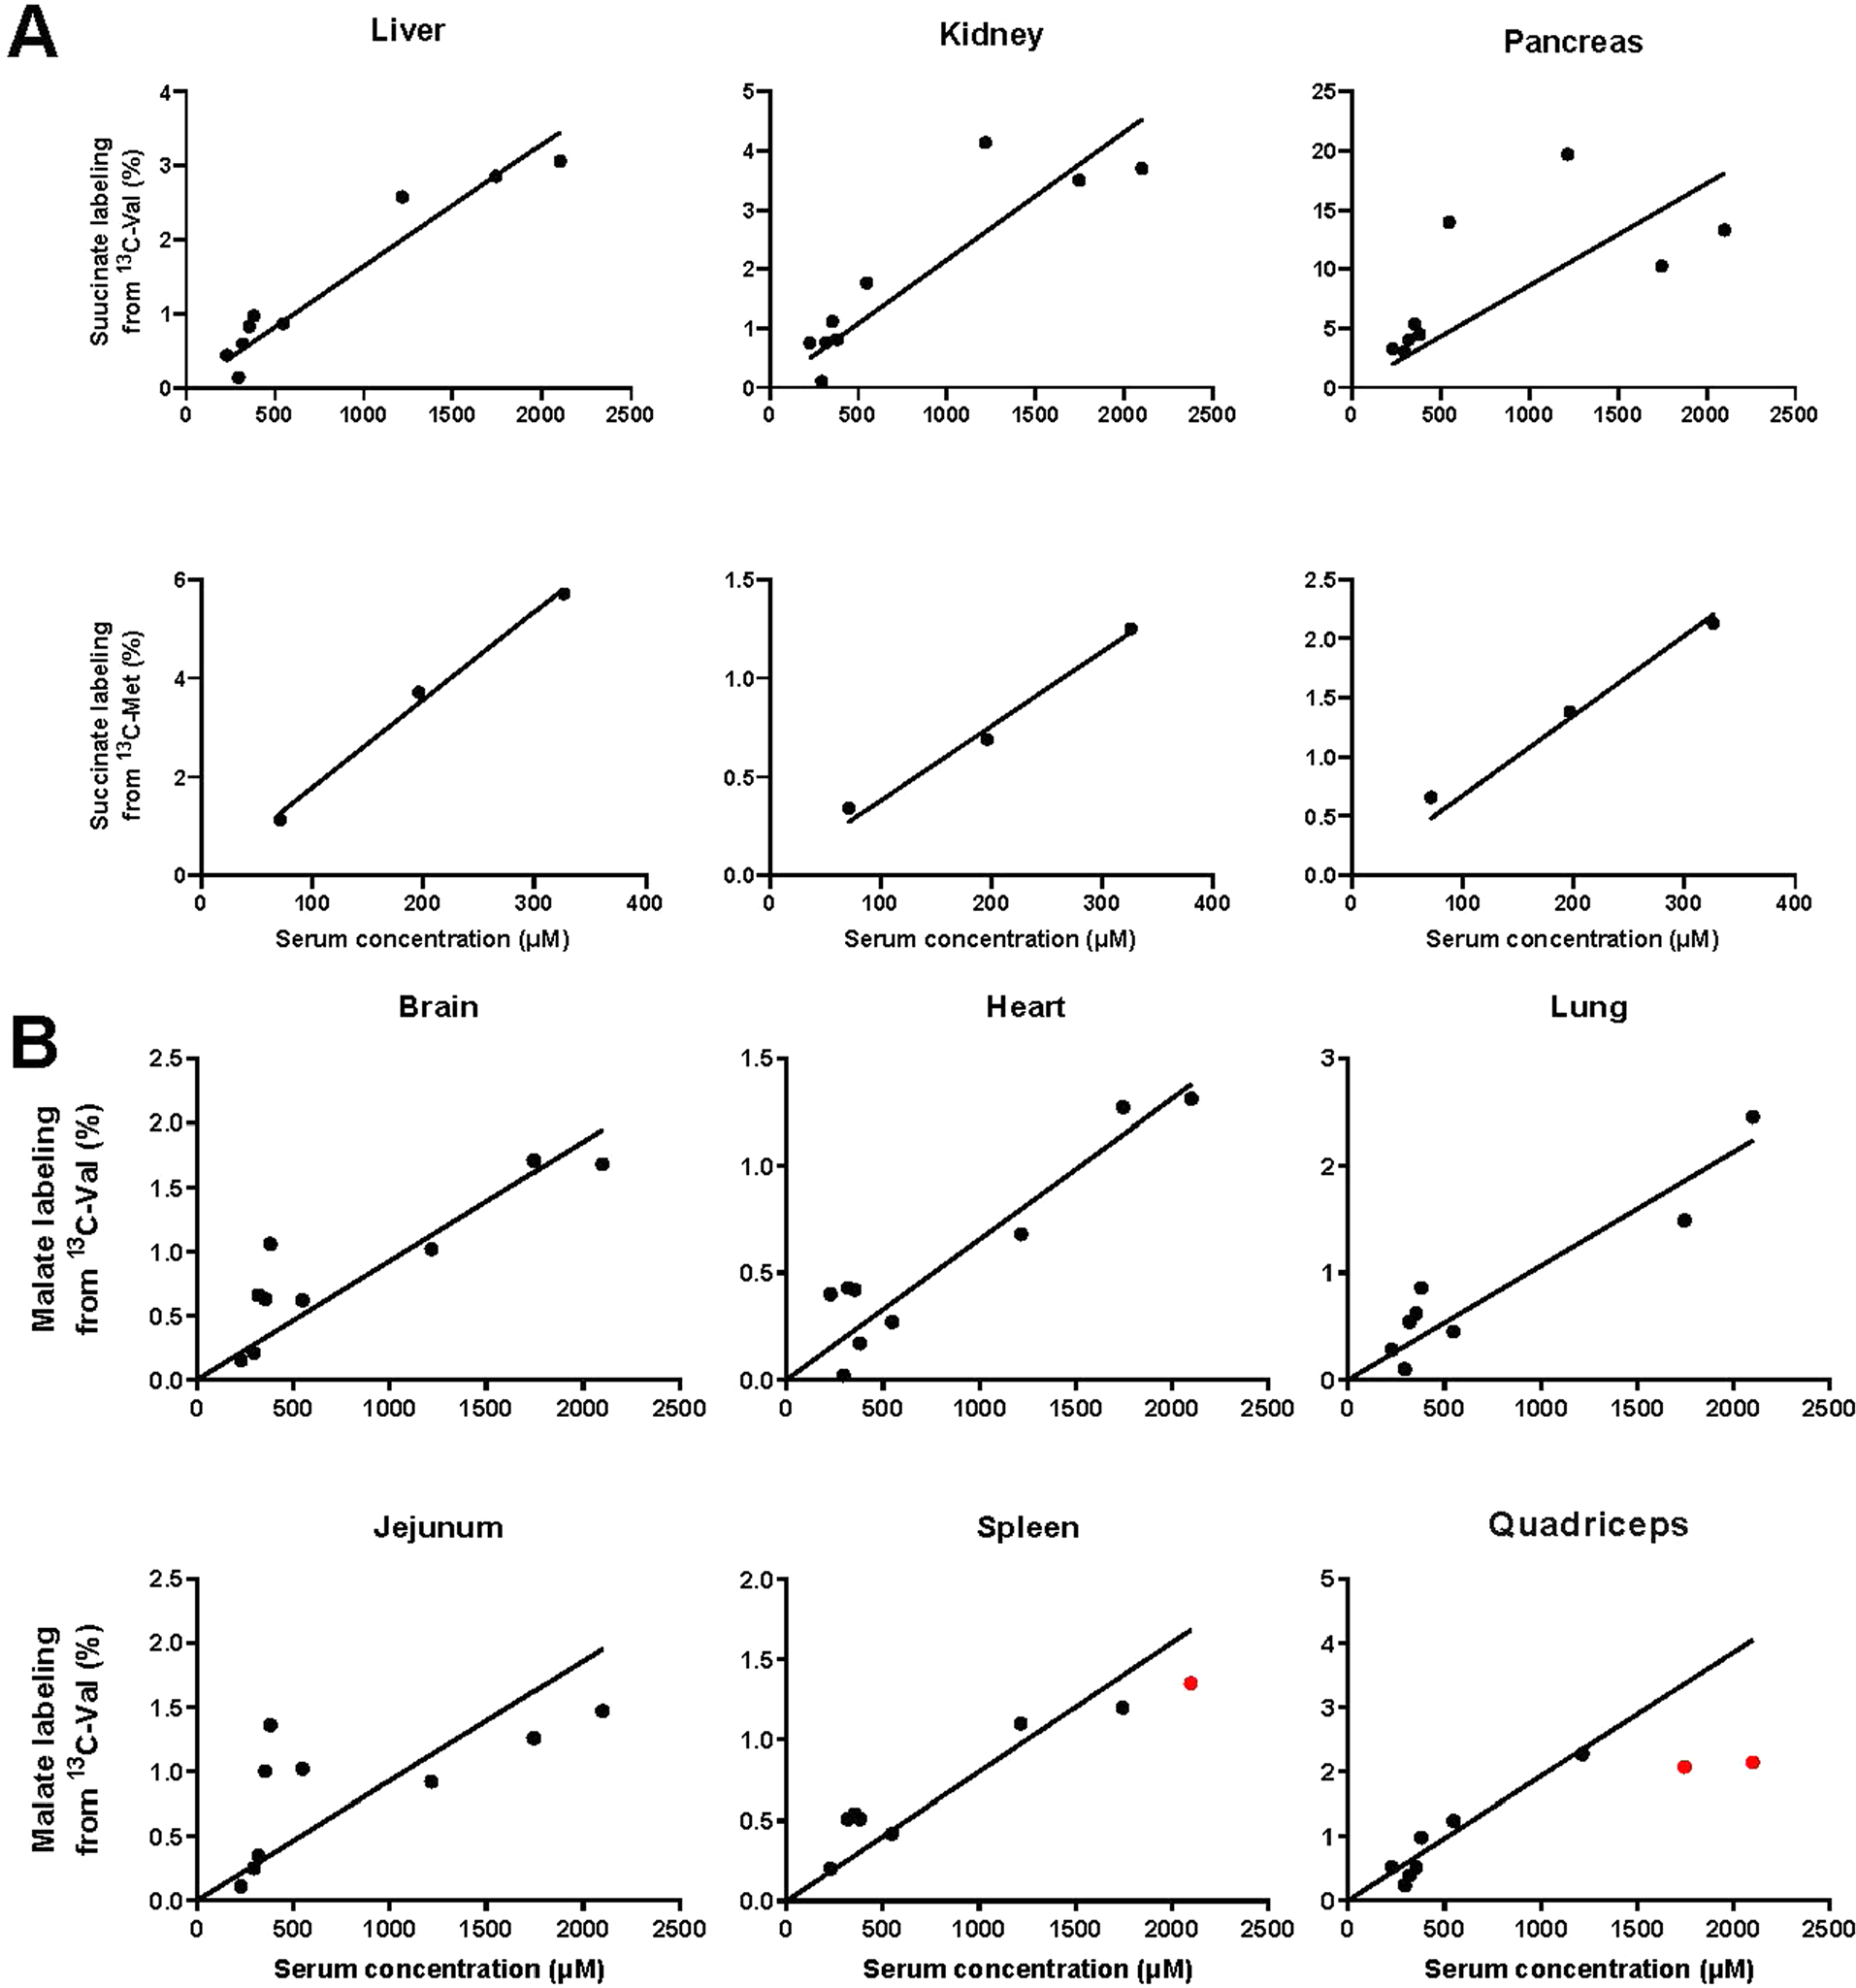
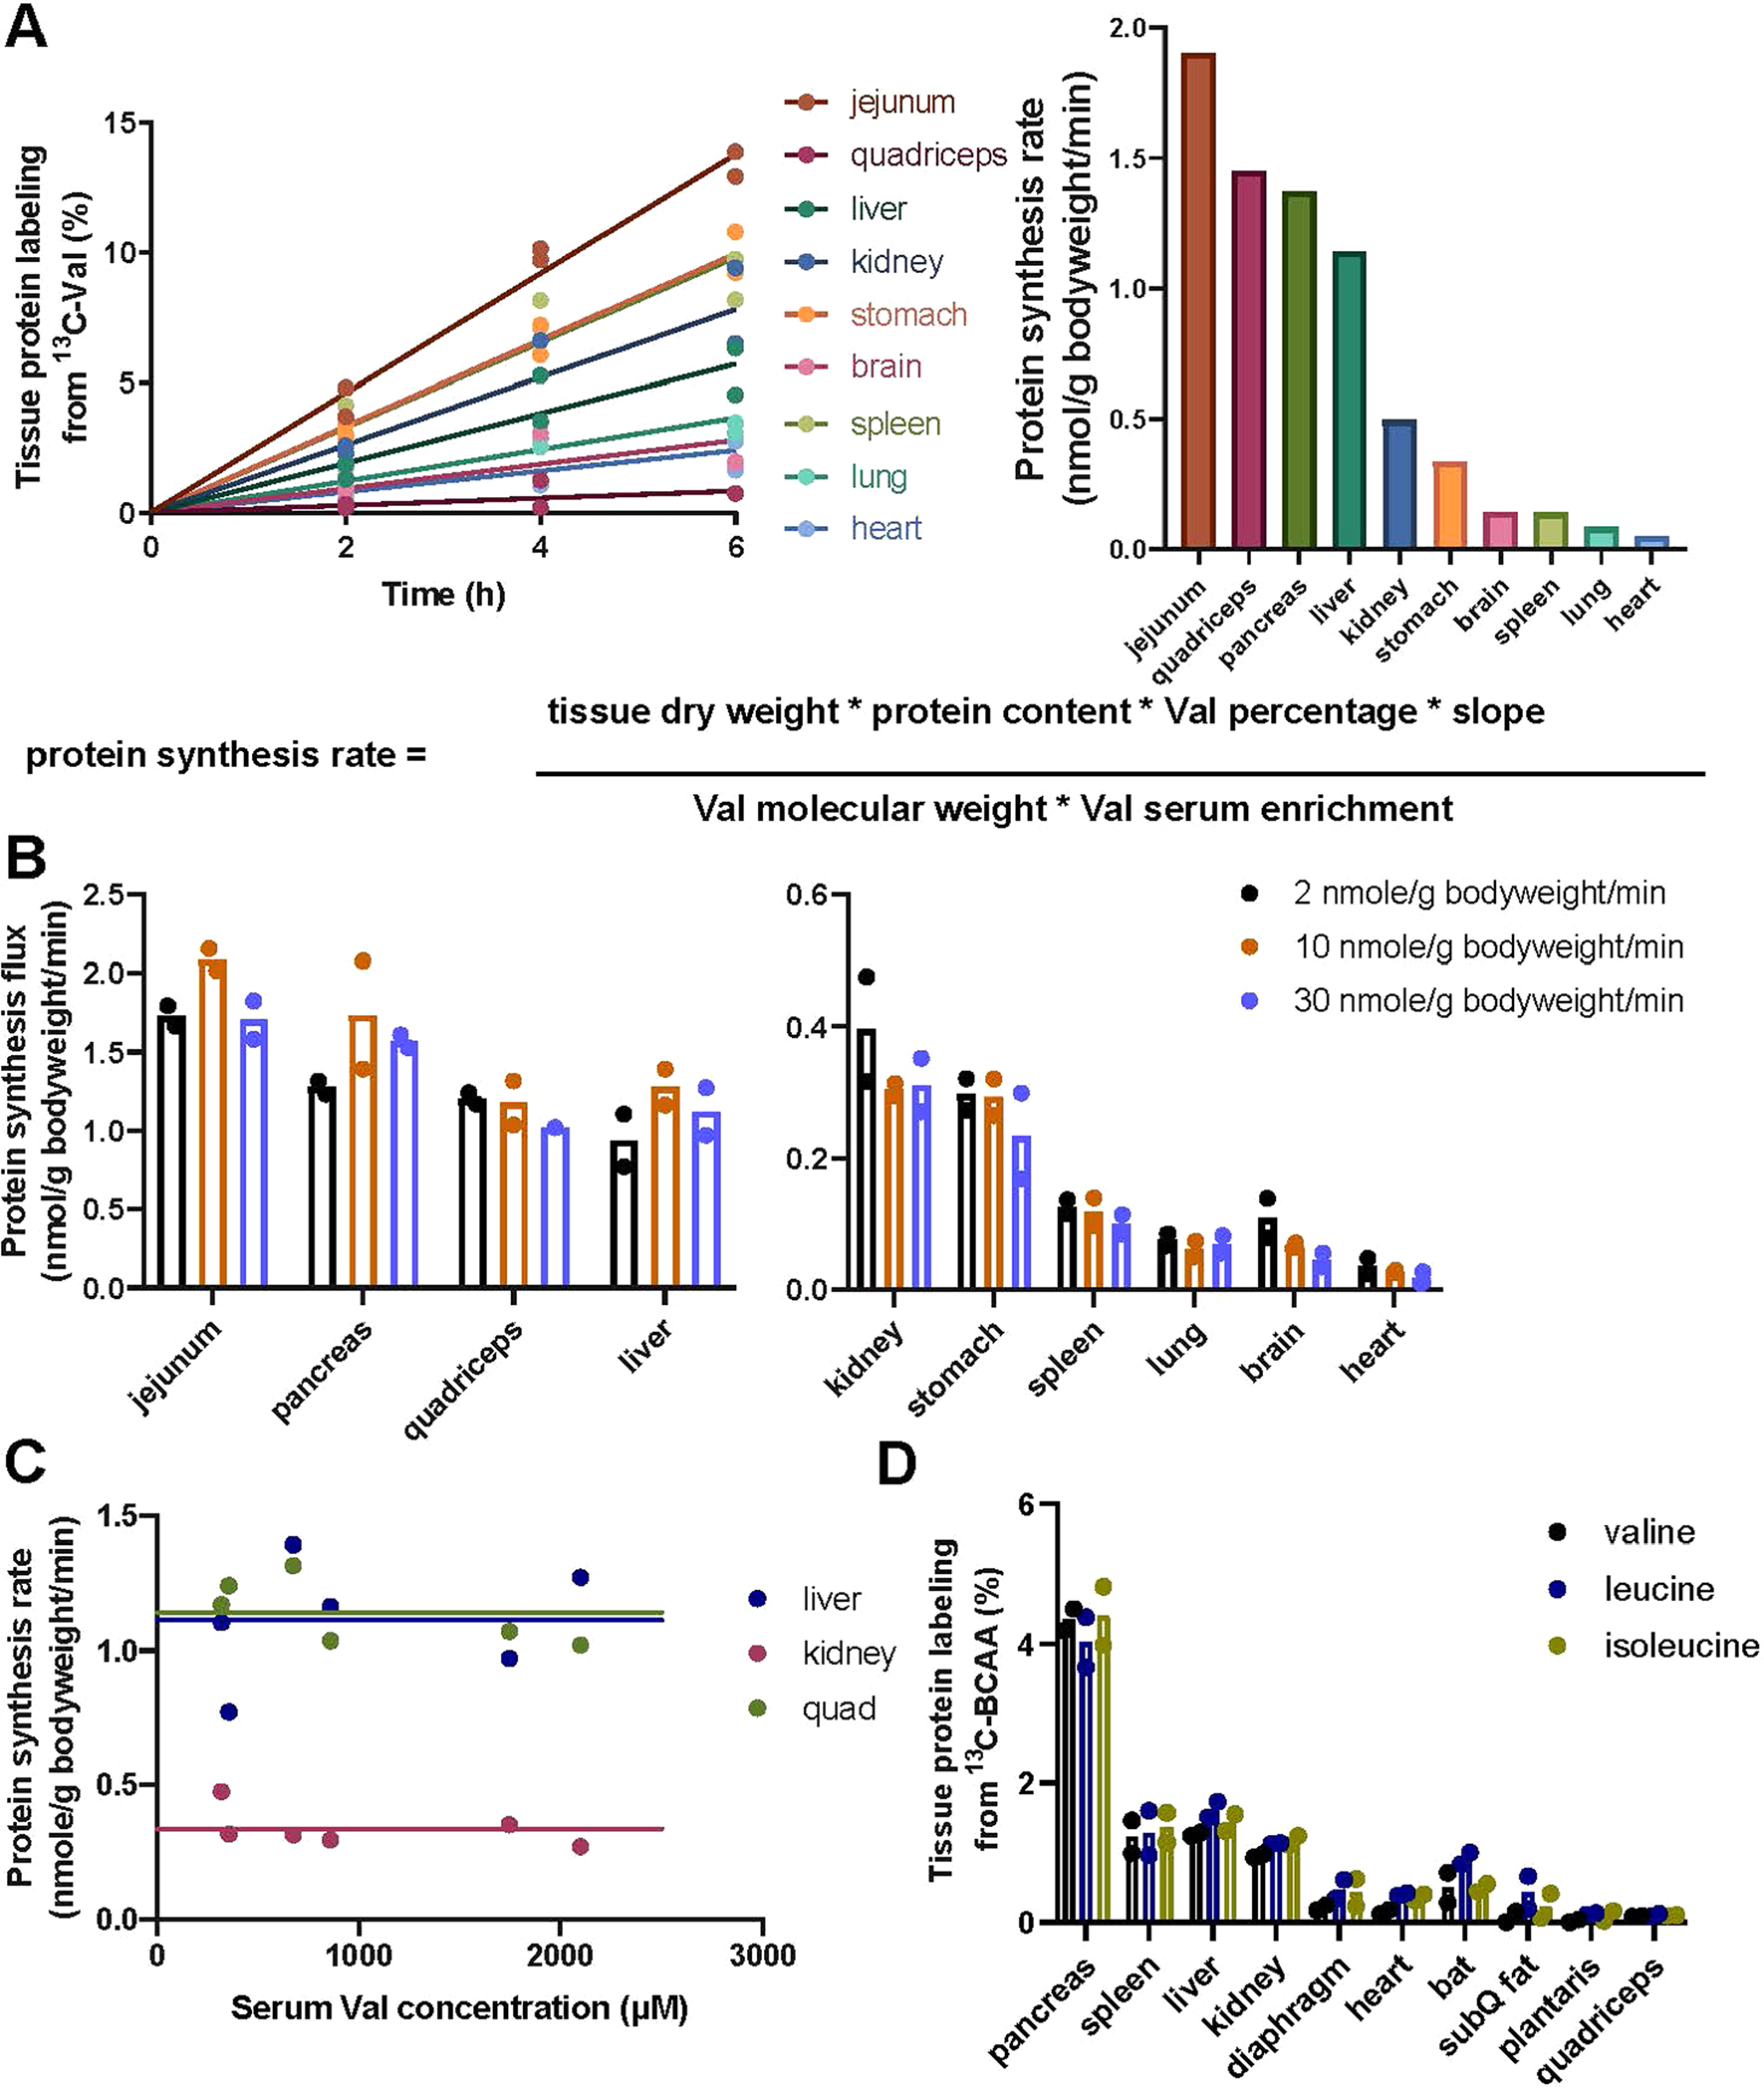
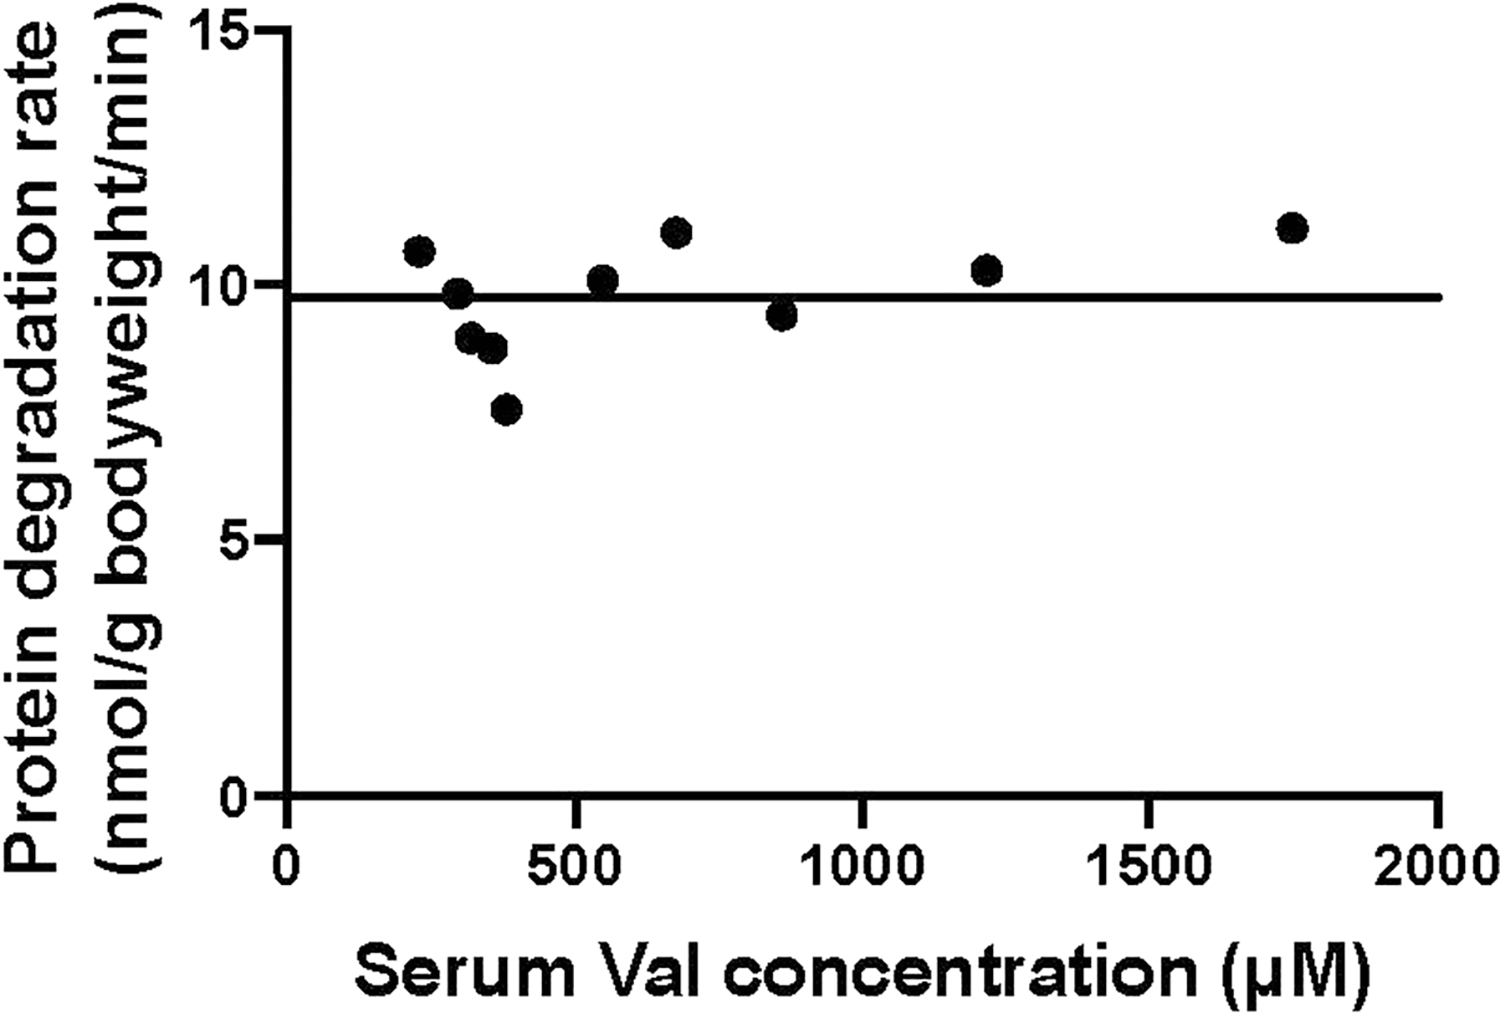
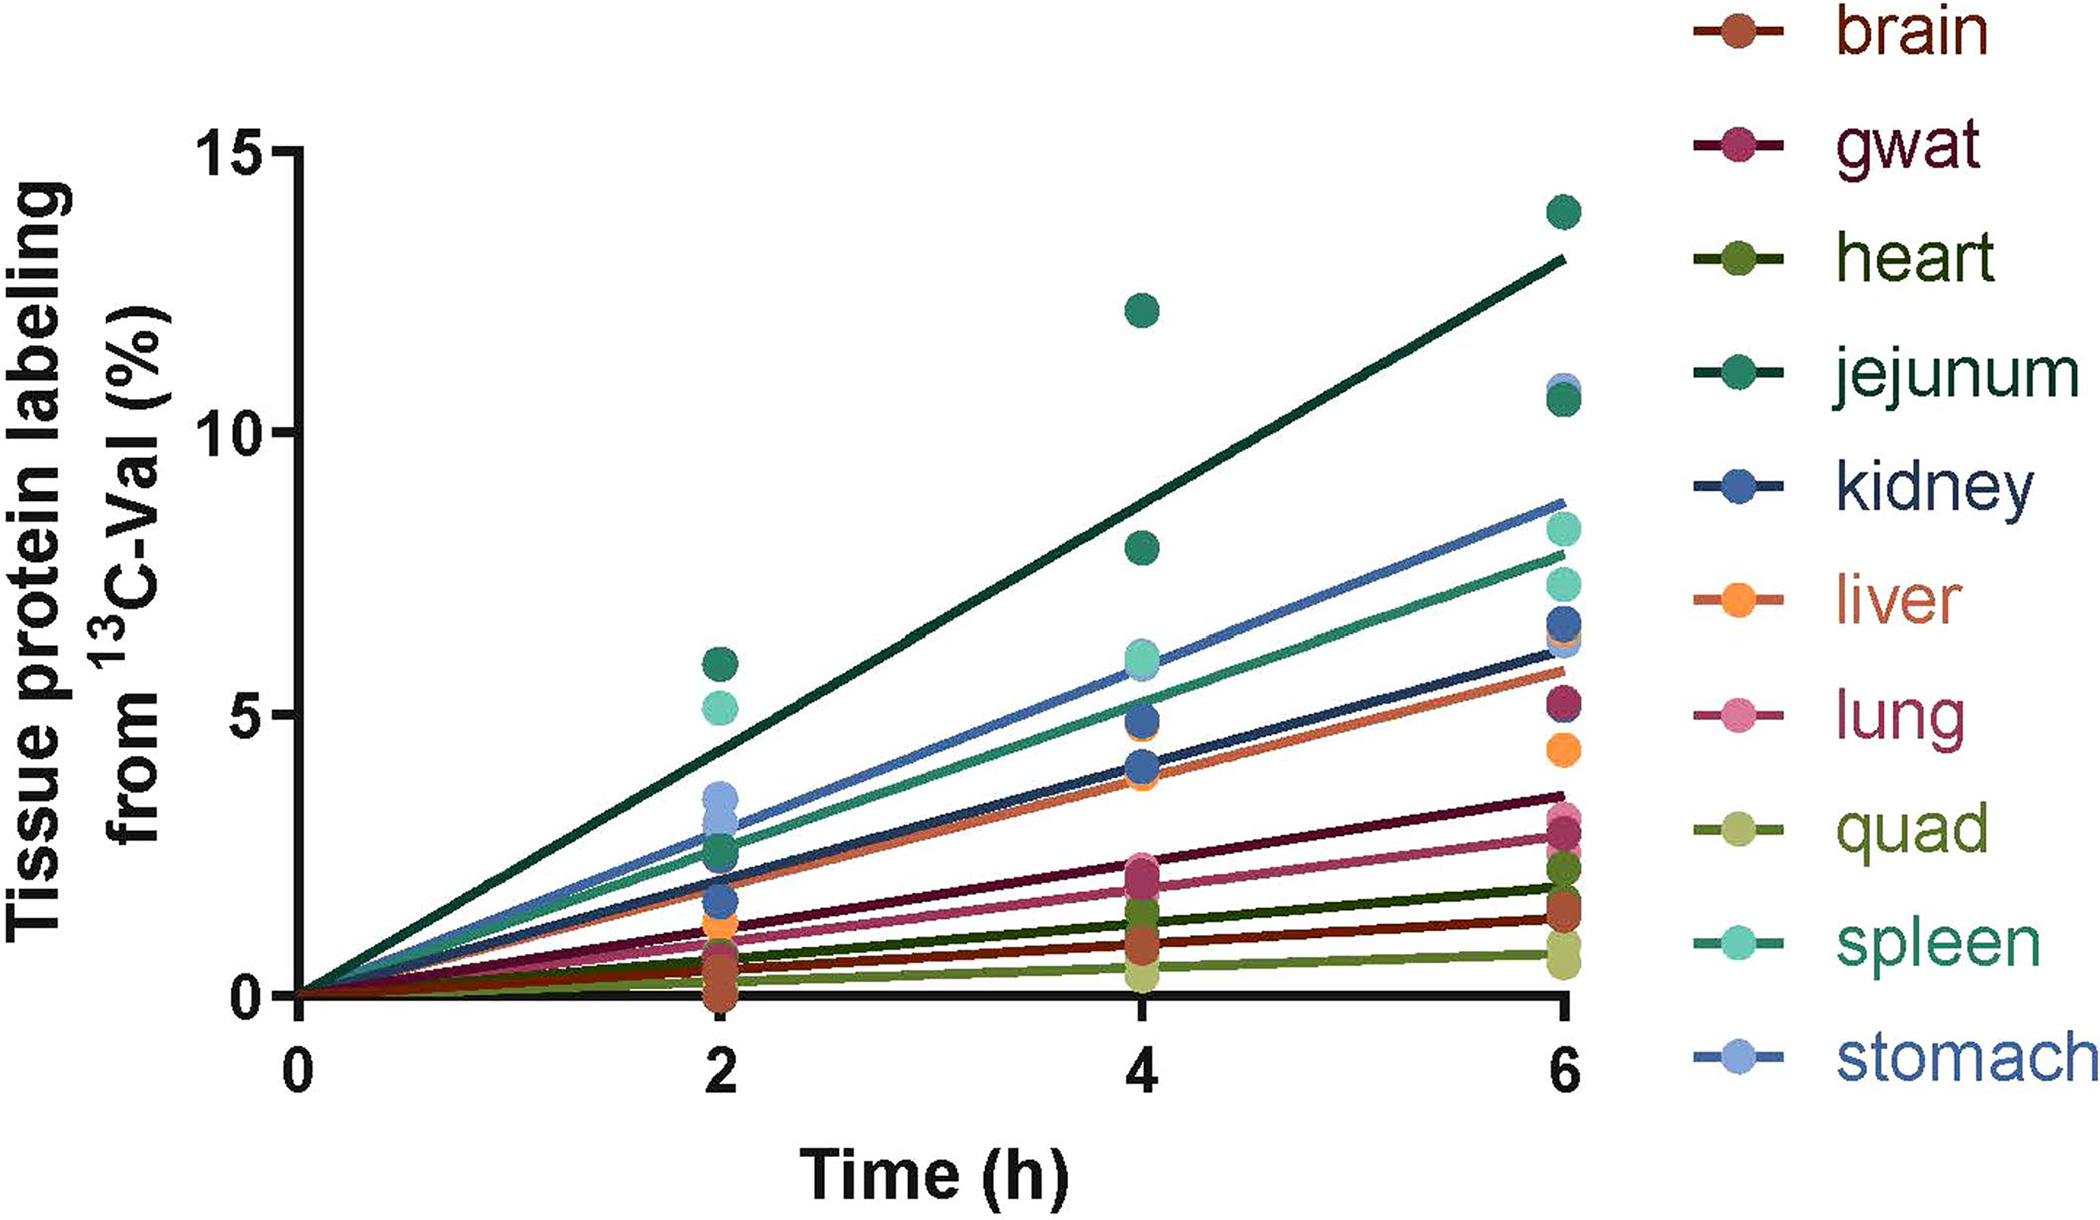
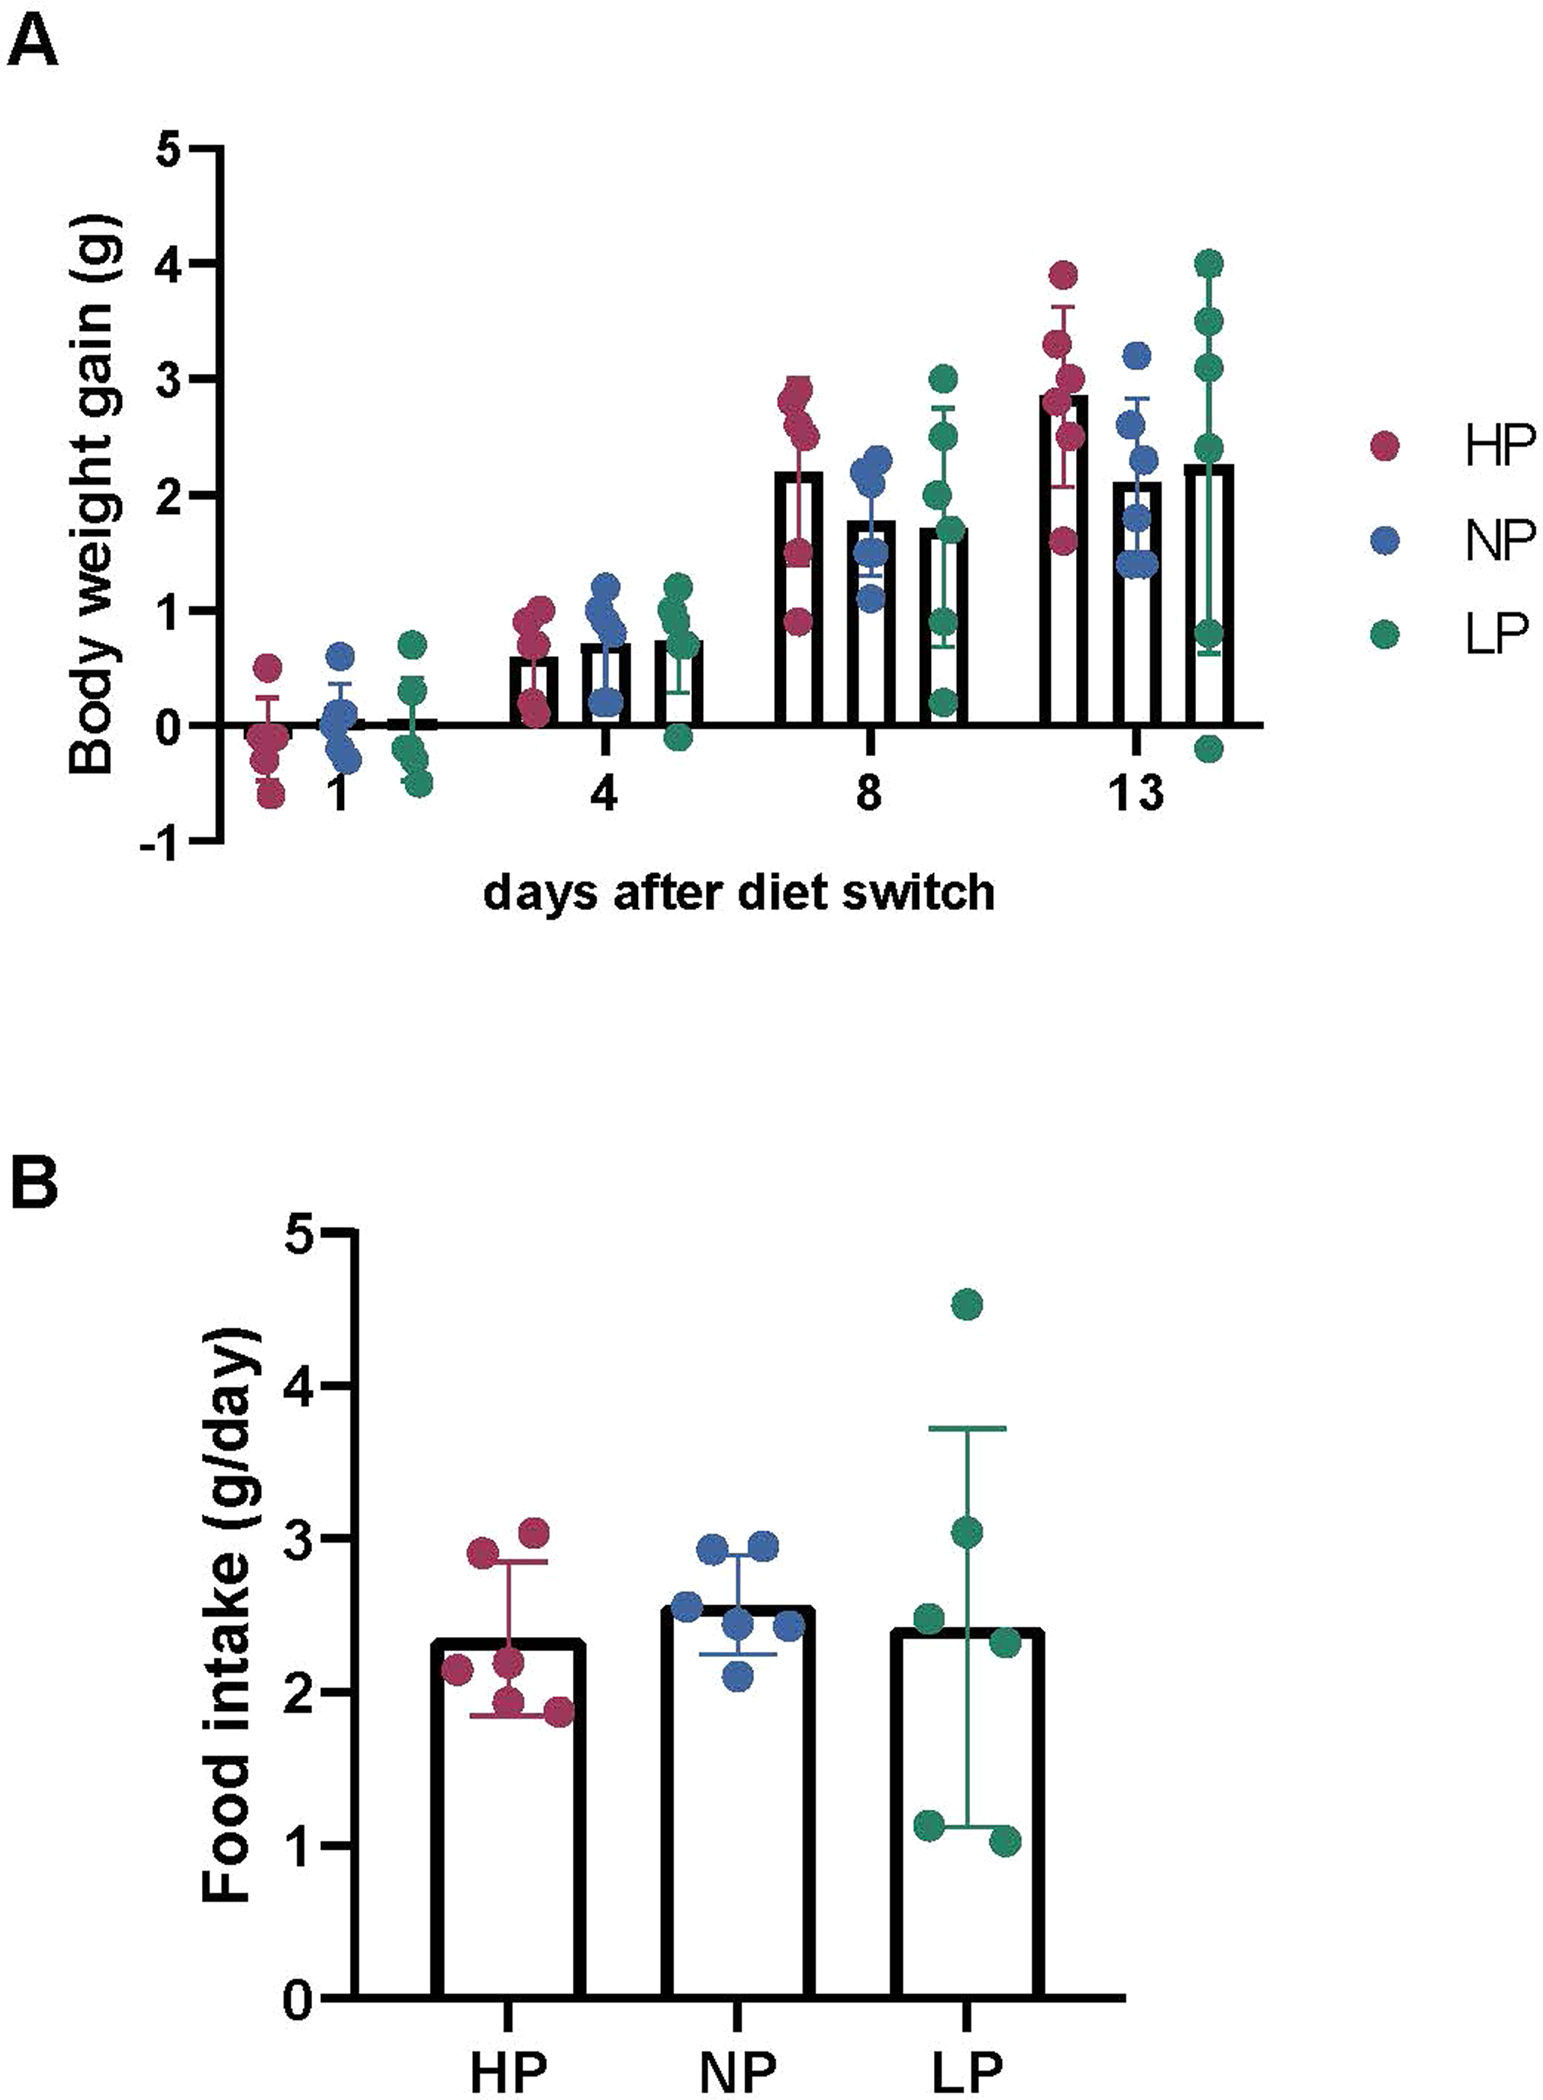
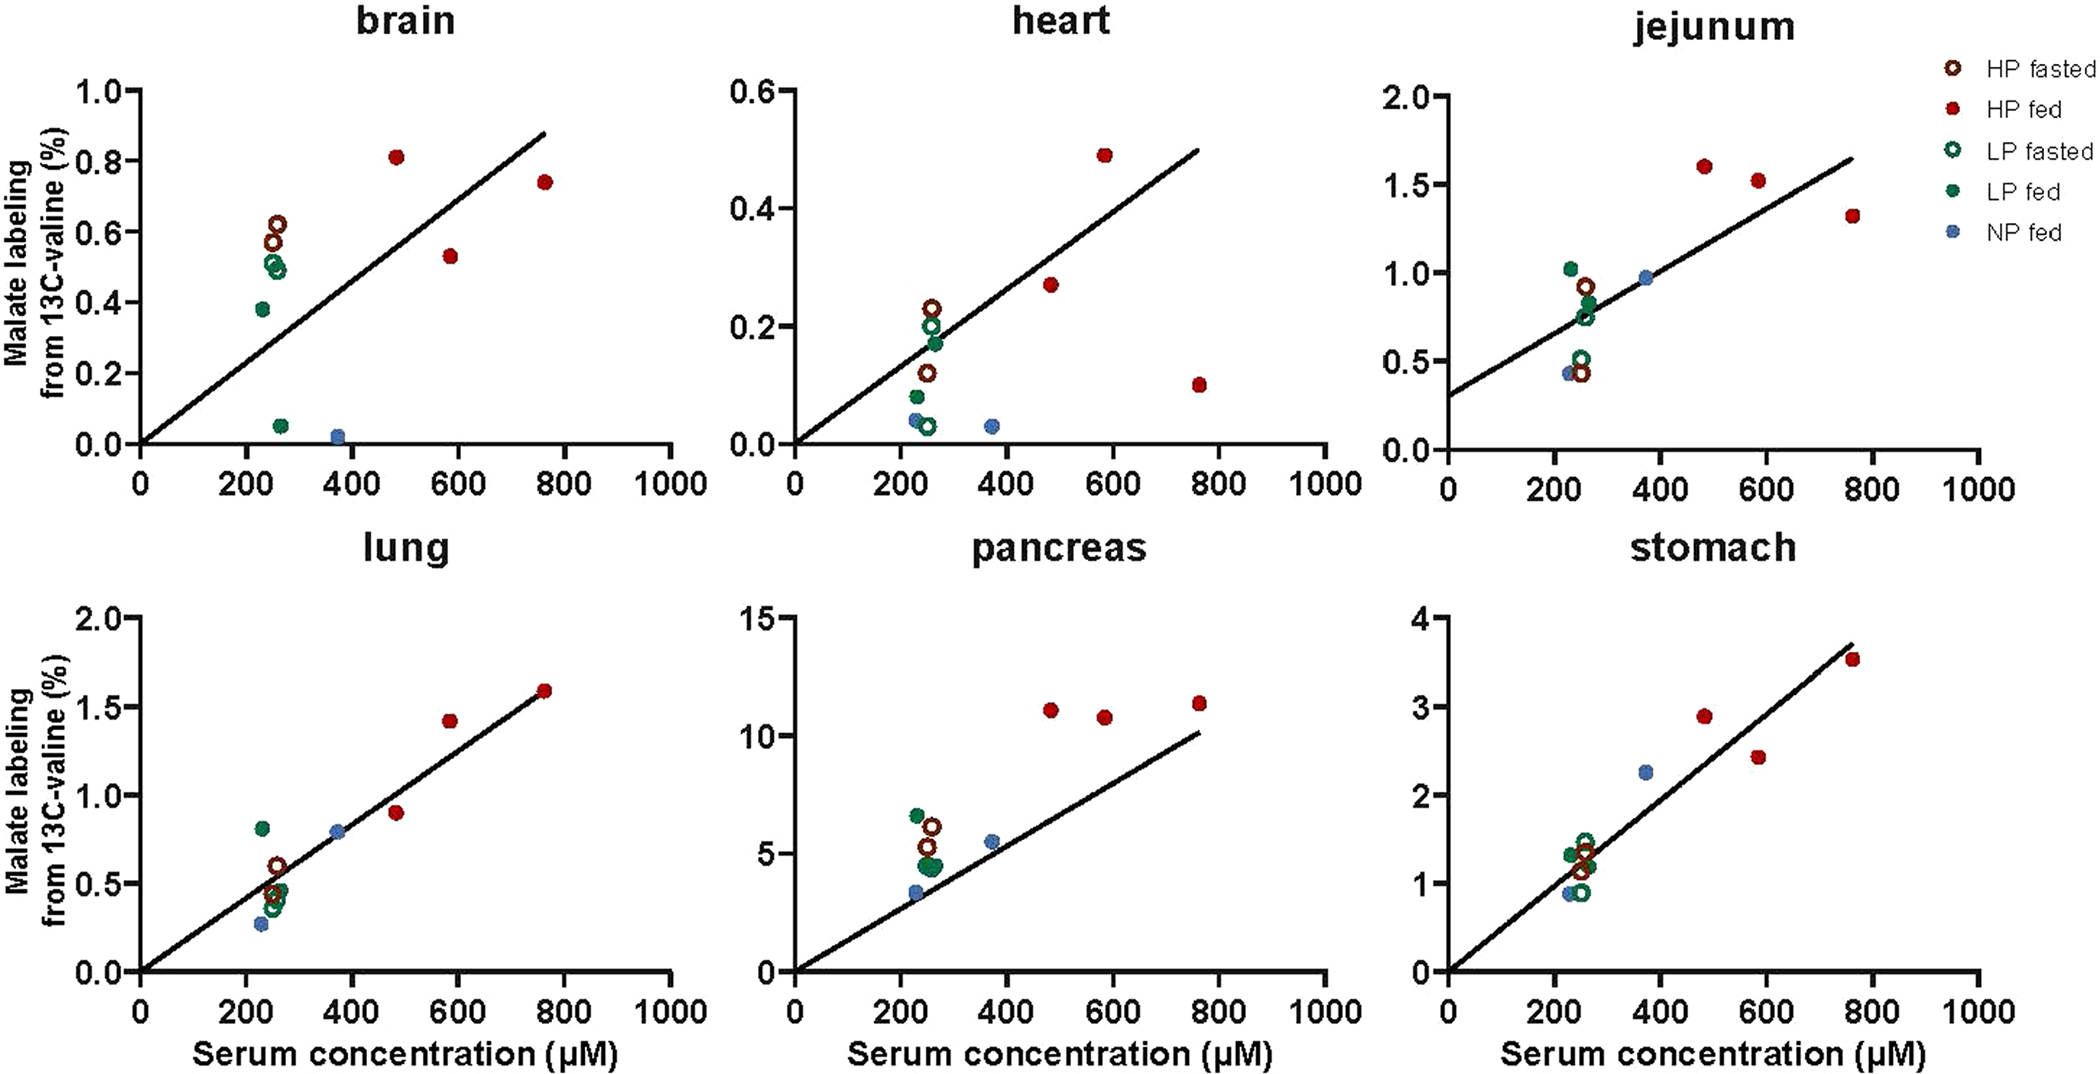
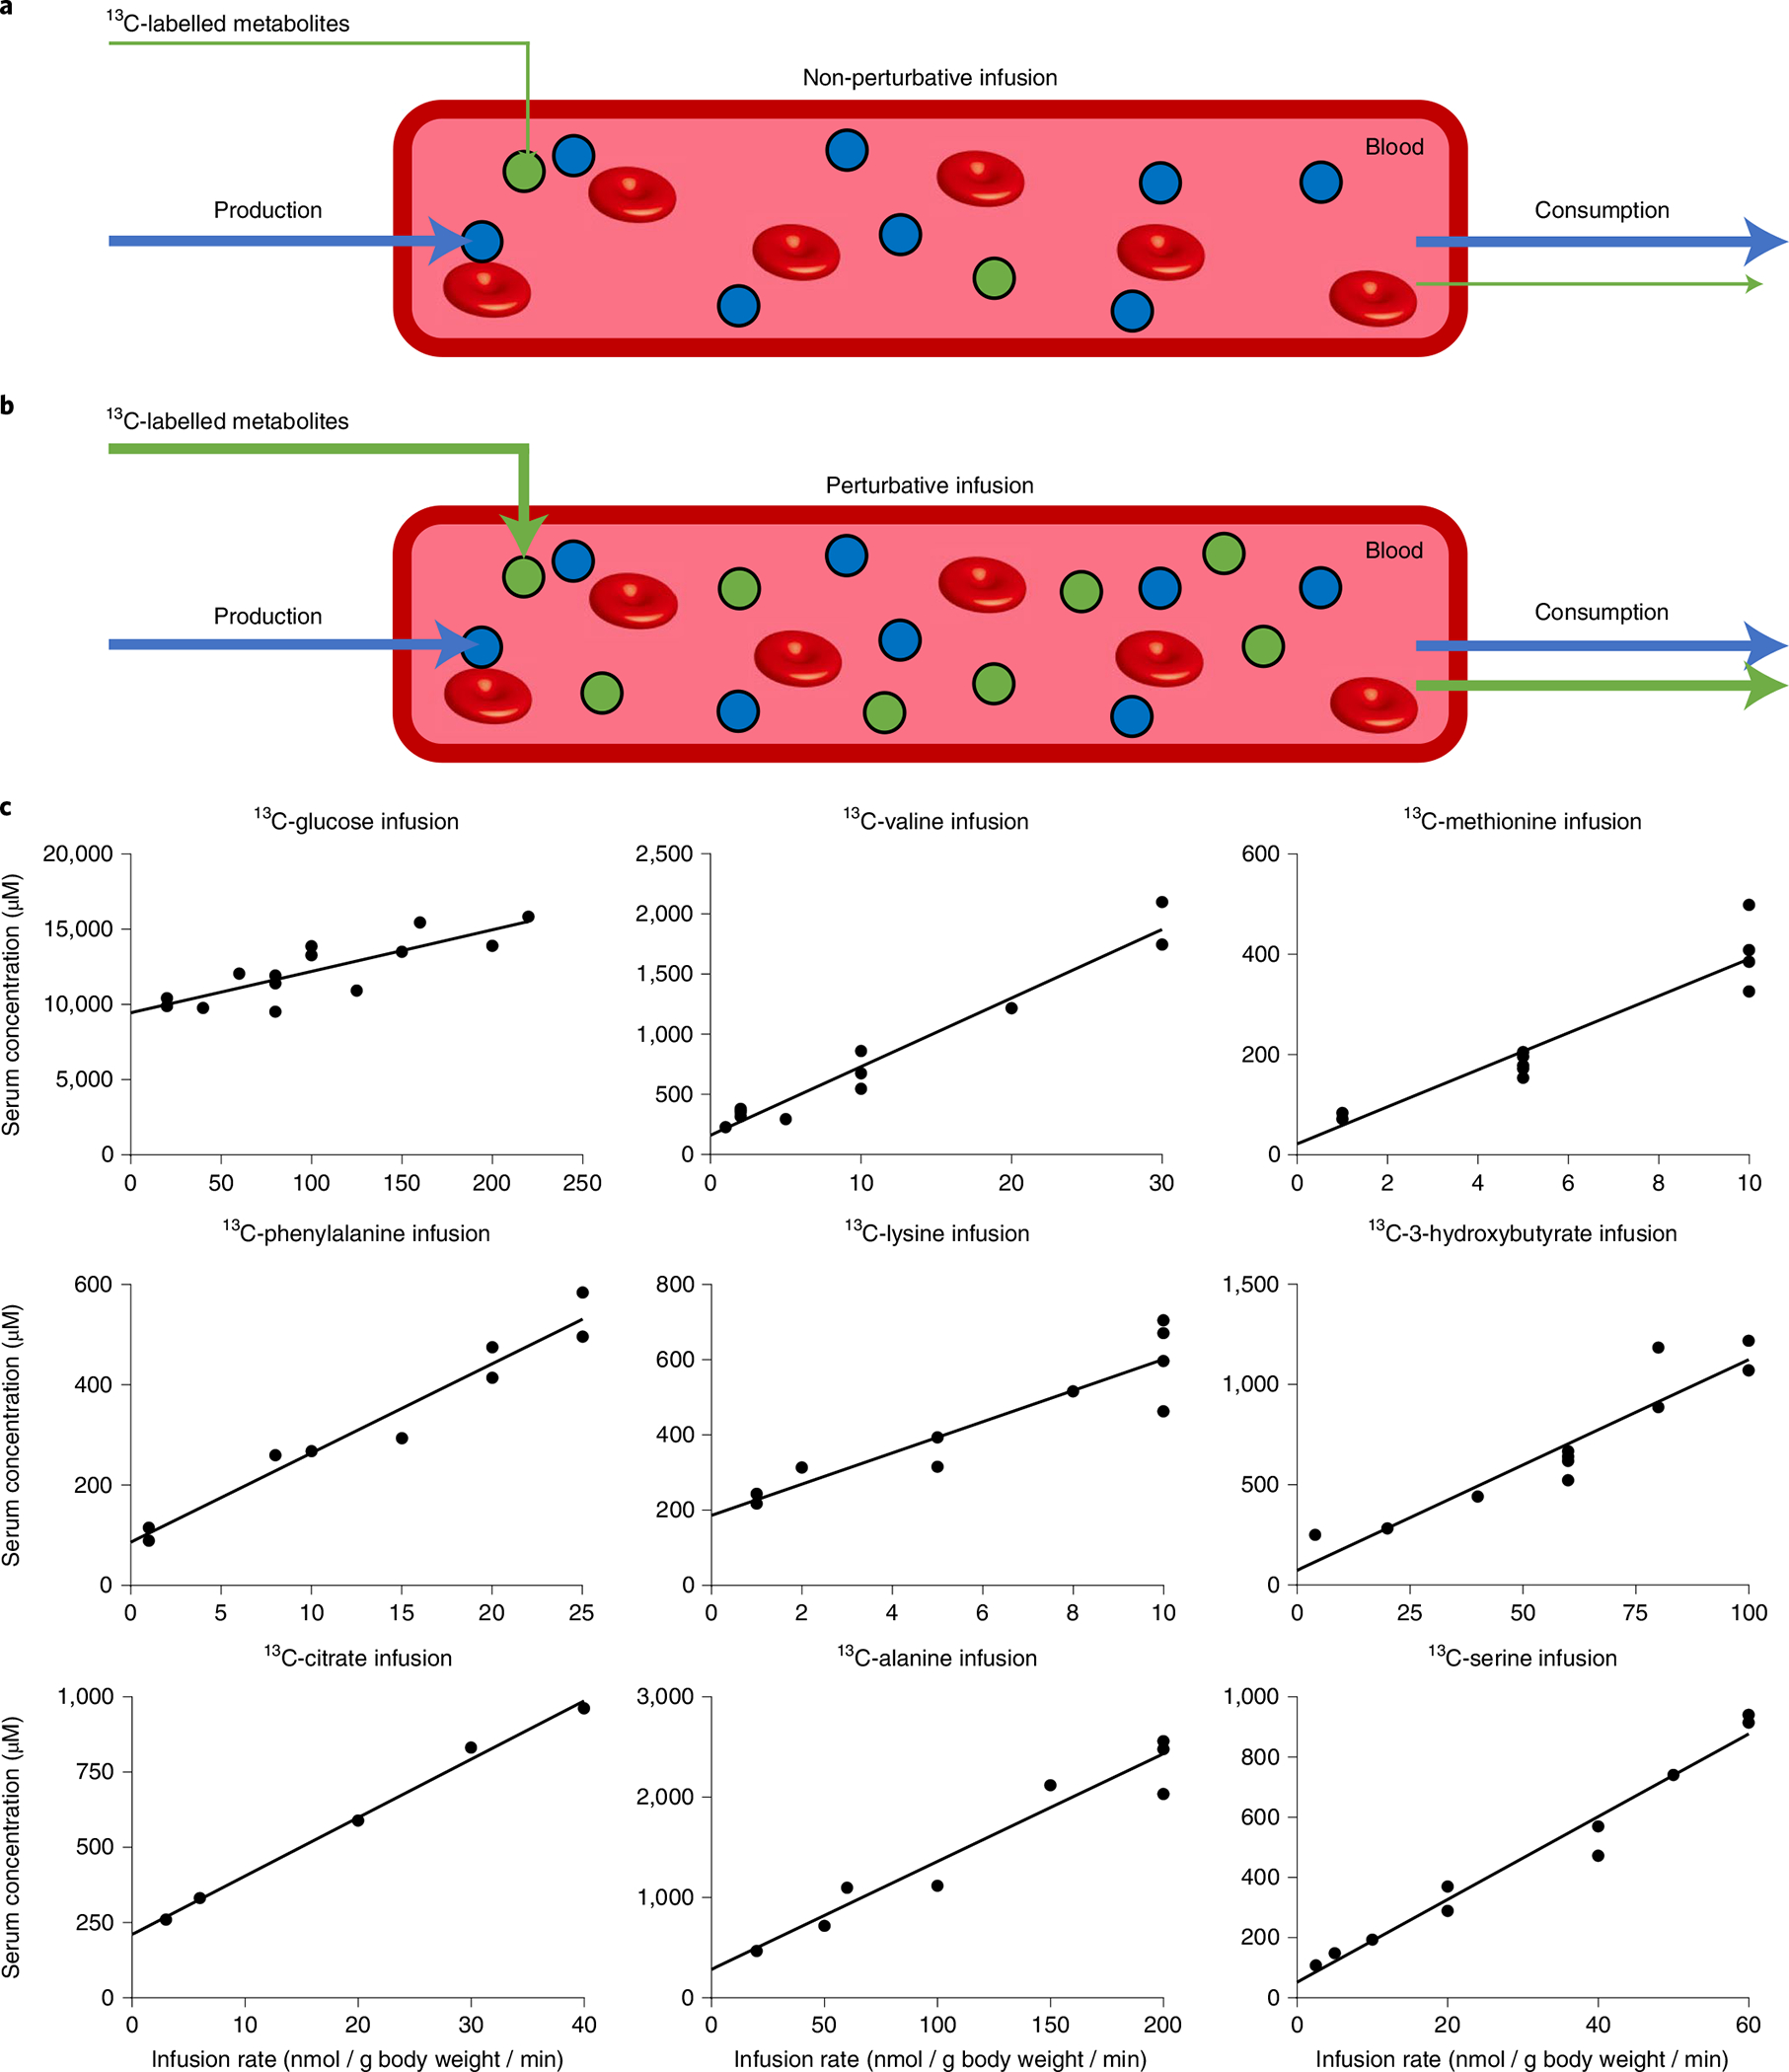
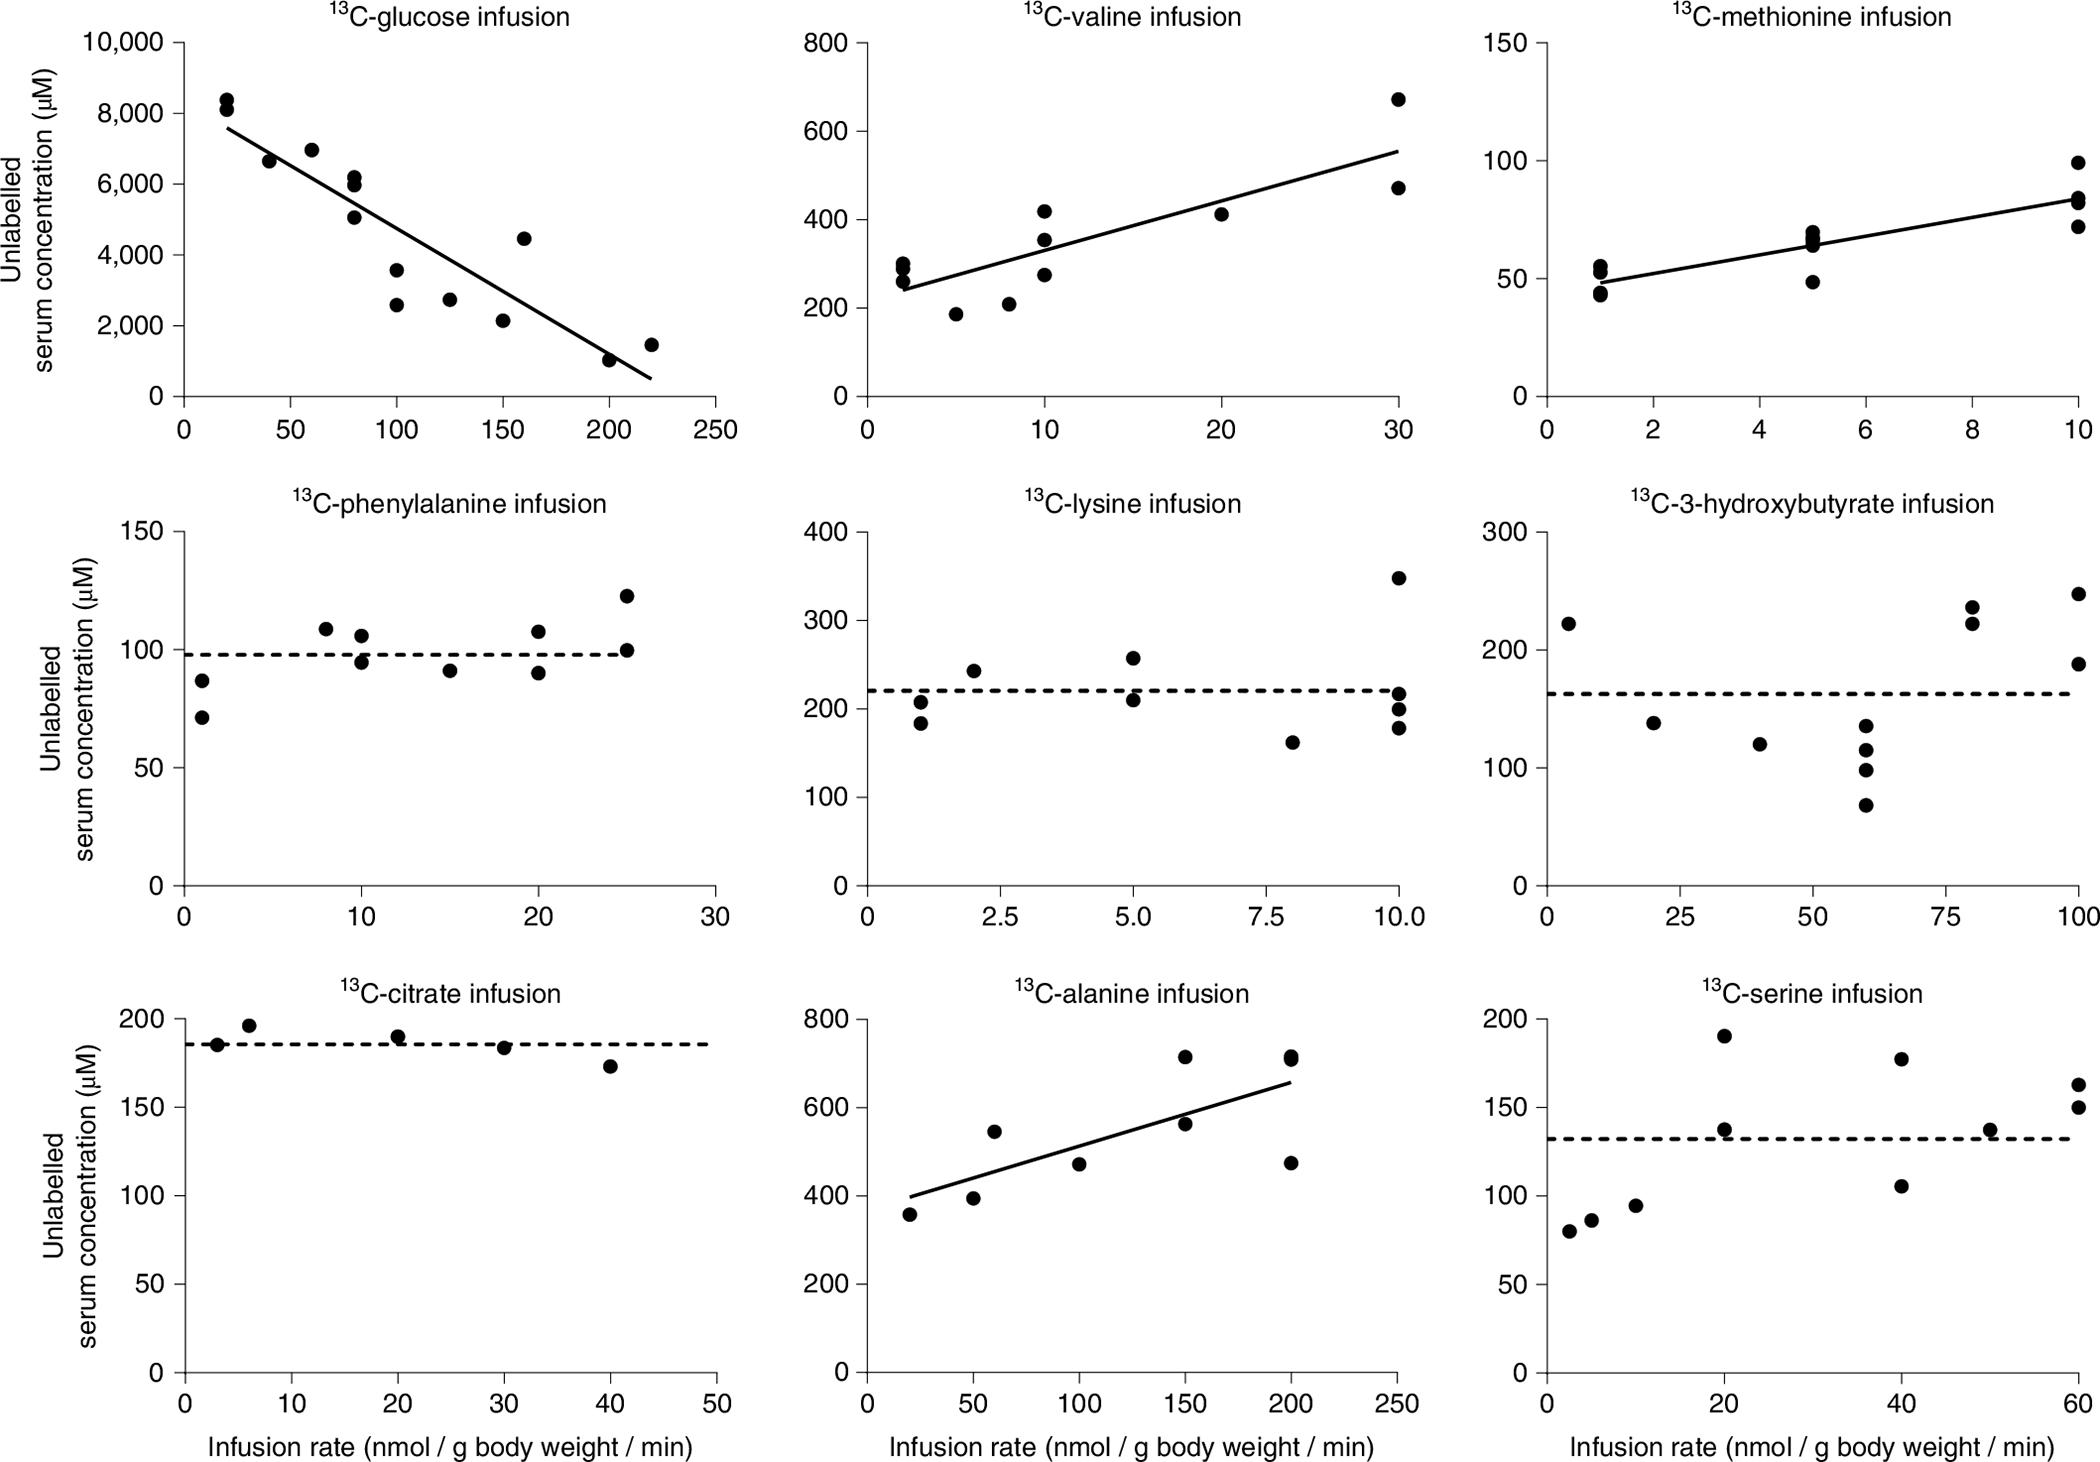
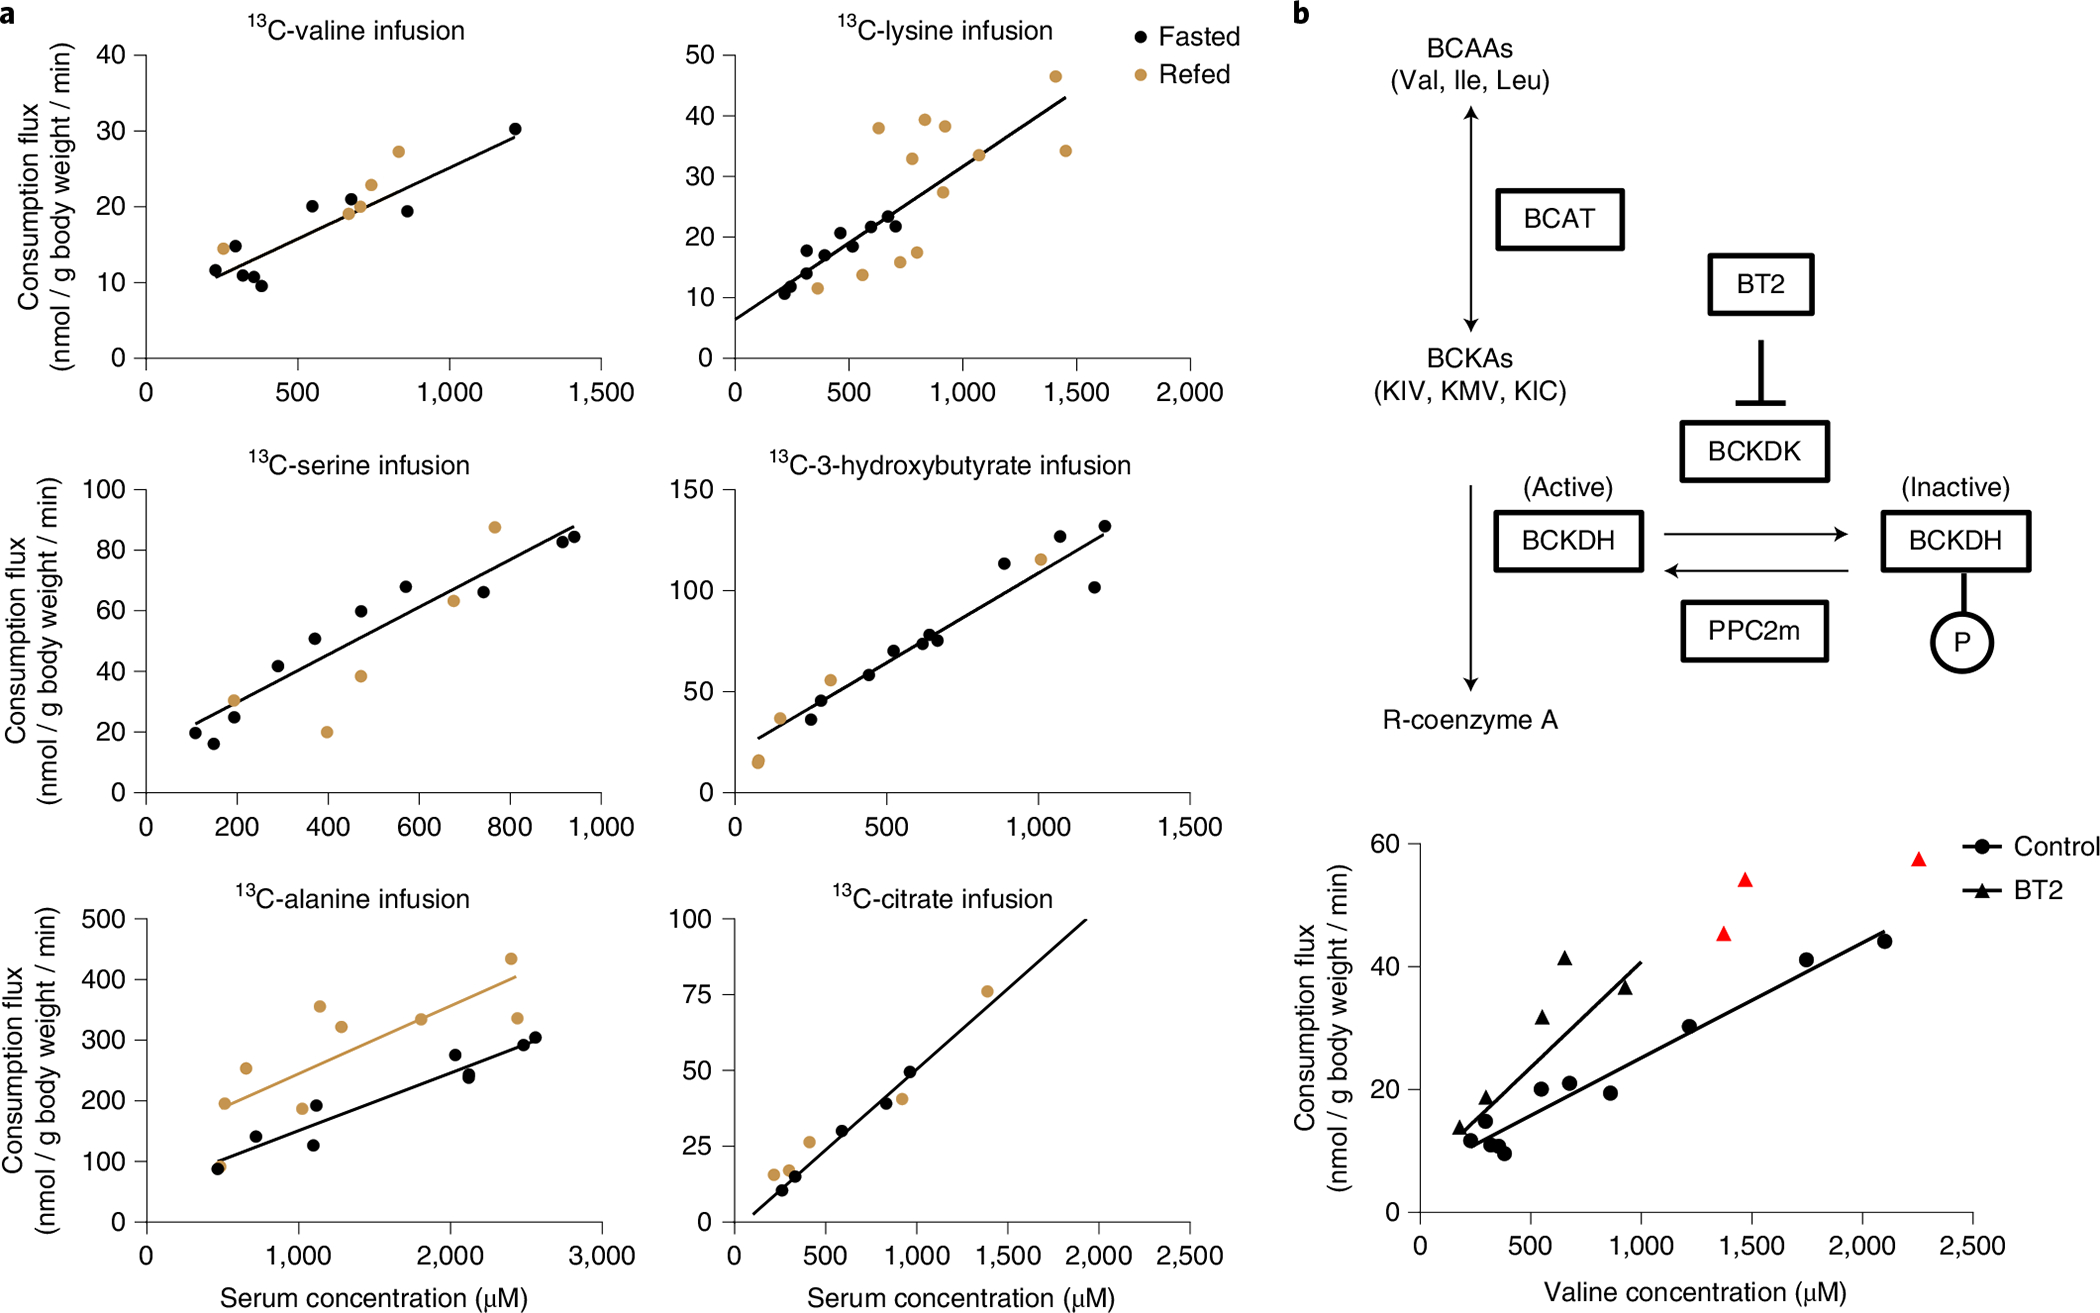
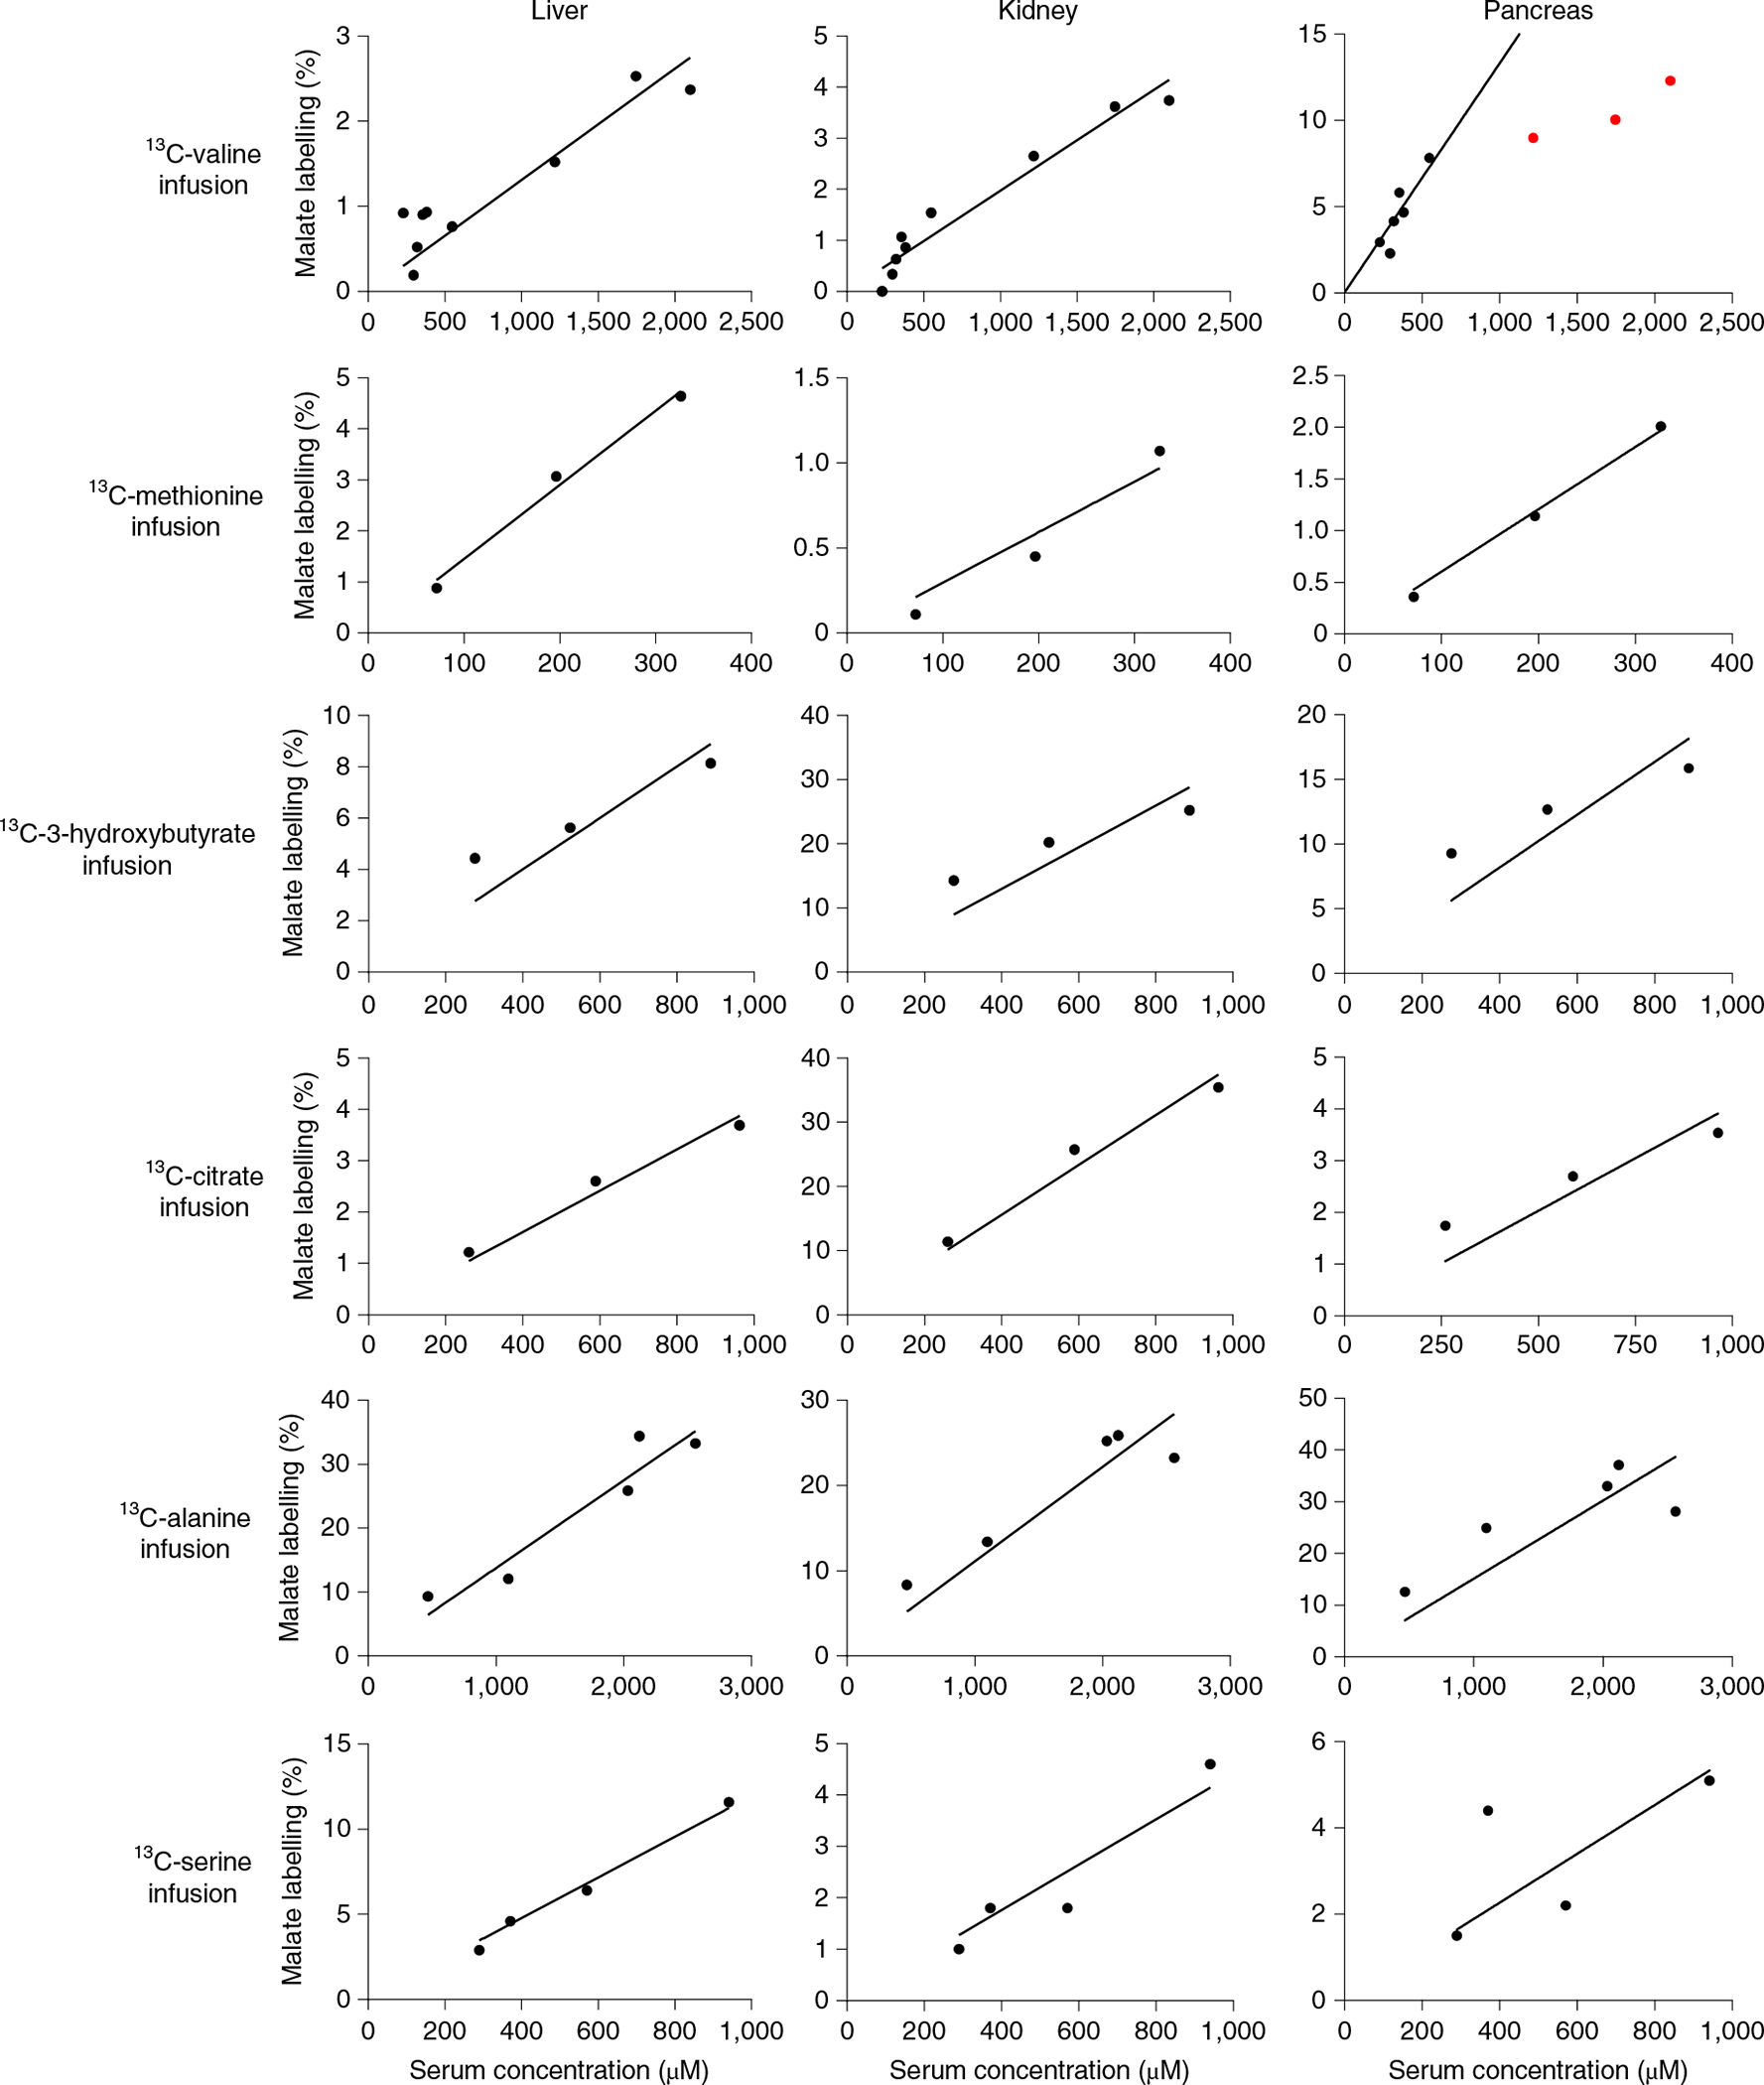
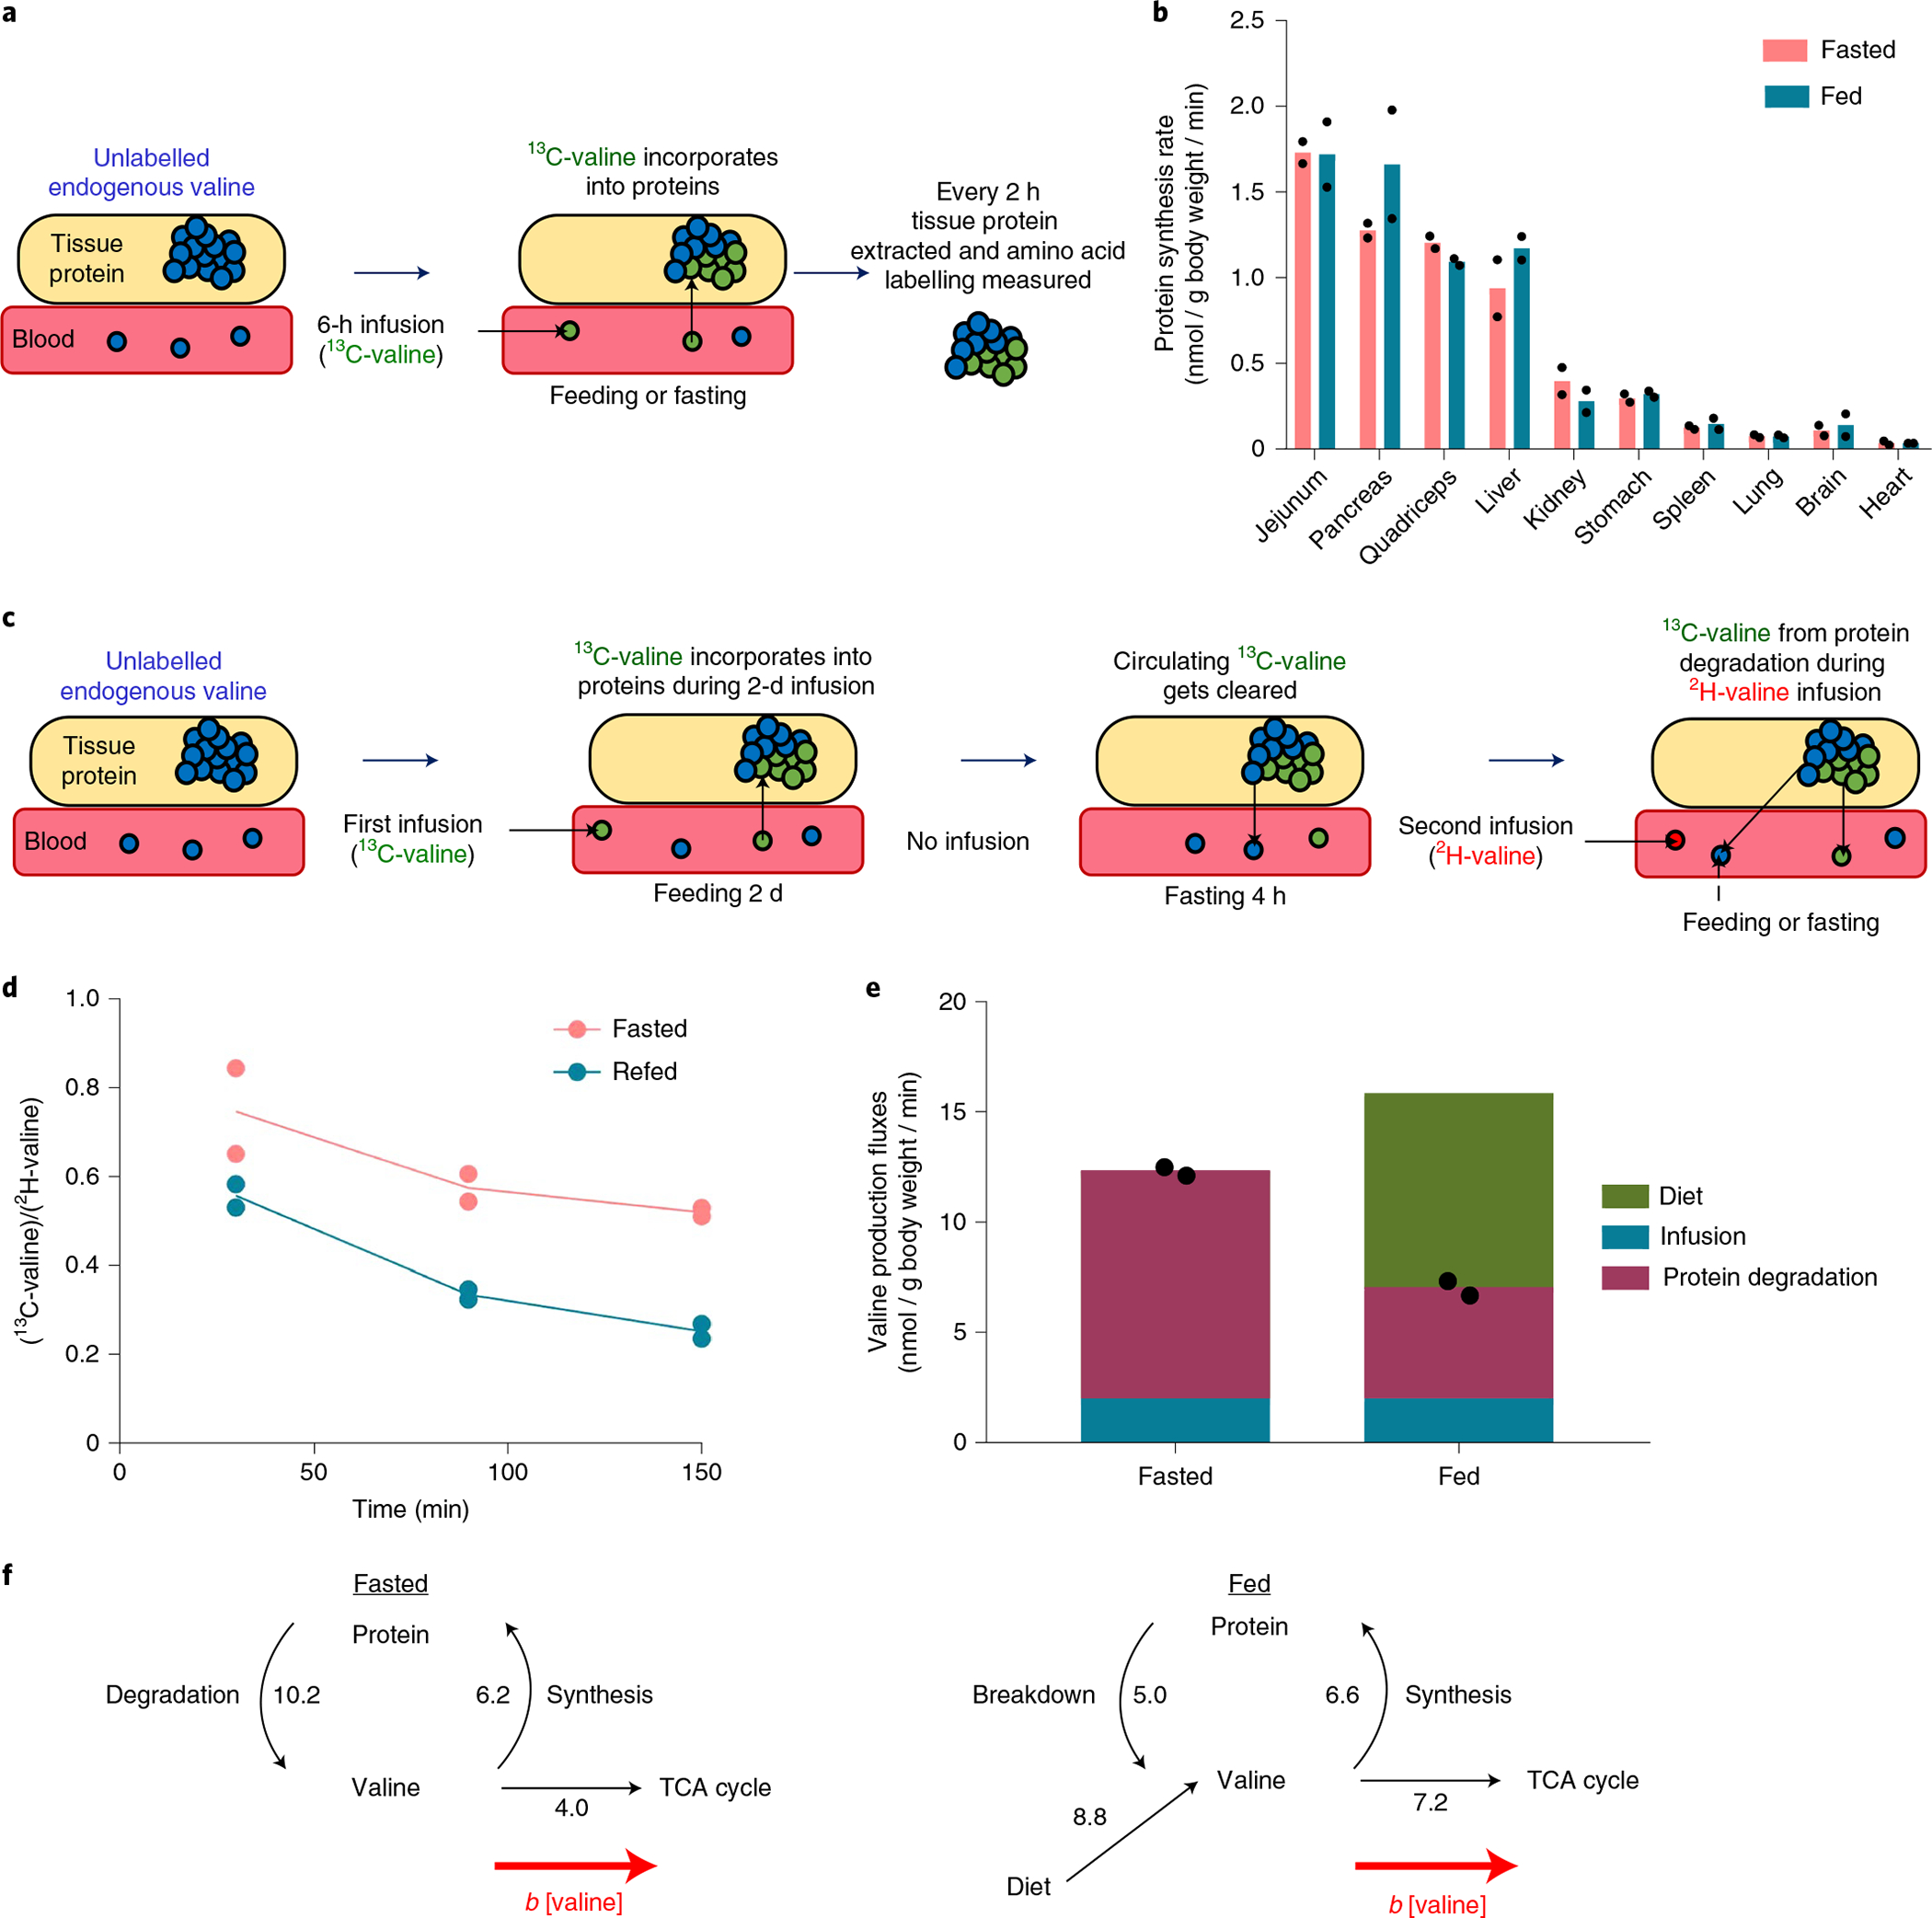
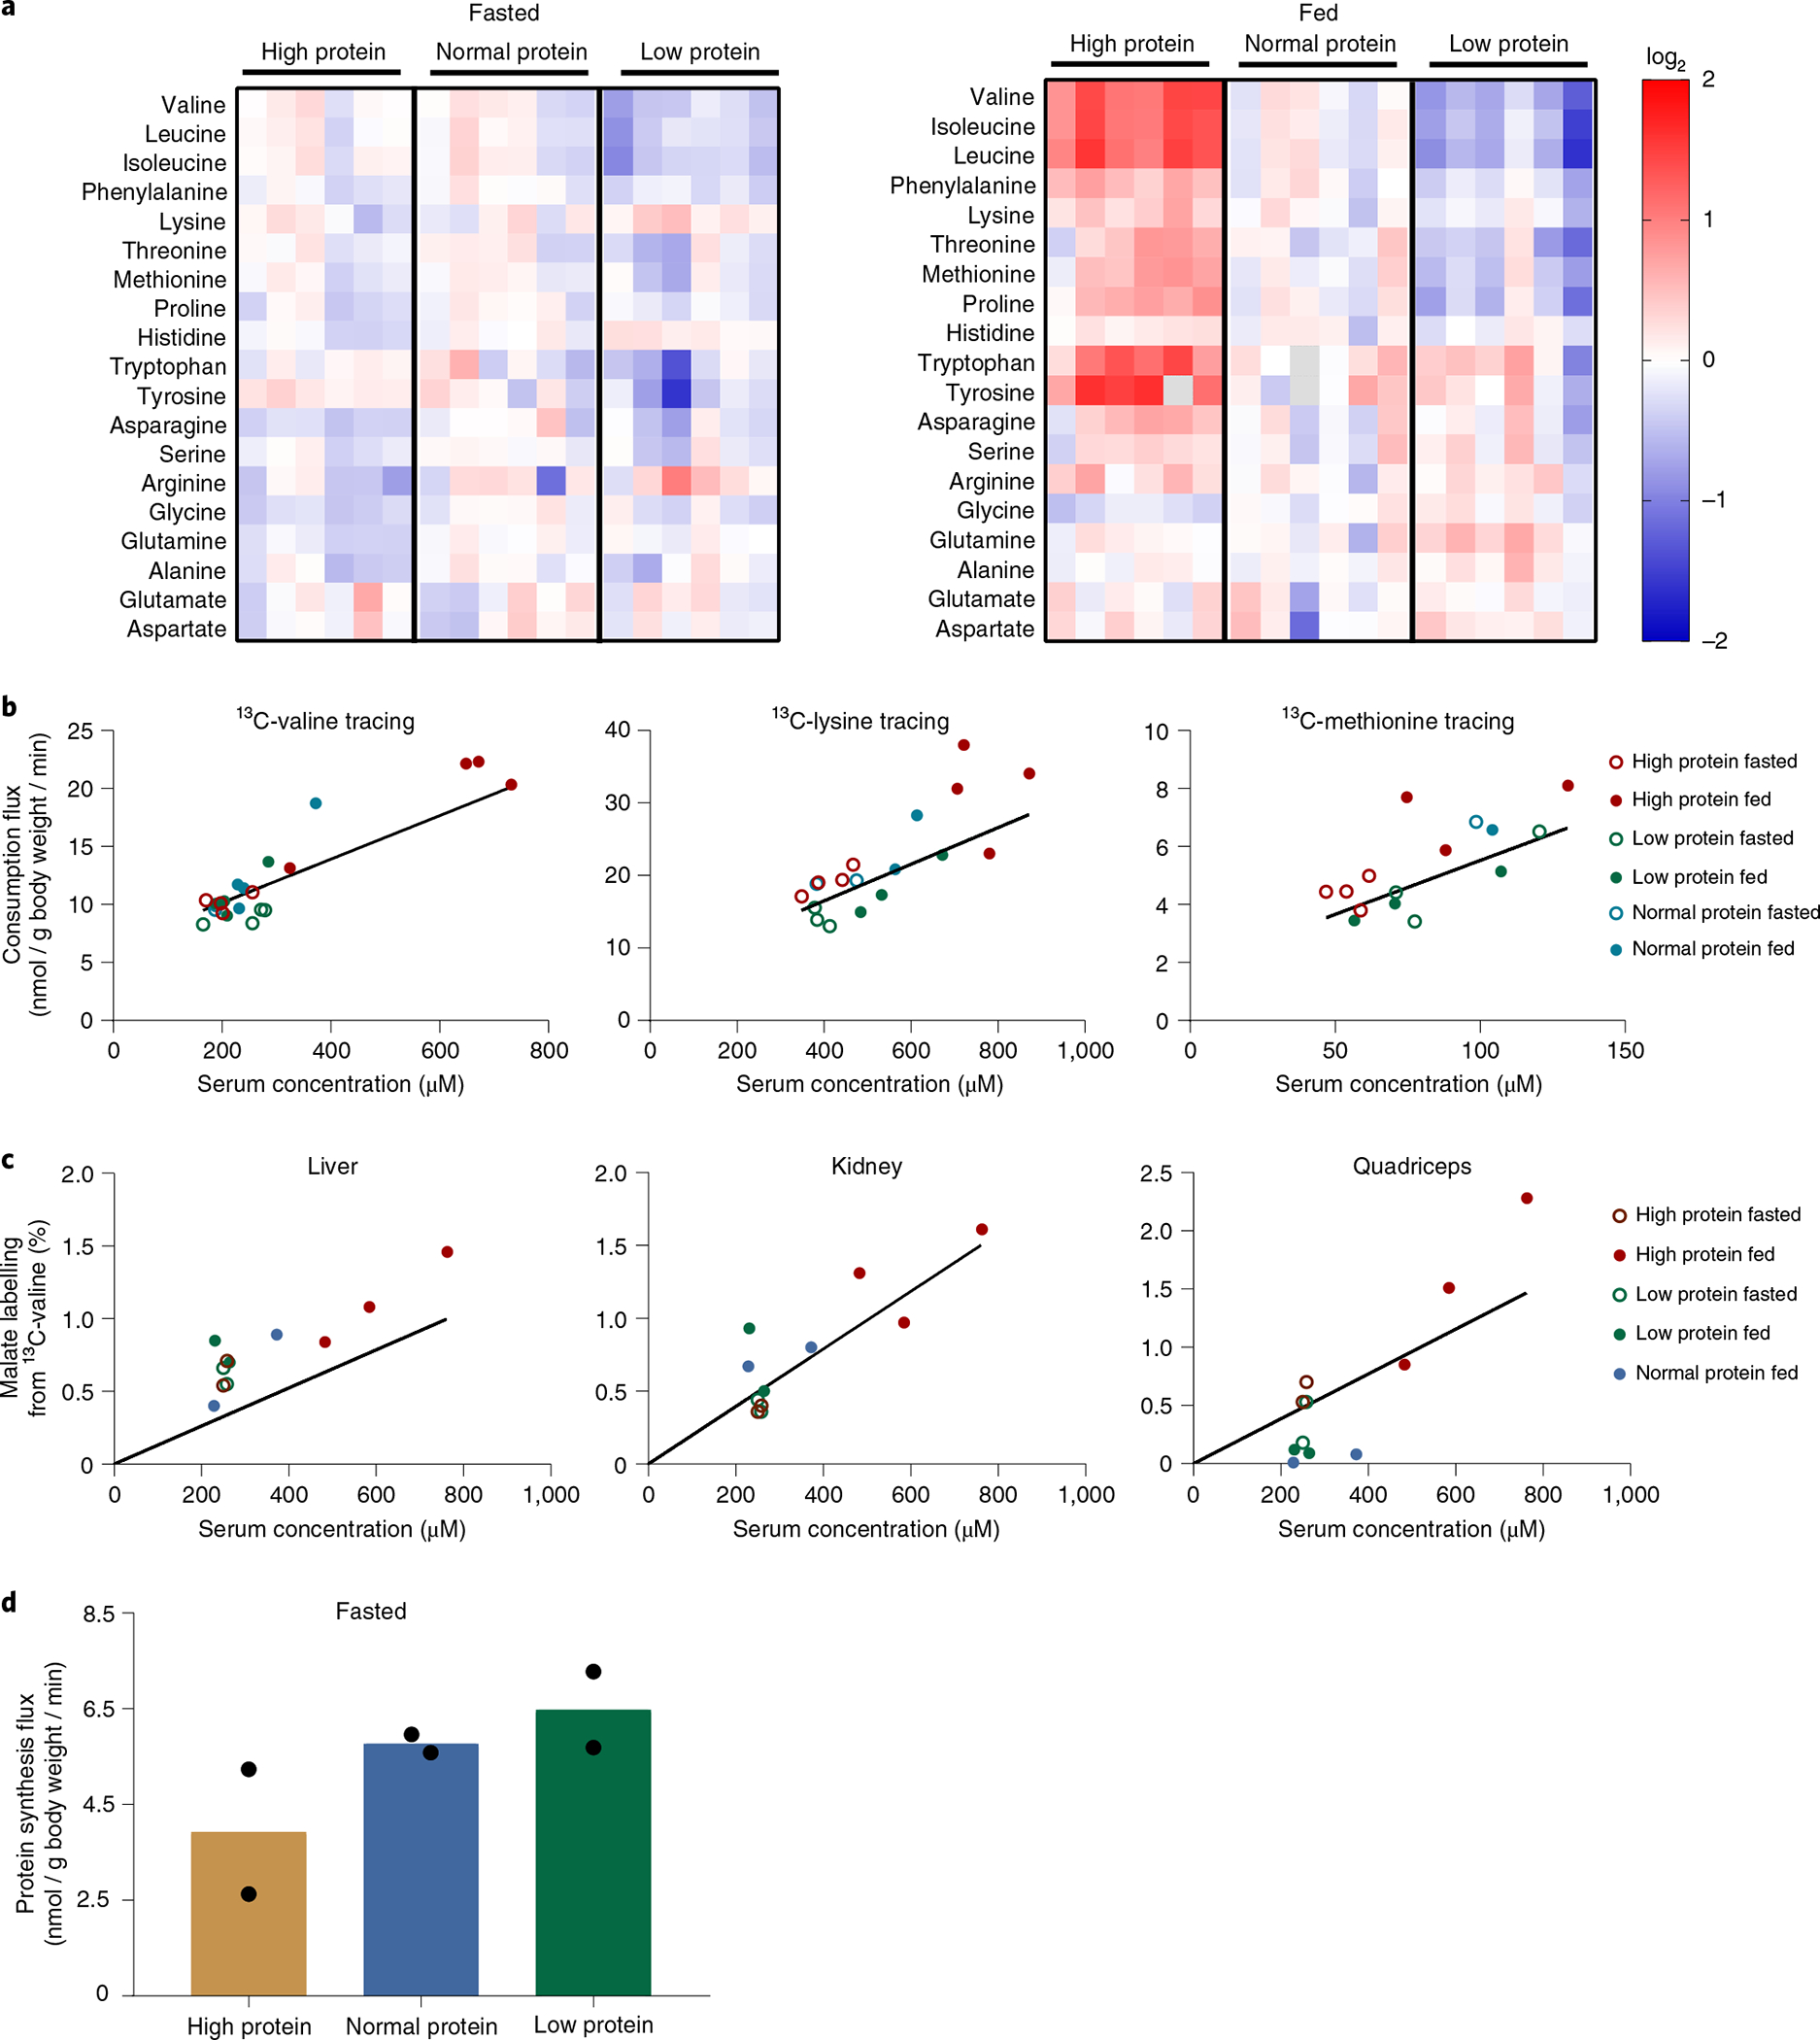
Homeostasis maintains serum metabolites within physiological ranges. For glucose, this requires insulin, which suppresses glucose production while accelerating its consumption. For other circulating metabolites, a comparable master regulator has yet to be discovered. Here we show that, in mice, many circulating metabolites are cleared via the tricarboxylic acid cycle (TCA) cycle in linear proportionality to their circulating concentration. Abundant circulating metabolites (essential amino acids, serine, alanine, citrate, 3-hydroxybutyrate) were administered intravenously in perturbative amounts and their fluxes were measured using isotope labelling. The increased circulating concentrations induced by the perturbative infusions hardly altered production fluxes while linearly enhancing consumption fluxes and TCA contributions. The same mass action relationship between concentration and consumption flux largely held across feeding, fasting and high- and low-protein diets, with amino acid homeostasis during fasting further supported by enhanced endogenous protein catabolism. Thus, despite the copious regulatory machinery in mammals, circulating metabolite homeostasis is achieved substantially through mass action-driven oxidation.


Conflict of interest statement

Competing interests

J.D.R. is a cofounder and stockholder in Toran and Serien Therapeutics and advisor to and stockholder in Agios Pharmaceuticals, Kadmon, Bantam Pharmaceutical, Colorado Research Partners, Rafael Pharmaceuticals, Barer Institute and L.E.A.F. Pharmaceuticals. The other authors declare no competing interests.

Figures

Extended Data Fig. 1 |
Extended Data Fig. 1 |. Perturbative infusion outcomes for different regulatory mechanisms.
Green arrows reflect labeled metabolite fluxes including the experimenter-controlled influx from infusion. Blue arrows reflect unlabeled metabolite fluxes, including endogenous production. Green and blue circles are labeled and unlabeled metabolites, respectively. Red circles represent red blood cells. (a) Mass action. Labeled metabolites accumulate linearly with infusion rate, with unlabeled metabolite concentrations and fluxes not altered. (b) Active consumption induction. Labeled metabolites accumulate less than linearly with infusion rate, with unlabeled metabolite levels decreased but fluxes unaltered. (c) Consumption saturation. Labeled metabolites accumulate more than linearly with infusion rate, with unlabeled metabolites levels increased but fluxes unaltered. (d) Feedback inhibition of production. Unlabeled metabolite levels and fluxes are decreased.
Extended Data Fig. 2 |
Extended Data Fig. 2 |. Clearance of metabolite boluses is consistent with mass action kinetics.
(a) Mice were fasted from 9 AM to 5 PM (8 h fasting). At 5 PM, mice were injected with an intravenous bolus of the indicated [U-13C] metabolite at a low, medium, or high dose (as specified in the methods). Blood was taken 5, 15, 30, and 60 min after the injection, and the concentration of labeled metabolite in serum was measured by LC-MS. For experiments involving branched-chain amino acids, all three were given together, with only the indicated amino acid in labeled form. Labeled metabolite concentration was plotted against time post bolus. Lines are exponential decay curves fitted with mean value of each group. (b) Pseudo-first-order consumption rate constants from bolus and perturbative infusions. The slopes (α) calculated from the infusion experiments were plotted against the elimination constants (γ) calculated from the bolus experiments for each circulating metabolite. Line is linear regression fit.
Extended Data Fig. 3 |
Extended Data Fig. 3 |. Elevated portal vein alanine in fed mice.
(a) Circulating metabolite concentrations in the fasted and refed state. Fasting and feeding schedules were the same as Fig. 4a. Blood was taken at 5 PM for the fasted group and 11 PM for the refed group. Mean±SD. n = 4 mice. (b, c) Insulin does not alter concentrations or consumption fluxes of valine, lysine, and alanine. (b) Serum metabolite levels from hyperinsulinemic-euglycemic clamp (2.5 mU/kg/min insulin) and control (saline) experiments. Mice were fasted from 10 AM to 5 PM. The clamp was performed from 3 PM to 5 PM and blood was collected at 5 PM. Mean±s.d. n = 4 mice. (c) Consumption fluxes in the above clamp condition based on non-perturbative infusion of a mixture of 13C-valine, 13C-lysine, and 13C-alanine. The 13C-infusion was initiated 2.5 h prior to starting insulin to induce the hyperinsulinemic clamp and continued throughout the clamp experiment. Blood samples were taken immediately prior to or 120-min after initiation of the clamp. Mean±s.d. n = 4 mice. (d) Metabolite concentration ratios between the portal vein and tail vein of fasted (7.5 h fast starting at 9:30 AM, with sampling at 5 PM) or ad lib fed mice (with sampling at 11 PM). Mean±s.d. n = 4 mice. (e) Calculation of alanine consumption flux-concentration relationship using tail or portal vein data. Portal vein concentrations were calculated by multiplying alanine data from Fig. 4a by the portal/tail vein TIC ratio from (d). Lines are linear fits to each dataset.
Extended Data Fig. 4 |
Extended Data Fig. 4 |. BCKDK whole-body KO mice are lethargic when fed low protein diet.
(a) Valine consumption flux versus circulating concentration in whole-body BCKDK knockout (KO) mice and littermate control mice (WT). Both groups were infused with [U-13C]valine as in Fig. 2. Lines are linear fits to each dataset. (b) KO and WT mice were fed either 20% or 5% protein diet for 7 days and blood was taken at 5 PM on the last day. Mean±SD. n = 5 WT and 4 KO mice. (c) Activity of KO and WT mice fed 5% protein diet as measured using metabolic chambers. Mean±SD. n = 6 mice.
Extended Data Fig. 5 |
Extended Data Fig. 5 |. TCA oxidation mediates mass action-driven consumption.
Tissue TCA labeling-concentration relationship for fasted perturbative infusions. Data are as in Fig. 5, except for (a) Use of succinate rather than malate to read out tissue TCA labeling or (b) Measurement of malate labeling across additional organs. Lines are linear fits to the data with intercept set to zero.
Extended Data Fig. 6 |
Extended Data Fig. 6 |. Protein synthesis rates are insensitive to branched-chain amino acid infusion.
(a) Calculation of protein synthesis rate. Mice were infused with [U-13C]valine as described in Fig. 6a (fasted group). Tissues were harvested and valine labeling fraction in hydrolyzed tissue proteins were plotted against time (left). Protein synthesis rate was then calculated based on the slopes (right) using the equation shown (below). Lines are linear fitting with mean values of each tissue. n = 2 mice per time point for each condition. (b) Tissue protein synthesis rates do not increase with infusion rate. n = 2 mice per time point for each condition. (c) Tissue protein synthesis rate does not change in response to perturbative valine infusion. Line is mean of the data as the slope is not significant. (d) Tissue protein labeling was consistent from different BCAAs. Mice were infused with [U-13C]valine, [U-13C]leucine, or [U-13C]isoleucine as in (a). n = 2 mice per time point for each condition.
Extended Data Fig. 7 |
Extended Data Fig. 7 |. Protein degradation rate does not change in response to perturbative valine infusion.
Data were from the experiments in Fig. 2 (valine panel). Line is mean of the data as the slope is not significant.
Extended Data Fig. 8 |
Extended Data Fig. 8 |. Raw data supporting the determination of protein synthesis rates after feeding.
Mice were infused with [U-13C]valine at the same condition as described in Fig. 6a (refed group). Lines are linear fitting with mean values of each tissue. n = 2 mice per timepoint.
Extended Data Fig. 9 |
Extended Data Fig. 9 |. Over 2 weeks, dietary protein fraction has little effect on body weight or food intake.
Mice were fed high- (HP), normal- (NP), and low-protein (LP) diets ad lib for 2 weeks. (a) Body weight gain. (b) Food intake. Mean ± SD, n = 6 mice.
Extended Data Fig. 10 |
Extended Data Fig. 10 |. TCA oxidation mediates mass action-driven valine consumption under high-, medium-, and low-protein diet.
Tissue malate labeling relative to serum valine labeling from non-perturbative infusion of [U-13C]valine, as in Fig. 7c. Lines are linear fits to the data with intercept set to zero.
Fig. 1 |
Fig. 1 |. Serum concentration increases linearly with metabolite infusion rate.
a,b, Schematic of the non-perturbative (a) and perturbative (b) infusion experiments. 13C-labelled metabolites (green circles) were infused into the circulation at different rates. The circulating concentration and consumption flux were measured to determine their relationship. c, Concentration-infusion rate relationship for fasted perturbative infusions. Mice (fasted from 9:00 to 18:00) were infused for 2.5 h with the indicated [U-13C]metabolite at different rates starting at 15:00. Blood was sampled at 17:30 and the total concentration of the infused metabolite (sum of labelled and unlabelled) in serum was measured by LC–MS. Throughout the manuscript, for the BCAA infusions, mice were infused with [U-13C]valine with unlabelled leucine and isoleucine at a fixed ratio that was reflective of their abundance in protein (5:6:3). Lines are linear fits to the data.
Fig. 2 |
Fig. 2 |. Metabolic consumption flux is linearly proportional to circulating concentration.
Consumption flux-concentration relationship for fasted perturbative infusions. Fasted mice were infused with the indicated [U-13C]metabolite at different infusion rates as in Fig. 1. Consumption flux (Rd) was plotted against the serum metabolite concentrations (sum of labelled + unlabelled). Lines are linear fits to the data, with data points in red excluded due to evidence of consumption saturation (Michaelis–Menten fit significantly better than linear fit). For the essential amino acids, rather than being a free parameter, the y intercept was fixed to match that amino acid’s consumption by protein synthesis, which was measured separately (Fig. 6).
Fig. 3 |
Fig. 3 |. Only for glucose, unlabelled levels fall on perturbative 13C-labelled infusion, indicating active homeostatic regulation.
Unlabelled concentration-infusion rate relationship for fasted perturbative infusions. Fasted mice were infused with the indicated [U-13C]metabolite at different infusion rates as in Fig. 1. The serum concentration of the corresponding unlabelled metabolite was measured by LC–MS and plotted against the infusion rate. Decreasing unlabelled levels reflect suppression of endogenous production and/or acceleration of consumption by more than just mass action (Extended Data Fig. 1). Increasing unlabelled levels reflect partial consumption saturation. Lines are linear fits to the data, with flat dashed lines used in cases where the slope is not significant.
Fig. 4 |
Fig. 4 |. The same mass action relationship largely holds across fasting and feeding.
a, Consumption flux-concentration relationship for fasted and refed perturbative infusions. Refed mice were fasted during the daytime for 8 h (noon to 20:00). At the time of lights off (20:00), food was provided and [U-13C] metabolite perturbative infusions were performed for 2.5 h. Blood was collected at 22:30 and the consumption flux and total concentration of the infused metabolite were measured. The fasted mice data and black line are copied from Fig. 2. Fitting to this predetermined line was superior based on the AIC to a linear fit with free parameters, except for the alanine refed data. In that case, the linear fit with free parameters is shown in beige. b, Impact of inhibiting the regulatory enzyme BCKDK on valine consumption flux. As shown in the schematic, BCKDK phosphorylates and thereby inactivates the key BCAA catabolic enzyme BCKDH. A small-molecule tool compound, BT2, inhibits BCKDK and thereby activates BCKDH. BCKA, branched-chain ketoacid; KIC, α-ketoisocaproate; KIV, α-ketoisovalerate; KMV, α-keto-β-methylvalerate. Data show the valine consumption flux-concentration relationship determined based on perturbative 13C-valine infusion in both the presence and absence of BT2. For the BT2 group, infusion conditions were exactly as in Fig. 2 except that 100 mg kg−1 BT2 was injected intraperitoneally an hour before starting the 13C-valine infusions. The control group data are copied from Fig. 2. Lines are linear fits to the data with fixed y intercept as in Fig. 2, with red data points excluded due to evidence of consumption saturation (Michaelis–Menten fit significantly better than linear fit).
Fig. 5 |
Fig. 5 |. TCA oxidation mediates mass action consumption.
Tissue TCA labelling-concentration relationship for fasted perturbative infusions. Infusions were carried out exactly as in Fig. 2, with terminal tissue sampling. The y axis shows the labelling fraction of a representative TCA intermediate (malate) relative to the serum labelling fraction of the infused 13C-metabolite, whose total concentration (sum of labelled and unlabelled) is plotted on the x axis. Lines are linear fits to the data with the intercept set to zero, with the red data points excluded due to evidence of consumption saturation (Michaelis–Menten fit significantly better than linear fit). Similar results were obtained using succinate rather than malate to report tissue TCA labelling (Extended Data Fig. 5a).
Fig. 6 |
Fig. 6 |. Mass action-driven oxidation clears amino acid influx from food.
a, Experimental design for measuring tissue-specific protein synthesis rate in fed and fasted mice using 13C-valine non-perturbative infusion. For the fasted group, mice were fasted from 9:00 to 18:00 and [U-13C]valine infusions were performed from 12:00 to 18:00. For the fed group, mice were fasted from noon to 20:00. At the time of lights off (20:00), food was provided and [U-13C] valine infusions were performed from 20:00 to 2:00. During the [U-13C]valine infusions, tissues were collected every 2 h and proteins were hydrolysed to measure valine labelling. b, Feeding does not impact protein synthesis rate. For calculations, see Extended Data Fig. 6. n = 6 mice in total per group with n = 2 mice per time point. c, Experimental design for measuring whole-body endogenous protein degradation rate in fed and fasted mice via pulse-chase. Mice were fed ad libitum and received a non-perturbative infusion of [U-13C]valine (green circles) for 48 h to label tissue proteins. The infusion was stopped at 16:00 on the third day for 4 h to clear circulating [U-13C]valine while mice were fasted. At 20:00, when the lights were turned off, mice received a non-perturbative infusion of the second tracer, [U-2H]valine (red circles) for 2.5 h while one group of mice was kept fasted and another was provided with food. d, Feeding suppresses protein degradation as measured by the serum ratio of [U-13C]valine (coming from protein degradation) to [U-2H]valine (infused at a constant rate). n = 2 mice. e, Valine production fluxes calculated from d. Diet flux is calculated by foodintake×valinepercentagefeedingduration×bodyweight. n = 2 mice. Raw data are shown as black dots. f, Valine fluxes during fasting and feeding. The numbers indicate fluxes in units of nmol g body weight min−1.
Fig. 7 |
Fig. 7 |. Mass action explains amino acid homeostasis across high- and low-protein diets.
a, Serum amino acid levels in fasted and fed mice after two weeks on a high-protein, normal-protein or low-protein diet. Heatmaps are normalized to the row mean in the fasted or fed state. b, Consumption flux-concentration relationship across different dietary conditions based on non-perturbative infusions. After two weeks on the different protein diets, mice received a non-perturbative infusion of [U-13C]valine, [U-13C]lysine or [U-13C]methionine. Infusions for fasted groups were carried out exactly as in Fig. 2, except for the infusion rate being minimally perturbative. Infusions for the fed groups were carried out exactly as in Fig. 4a (food provided contained high, normal or low protein as per their diet), except for the infusion rate being minimally perturbative. The lines represent the consumption flux-concentration relationship determined based on fasted perturbative infusions from Fig. 2. c, Tissue TCA labelling-concentration relationship across different dietary conditions based on non-perturbative infusions. Mice were handled as in b, with terminal tissue sampling. The y axis shows the labelling fraction of a representative TCA intermediate (malate) relative to the serum labelling fraction of the infused 13C-valine, whose total concentration (sum of labelled and unlabelled) is plotted on the x axis. The lines represent the TCA labelling-concentration relationship determined based on fasted perturbative infusions from Fig. 5 and Extended Data Fig. 5b. d, Protein synthesis rate across dietary conditions based on non-perturbative 13C-valine infusions. The whole-body protein synthesis rate was estimated by the sum of the tissue protein synthesis rate multiplied by tissue weight. n = 6 mice in total per group with n = 2 mice per time point.

References

    1. Smith DA & Dalvie D Why do metabolites circulate? Xenobiotica 42, 107–126 (2012). - PubMed
    1. Green CL & Lamming DW Regulation of metabolic health by essential dietary amino acids. Mech. Ageing Dev. 177, 186–200 (2019). - PMC - PubMed
    1. Balkau B et al. High blood glucose concentration is a risk factor for mortality in middle-aged nondiabetic men: 20-year follow-up in the Whitehall Study, the Paris Prospective Study, and the Helsinki Policemen Study. Diabetes Care 21, 360–367 (1998). - PubMed
    1. Bjørnholt JV et al. Fasting blood glucose: an underestimated risk factor for cardiovascular death. Results from a 22-year follow-up of healthy nondiabetic men. Diabetes Care 22, 45–49 (1999). - PubMed
    1. Newgard CB et al. A branched-chain amino acid-related metabolic signature that differentiates obese and lean humans and contributes to insulin resistance. Cell Metab. 9, 311–326 (2009). - PMC - PubMed

Publication types