Development and Validation of a Novel Microbiome-Based Biomarker of Post-antibiotic Dysbiosis and Subsequent Restoration
- PMID: 35058900
- PMCID: PMC8764365
- DOI: 10.3389/fmicb.2021.781275
Development and Validation of a Novel Microbiome-Based Biomarker of Post-antibiotic Dysbiosis and Subsequent Restoration
Abstract
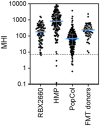
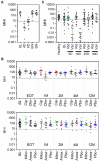
Background: The human gut microbiota are important to health and wellness, and disrupted microbiota homeostasis, or "dysbiosis," can cause or contribute to many gastrointestinal disease states. Dysbiosis can be caused by many factors, most notably antibiotic treatment. To correct dysbiosis and restore healthier microbiota, several investigational microbiota-based live biotherapeutic products (LBPs) are in formal clinical development. To better guide and refine LBP development and to better understand and manage the risks of antibiotic administration, biomarkers that distinguish post-antibiotic dysbiosis from healthy microbiota are needed. Here we report the development of a prototype Microbiome Health Index for post-Antibiotic dysbiosis (MHI-A). Methods: MHI-A was developed and validated using longitudinal gut microbiome data from participants in clinical trials of RBX2660 and RBX7455 - investigational LBPs in development for reducing recurrent Clostridioides difficile infections (rCDI). The MHI-A algorithm relates the relative abundances of microbiome taxonomic classes that changed the most after RBX2660 or RBX7455 treatment, that strongly correlated with clinical response, and that reflect biological mechanisms believed important to rCDI. The diagnostic utility of MHI-A was reinforced using publicly available microbiome data from healthy or antibiotic-treated populations. Results: MHI-A has high accuracy to distinguish post-antibiotic dysbiosis from healthy microbiota. MHI-A values were consistent across multiple healthy populations and were significantly shifted by antibiotic treatments known to alter microbiota compositions, shifted less by microbiota-sparing antibiotics. Clinical response to RBX2660 and RBX7455 correlated with a shift of MHI-A from dysbiotic to healthy values. Conclusion: MHI-A is a promising biomarker of post-antibiotic dysbiosis and subsequent restoration. MHI-A may be useful for rank-ordering the microbiota-disrupting effects of antibiotics and as a pharmacodynamic measure of microbiota restoration.
Keywords: Clostridioides difficile infection; antibiotics; biomarker; dysbiosis; intestinal microbiota.
Copyright © 2022 Blount, Jones, Walsh, Gonzalez and Shannon.
Conflict of interest statement
KB, CJ, and DW are employees of Rebiotix, A Ferring Company. CG and WS are employed by BioRankings, LLC, which received fees for this analysis from Rebiotix.
Figures


Similar articles
-
Microbiota restoration therapies for recurrent Clostridioides difficile infection reach an important new milestone.Therap Adv Gastroenterol. 2024 May 24;17:17562848241253089. doi: 10.1177/17562848241253089. eCollection 2024. Therap Adv Gastroenterol. 2024. PMID: 38800353 Free PMC article. Review.
-
The Role of Microbiome-Based Therapeutics in Clostridioides difficile Infection: Durable, Long-Term Results of RBX2660.Infect Dis Ther. 2023 Jan;12(1):1-7. doi: 10.1007/s40121-022-00714-9. Epub 2022 Nov 7. Infect Dis Ther. 2023. PMID: 36342653 Free PMC article.
-
Impact of investigational microbiota therapeutic RBX2660 on the gut microbiome and resistome revealed by a placebo-controlled clinical trial.Microbiome. 2020 Aug 31;8(1):125. doi: 10.1186/s40168-020-00907-9. Microbiome. 2020. PMID: 32862830 Free PMC article. Clinical Trial.
-
RBX7455, a Non-frozen, Orally Administered Investigational Live Biotherapeutic, Is Safe, Effective, and Shifts Patients' Microbiomes in a Phase 1 Study for Recurrent Clostridioides difficile Infections.Clin Infect Dis. 2021 Oct 5;73(7):e1613-e1620. doi: 10.1093/cid/ciaa1430. Clin Infect Dis. 2021. PMID: 32966574 Free PMC article. Clinical Trial.
-
Gut microbiota changes associated with Clostridioides difficile infection and its various treatment strategies.Gut Microbes. 2023 Jan-Dec;15(1):2223345. doi: 10.1080/19490976.2023.2223345. Gut Microbes. 2023. PMID: 37318134 Free PMC article. Review.
Cited by
-
Fecal microbiota live - jslm (Rebyota™/RBL) for management of recurrent Clostridioides difficile infection.Future Microbiol. 2024;19(14):1243-1251. doi: 10.1080/17460913.2024.2364583. Epub 2024 Jul 11. Future Microbiol. 2024. PMID: 38989699 Free PMC article. Review.
-
Beyond Infection: How Antimicrobial Therapies Influence the Urinary Microbiome and Stone Disease.Pharmaceuticals (Basel). 2025 Jul 12;18(7):1038. doi: 10.3390/ph18071038. Pharmaceuticals (Basel). 2025. PMID: 40732326 Free PMC article. Review.
-
Phase I trial comparing bile acid and short-chain fatty acid alterations in stool collected from human subjects treated with omadacycline or vancomycin.Antimicrob Agents Chemother. 2025 Feb 13;69(2):e0125124. doi: 10.1128/aac.01251-24. Epub 2025 Jan 17. Antimicrob Agents Chemother. 2025. PMID: 39819014 Free PMC article. Clinical Trial.
-
Efficacy of Fecal Microbiota, Live-jslm (REBYOTA®), Among Patients Exposed to Non-Clostridioides difficile Infection Antibiotics: Post Hoc Subgroup Analysis of a Phase 2 Open-Label Study.Open Forum Infect Dis. 2024 Jun 17;11(7):ofae341. doi: 10.1093/ofid/ofae341. eCollection 2024 Jul. Open Forum Infect Dis. 2024. PMID: 39006315 Free PMC article. Clinical Trial.
-
Approach to the diagnosis and management of dysbiosis.Front Nutr. 2024 Apr 19;11:1330903. doi: 10.3389/fnut.2024.1330903. eCollection 2024. Front Nutr. 2024. PMID: 38706561 Free PMC article. Review.
References
-
- Annavajhala M. K., Gomez-Simmonds A., Macesic N., Sullivan S. B., Kress A., Khan S. D., et al. . (2019). Colonizing multidrug-resistant bacteria and the longitudinal evolution of the intestinal microbiome after liver transplantation. Nat. Commun. 10:4715. doi: 10.1038/s41467-019-12633-4, PMID: - DOI - PMC - PubMed
-
- Blount K. F., Shannon W. D., Deych E., Jones C. (2019). Restoration of bacterial microbiome composition and diversity among treatment responders in a phase 2 trial of RBX2660: an investigational microbiome restoration therapeutic. Open Forum Infect. Dis. 6:ofz095. doi: 10.1093/ofid/ofz095, PMID: - DOI - PMC - PubMed
LinkOut - more resources
Full Text Sources
Miscellaneous

