. 2021 Dec 23;9(Pt 1):146-162.
doi: 10.1107/S2052252521012628. eCollection 2022 Jan 1.

Tracing electron density changes in langbeinite under pressure

Affiliations

Tracing electron density changes in langbeinite under pressure

Roman Gajda et al. IUCrJ. .

Abstract

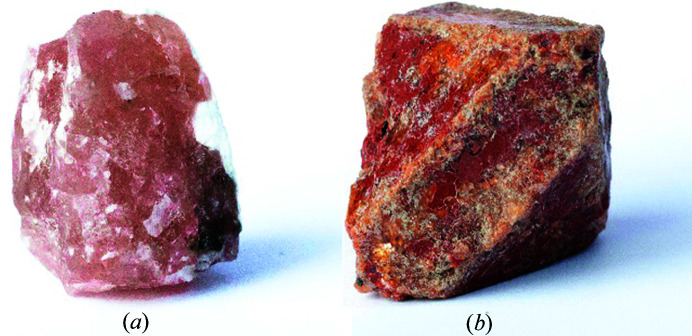
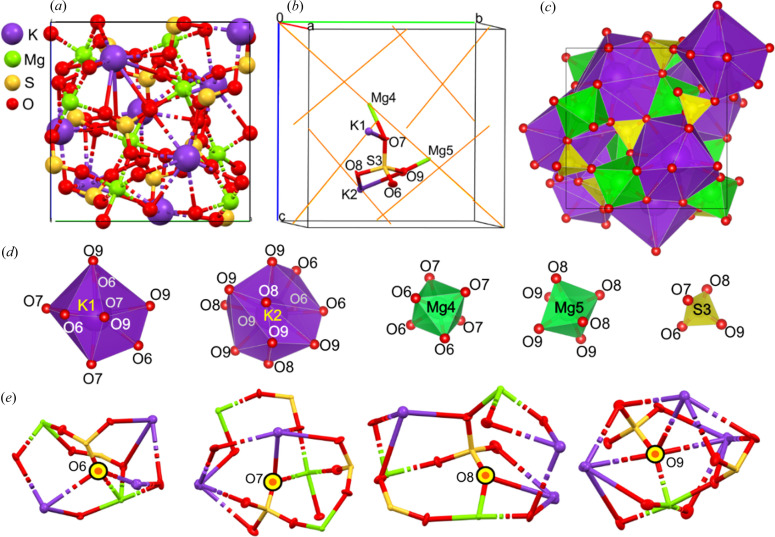
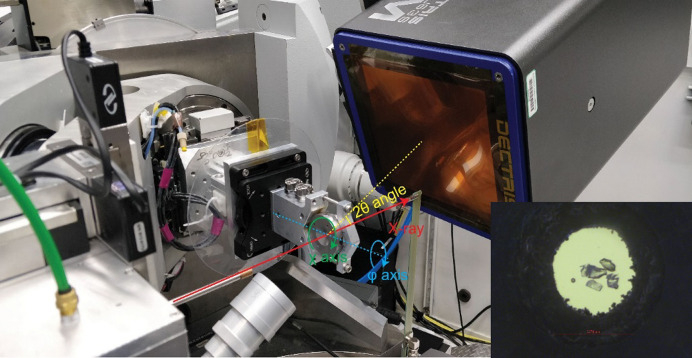
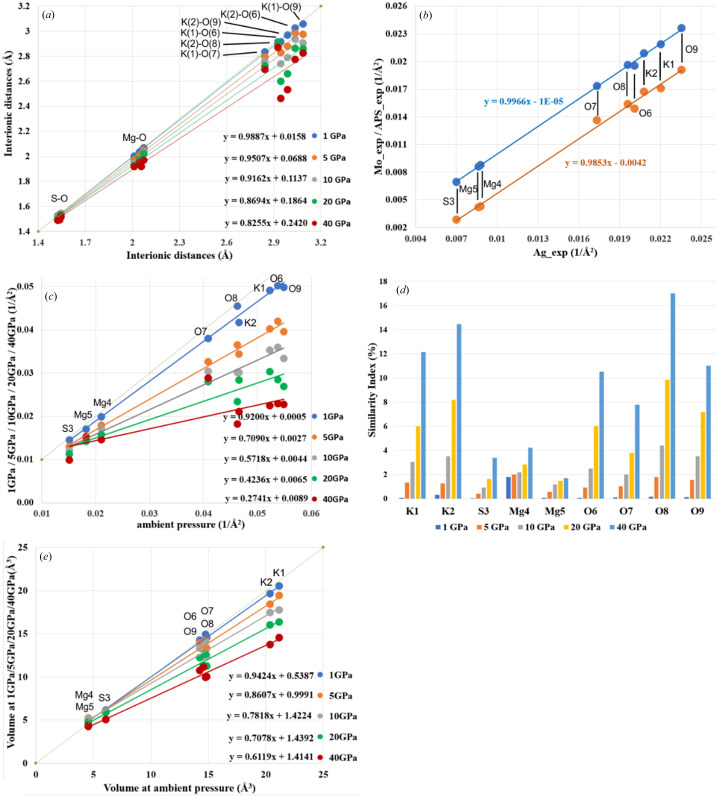
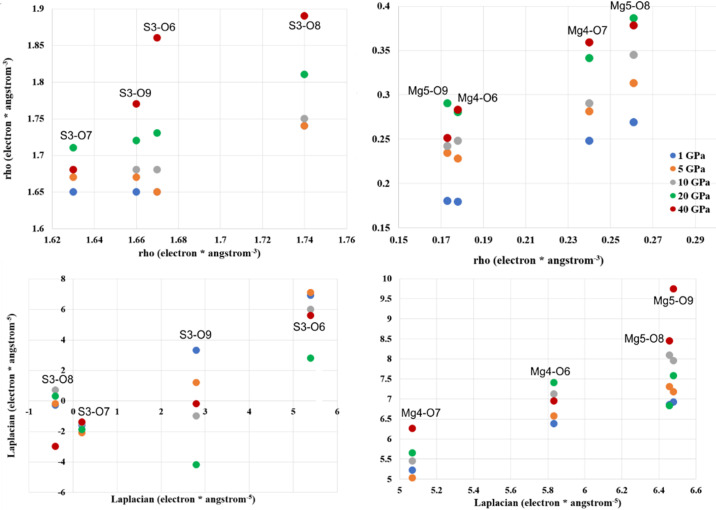
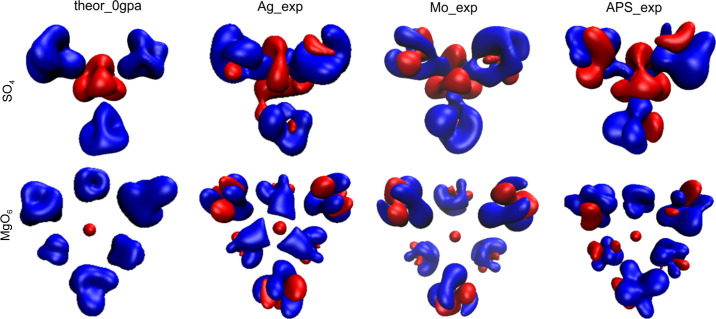
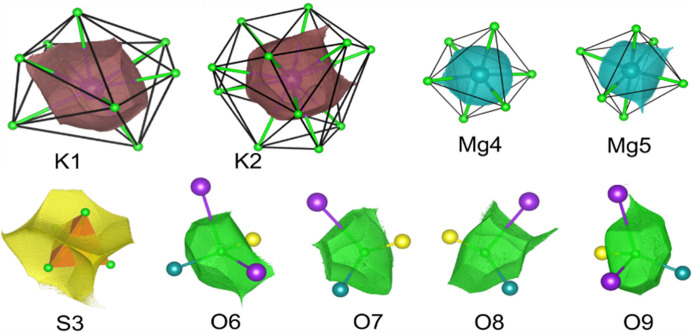
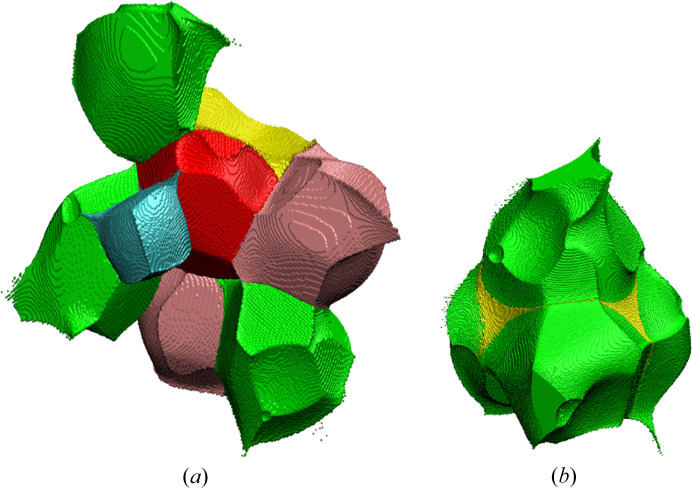
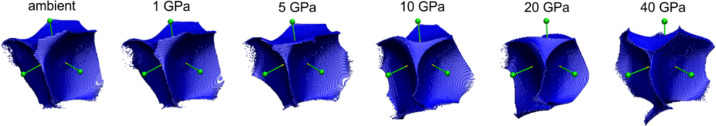
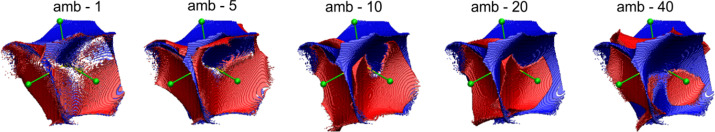
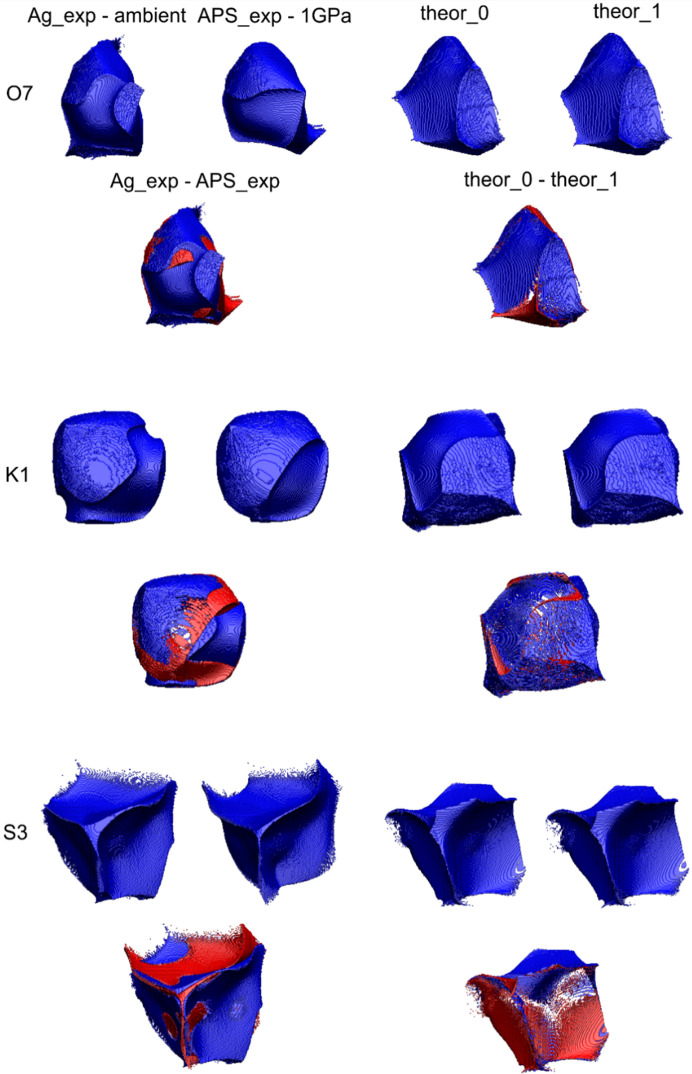
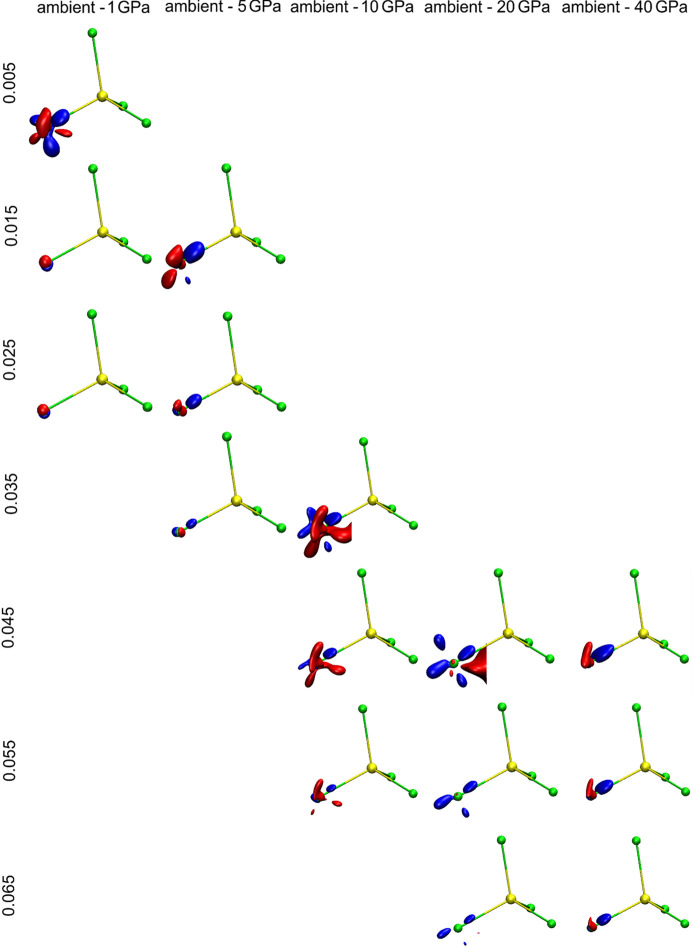
Pressure is well known to dramatically alter physical properties and chemical behaviour of materials, much of which is due to the changes in chemical bonding that accompany compression. Though it is relatively easy to comprehend this correlation in the discontinuous compression regime, where phase transformations take place, understanding of the more subtle continuous compression effects is a far greater challenge, requiring insight into the finest details of electron density redistribution. In this study, a detailed examination of quantitative electron density redistribution in the mineral langbeinite was conducted at high pressure. Langbeinite is a potassium magnesium sulfate mineral with the chemical formula [K2Mg2(SO4)3], and crystallizes in the isometric tetartoidal (cubic) system. The mineral is an ore of potassium, occurs in marine evaporite deposits in association with carnallite, halite and sylvite, and gives its name to the langbeinites, a family of substances with the same cubic structure, a tetrahedral anion, and large and small cations. Single-crystal X-ray diffraction data for langbeinite have been collected at ambient pressure and at 1 GPa using a combination of in-house and synchrotron techniques. Experiments were complemented by theoretical calculations within the pressure range up to 40 GPa. On the basis of changes in structural and thermal parameters, all ions in the langbeinite structure can be grouped into 'soft' (potassium cations and oxygens) and 'hard' (sulfur and magnesium). This analysis emphasizes the importance of atomic basins as a convenient tool to analyse the redistribution of electron density under external stimuli such as pressure or temperature. Gradual reduction of completeness of experimental data accompanying compression did not significantly reduce the quality of structural, electronic and thermal parameters obtained in experimental quantitative charge density analysis.

Keywords: electron density; high pressure; theoretical structure factors.


Figures

Figure 1
Figure 1
(a) Langbeinite [K2Mg2(SO4)3], Kalusa (Kałusz), Ukraine, ca 3 × 1.5 × 1.2 cm, small pieces of this big crystal are studied in this work. (b) Langbeinite crystal replaced by sylvine, Carlsbad Potash Mining District, New Mexico, USA, ca 3 × 1.5 × 1.2 cm.
Figure 2
Figure 2
Langbeinite. (a) Atomic arrangement within the unit cell. (b) Atomic labels and ADP ellipsoids for atoms/ions defining the independent part of the unit cell (orange lines depict threefold axes). (c) Visualization of the polyhedral model of the langbeinite structure: SO4, MgO6 and KO12 polyhedra and the local neighbourhood of oxygen atoms/ions. The Wyckoff positions of K and Mg cations are a3. Other ions are placed at general positions. (d) Separated polyhedral of particular ions. (e) Local neighbourhood of oxygen ions/atoms.
Figure 3
Figure 3
Geometry of the high-pressure single-crystal diffraction experiment at APS 13-BM-C. X-ray direction together with φ, χ and 2θ angles are labelled. Inset: image of the DAC sample chamber after He gas loading, showing four Lb crystals and one ruby sphere. The diameter of the sample chamber was 0.274 mm, indicated by the red scale bar.
Figure 4
Figure 4
(a) Interionic distances as a function of pressure (data correspond with Table S7). (b) Average eigenvalues for specific ADPs obtained on the basis of synchrotron measurements and in-house measurements. Blue dots – relation between Ag_exp and Mo_exp, orange dots – relation between Ag_exp and APS_exp. (c) Average eigenvalues for specific ADPs obtained on the basis of theoretical calculations. (d) Similarity index calculated for ADPs obtained on the basis of theoretical dynamic structure factors. (e) Volumes of integrated atomic basins under pressure versus integrated ambient atomic basins – all from theoretical calculations.
Figure 5
Figure 5
Laplacian and ρ as a function of pressure for S—O and Mg—O contacts at the (3, −1) BCPs for theoretical calculations.
Figure 6
Figure 6
3D deformation density maps (red – minus values, blue – plus values, contour ±0.022 e).
Figure 7
Figure 7
Relation between the polyhedral representation of ions in the crystal structure of Lb and atomic/ionic basins of particular ions.
Figure 8
Figure 8
(a) Atomic basin of O9 (red shape) surrounded by basins belongs to sulfur (yellow), magnesium (cyan), oxygen (green) and potassium atoms (pink); (b) SO4 group (green – oxygen, yellow – sulfur).
Figure 9
Figure 9
Sulfur atomic basin and the evolution of its shape as a function of pressure.
Figure 10
Figure 10
Differences between shape of the sulfur atomic basin (in blue) at ambient pressure and pressures ranging from 1 to 40 GPa (in red).
Figure 11
Figure 11
Comparison of selected atomic basins: O(7), K(1) and S(3) and their difference maps for experimental and theoretical data.
Figure 12
Figure 12
Differences in EDD at the O(9) anion in a range of pressure values from ambient to 40 GPa described by a set of isovalues. The regions in space which carry more total electron density (defined by the isosurface value) at ambient pressure than under particular pressure values are in blue and the regions for which there are more total electron density (as defined by the isocontour value) under pressure than at ambient pressure are in red. So we can interpret such figures as an illustration of the redistribution of charge (at a given contour isosurface value) from the blue regions at ambient pressure to the red regions under higher pressure values.
Figure 13
Figure 13
Difference of total electron density at the (a) SO4 group, difference between ambient pressure and 1 GPa (iso-contour: + 0.005 blue and −0.005 red). (b) Map of the difference between ambient pressure and 10 GPa (iso-contour: +0.05 and −0.05; blue and red, respectively).

References

    1. Ángyán, J., Jansen, G., Loss, M., Hättig, C. & Heß, B. A. (1994). Chem. Phys. Lett. 219, 267–273.
    1. Bader, R. F. W. (1994). Atoms in Molecules: a Quantum Theory, Oxford, New York: Oxford University Press.
    1. Battle, P., Cheetham, A., Harrison, W. & Long, G. (1986). J. Solid State Chem. 62, 16–25.
    1. Battle, P., Gibb, T., Nixon, S. & Harrison, W. (1988). J. Solid State Chem. 75, 21–29.
    1. Becke, A. & Edgecombe, K. (1990). J. Chem. Phys. 92, 5397–5403.