. 2022 Jan 4:11:802613.
doi: 10.3389/fcimb.2021.802613. eCollection 2021.

Specific Human ATR and ATM Inhibitors Modulate Single Strand DNA Formation in Leishmania major Exposed to Oxidative Agent

Affiliations

Specific Human ATR and ATM Inhibitors Modulate Single Strand DNA Formation in Leishmania major Exposed to Oxidative Agent

Raíssa Bernardes da Silva et al. Front Cell Infect Microbiol. .

Abstract

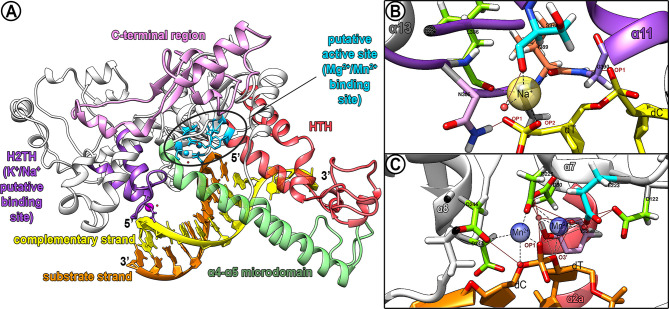
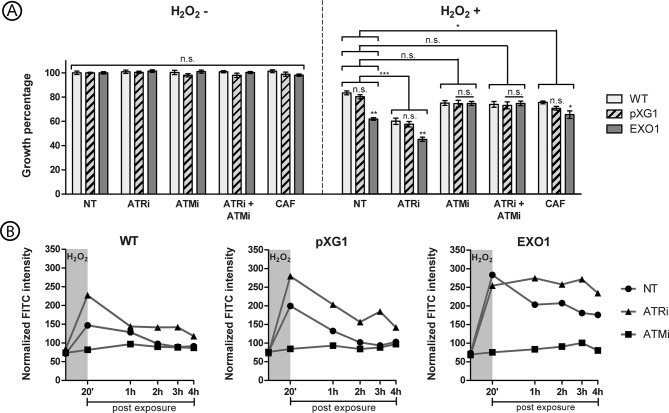
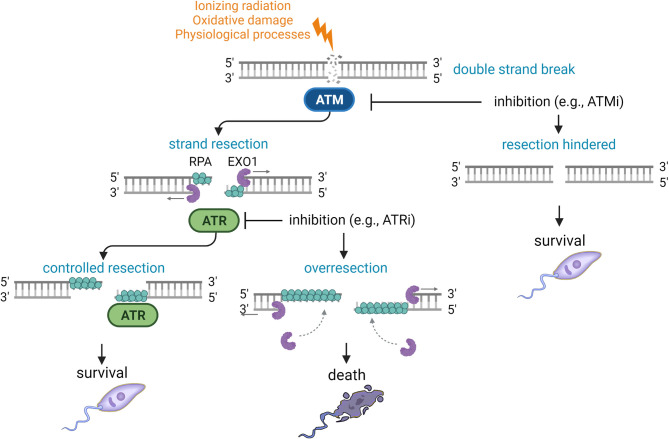
Leishmania parasites are the causative agents of a group of neglected tropical diseases known as leishmaniasis. The molecular mechanisms employed by these parasites to adapt to the adverse conditions found in their hosts are not yet completely understood. DNA repair pathways can be used by Leishmania to enable survival in the interior of macrophages, where the parasite is constantly exposed to oxygen reactive species. In higher eukaryotes, DNA repair pathways are coordinated by the central protein kinases ataxia telangiectasia mutated (ATM) and ataxia telangiectasia and Rad3 related (ATR). The enzyme Exonuclease-1 (EXO1) plays important roles in DNA replication, repair, and recombination, and it can be regulated by ATM- and ATR-mediated signaling pathways. In this study, the DNA damage response pathways in promastigote forms of L. major were investigated using bioinformatics tools, exposure of lineages to oxidizing agents and radiation damage, treatment of cells with ATM and ATR inhibitors, and flow cytometry analysis. We demonstrated high structural and important residue conservation for the catalytic activity of the putative LmjEXO1. The overexpression of putative LmjEXO1 made L. major cells more susceptible to genotoxic damage, most likely due to the nuclease activity of this enzyme and the occurrence of hyper-resection of DNA strands. These cells could be rescued by the addition of caffeine or a selective ATM inhibitor. In contrast, ATR-specific inhibition made the control cells more susceptible to oxidative damage in an LmjEXO1 overexpression-like manner. We demonstrated that ATR-specific inhibition results in the formation of extended single-stranded DNA, most likely due to EXO1 nucleasic activity. Antagonistically, ATM inhibition prevented single-strand DNA formation, which could explain the survival phenotype of lineages overexpressing LmjEXO1. These results suggest that an ATM homolog in Leishmania could act to promote end resection by putative LmjEXO1, and an ATR homologue could prevent hyper-resection, ensuring adequate repair of the parasite DNA.

Keywords: DNA repair; Leishmania major (L. major); ataxia telangiectasia and Rad3 related kinase (ATR); ataxia telangiectasia mutated (ATM); exonuclease 1.


Conflict of interest statement

The authors declare that the research was conducted in the absence of any commercial or financial relationships that could be construed as a potential conflict of interest.

Figures

Figure 1
Figure 1
Putative catalytic domain of LmjEXO1 and predicted interactions with substrate DNA and metallic ions. (A) Prediction of the main regions of the catalytic core of LmjEXO1 by structural alignment with HsEXO1 (SHI et al, 2017), i.e.: active site (sky blue), possibly containing sites for bivalent ligands including Mg2+ and/or Mn2+ (blue spheres); domain helix-two-turn-helix (H2TH, purple); with a putative monovalent ligand including sodium or potassium (magenta sphere); helix-turn-helix wedge (HTH, red); α4-α5 microdomain (green); C-terminal region (pink). The small red spheres constitute putative water molecules. (B, C) The inside of the predicted domain H2TH and the putative active site of LmjEXO1 were zoomed in. The side chains of the residues predicted in the coordination of the metallic ions are shown by sticks. Predicted hydrogen bonds are presented as brown lines, whereas putative pseudobonds for metallic ions coordination are displayed as dashed lines in black. Water molecules possibly involved in the interaction are shown as red translucent spheres. Oxygen atoms are shown as red sticks; nitrogen atoms are displayed as blue sticks, and hydrogen atoms are shown in white. Alpha-helixes predicted around the ligand sites are also displayed. (B) The predicted site for monovalent K+/Na+ ligands (yellow translucent sphere) is displayed. Predicted residues in the coordination: S378 (cyan); N385 (pink); L386 (green); I389 (orange); G390 (purple). Yellow sticks represent the phosphodiester backbone of the complementary strand (non substrate) of the DNA. OP1 and OP2: oxygen atoms of phosphate groups. (C) The predicted active site is displayed with two bivalent cations (Mg2+ and/or Mn2+), presented as blue translucent spheres. Residues predicted in the coordination: D30, D122, D225, D244 and D246 (green); E223 (cyan); Y32 (purple). Orange sticks represent the phosphodiester backbone of the substrate DNA strand.
Figure 2
Figure 2
Growth and susceptibility curves of L. major lineages exposed to ionizing radiation. The graphs display how the L. major cell population of the three lineages evolved after the exposure to ionizing radiation (IR) and the effects of the addition of 5 mM caffeine over that evolution. WT lineage, not treated with caffeine (WT CAF-): empty circles; episome vector control lineage, not treated with caffeine (“pXG1 CAF-”): empty triangles; LmjEXO1 overexpressor lineage, not treated with caffeine (“EXO1 CAF-”): empty squares; wild type lineage, treated with caffeine (WT CAF+): full circles; episome vector control lineage, treated with caffeine (“pXG1 CAF+”): full triangles; LmjEXO1 overexpressor lineage, treated with caffeine (“EXO1 CAF+”): full squares. The parasites were exposed to 500 Gy of gamma radiation and counted daily with hemocytometer. The data were normalized and presented as mean ± standard error for two independent experiments, each one performed in triplicate. The point 0% represented the initial parasite population, right before the irradiation (the dashed line along the graphs). Under that line (negative values), the data points represent the percentage of cell death from the initial starting point, i.e., 100% of the lower part of the graph means the complete death of initial parasite population. The superior part of the graph (positive values) represent parasite population growth, so that 100% means maximum growth, defined as the maximum quantity of parasites reached by each lineage not exposed to IR (0 Gy).
Figure 3
Figure 3
Cell cycle of the different L. major lineages exposed to ionizing radiation. (A) The histograms compare the cell populations of L. major wild type (WT, blue curves); episome vector control (“pXG1”, golden curves); e LmjEXO1 overexpressor lineage (“EXO1”, red curves) not exposed (“0 Gy”) and exposed to 500Gy (“500Gy”) of gamma radiation during the analyzed period. The population was distributed according to the fluorescence intensity of propidium iodide (PI) of each cell. The inset graphs at the right upper corner of each histogram represent the population of parasites from which the data was extracted for the generation of the histograms. The data are representative of two independent experiments. (B) The percentage of parasites in each stage of the cell cycle, extracted from the histograms, was plotted as curves to demonstrate the evolution of each L. major after the irradiation. Sub-G1: full circles; G1: empty circles; S: empty squares; G2: empty diamonds; > G2: full diamonds. The data was presented as mean ± standard error of the percentages obtained from the two independent experiments.
Figure 4
Figure 4
Effect of ATR and ATM inhibitors in the growth and ssDNA formation of L. major lineages exposed to hydrogen peroxide. (A) The graph display percentage of growth of L. major wild-type (WT, light grey columns), episome vector control (pXG1, hatched columns) and LmjEXO1 overexpressor lineage (EXO1, dark grey columns), after exposure to hydrogen peroxide (H2O2). The parasite cells were treated with 5 mM caffeine (CAF), 10 μM ATRi, 10 μM ATMi, or a combination of 10 μM ATRi and 10 μM ATMi, for 1 hour before the addition of H2O2.The parasites were then exposed to 500 μM H2O2 for 20 minutes. Cells were counted after 72 hours. The growth percentage is relative to the one of parasites not treated and not exposed to H2O2 of each lineage. The data represent mean ± standard error of three independent experiments, each one performed as triplicates. Two way analysis of variance (two-way ANOVA) is shown, and it includes the results of the post-hoc tests of Bonferroni (comparisons between lineages inside each treatment) and Dunnett (brackets comparing treatment groups). Control groups are the parasites not treated with inhibitors. *p < 0,05; **p < 0,005; ***p < 0,0005. (B) The curves exhibit the ssDNA formation kinetics in L. major wild type (WT), episome vector control (pXG1) e LmjEXO1 overexpressor lineage after the exposure to H2O2. Promastigote forms of L. major lineages were incubated during 1 hour in standard culture media (NT, circles) or media containing 10 μM ATRi (triangles) or 10 μM ATMi (squares). 500 μM H2O2 were added to the cultures, which were then incubated for 20 minutes (darker area in the graphs). The parasites were washed for complete removal of the drugs and resuspended in standard culture media. 0,5 a 2×10⁷ cells samples were collected 1 hour after the addition of inhibitors (starting point of the curves), after 20 minutes of the addition of H2O2, and then every hour after the removal of the drugs, until 4 hours post H2O2 exposure. After cell fixation, the parasites were incubated with anti-BrdU FITC conjugate for the detection of 5-IdU nucleotide. The mean fluorescence intensity of parasites with a >102 UA fluorescence intensity was normalized with the mean fluorescence of parasites under that threshold. The histograms used for this quantification are presented in Supplementary Figure 6 . The data are representative of two independent experiments and are presented as means ± standard errors of the normalized fluorescence intensities. n.s., not significant.
Figure 5
Figure 5
Theoretical model for the DNA damage and response in Leishmania. Schematic model to hypothesize the mechanisms controlling the DNA damage and repair in Leishmania, formulated according to the findings of the present work. Ionizing radiation, oxidative damage or endogenous physiological processes can cause many types of DNA damage (e.g. double strand breaks). In the damaged site, the putative homologue protein LmjATM (in blue) may be activated and stimulate the end resection by the enzyme LmjEXO1 (in purple). In other eukaryotes, many DNA damage responders, including the MRN-Sae2 complex, PCNA and RPA (in cyan), can activate EXO1. The extended 3’ ssDNA is covered by RPA, generating a signal for the recruitment of the putative homologue protein LmjATR (in green). As seen in other eukaryotes, LmjATR can modulate the end resection. After repairing the damage, the cell cycle can proceed and the parasite can recover and multiply. When overexpressed, or when the LmjATR modulation is deficient (e.g., by inhibition with ATRi), LmjEXO1 can continue the end resection, generation too long 3’ ssDNA ends, which can lead to generalized genomic instability and, consequently, to the parasite death. The parasites can possibly escape the deleterious effects of LmjEXO1 overexpression with the inhibition of ATM (e.g.: using ATMi), preventing the end resection. In this case, the parasites could use alternative pathways to repair the DNA damage. Lightning: DNA damage; grey arrow: end resection direction.

Similar articles

References

    1. Alsford S., Dubois K., Horn D., Field M. C. (2012). Epigenetic Mechanisms, Nuclear Architecture and the Control of Gene Expression in Trypanosomes. Expert Rev. Mol. Med. 14, e13. doi: 10.1017/erm.2012.7 - DOI - PubMed
    1. Álvarez-Quilón A., Serrano-Benítez A., Lieberman J. A., Quintero C., Sánchez-Gutiérrez D., Escudero L. M., et al. . (2014). ATM Specifically Mediates Repair of Double-Strand Breaks With Blocked DNA Ends. Nat. Commun. 5, 3347. doi: 10.1038/ncomms4347 - DOI - PMC - PubMed
    1. Anand R., Pinto C., Cejka P. (2018). Methods to Study DNA End Resection I: Recombinant Protein Purification. Methods Enzymol. 600, 25–66. doi: 10.1016/bs.mie.2017.11.008 - DOI - PubMed
    1. Bakr A., Oing C., Köcher S., Borgmann K., Dornreiter I., Petersen C., et al. . (2015). Involvement of ATM in Homologous Recombination After End Resection and RAD51 Nucleofilament Formation. Nucleic Acids Res. 43, 3154–3166. doi: 10.1093/nar/gkv160 - DOI - PMC - PubMed
    1. Benada J., Macurek L. (2015). Targeting the Checkpoint to Kill Cancer Cells. Biomolecules 5, 1912–1937. doi: 10.3390/biom5031912 - DOI - PMC - PubMed

Publication types