. 2021:7:1044-1054.
doi: 10.1109/tci.2021.3114994. Epub 2021 Sep 24.

Autoregression and Structured Low-Rank Modeling of Sinogram Neighborhoods

Affiliations

Autoregression and Structured Low-Rank Modeling of Sinogram Neighborhoods

Rodrigo A Lobos et al. IEEE Trans Comput Imaging. 2021.

Abstract

Sinograms are commonly used to represent the raw data from tomographic imaging experiments. Although it is already well-known that sinograms posess some amount of redundancy, in this work, we present novel theory suggesting that sinograms will often possess substantial additional redundancies that have not been explicitly exploited by previous methods. Specifically, we derive that sinograms will often satisfy multiple simple data-dependent autoregression relationships. This kind of autoregressive structure enables missing/degraded sinogram samples to be linearly predicted using a simple shift-invariant linear combination of neighboring samples. Our theory also further implies that if sinogram samples are assembled into a structured Hankel/Toeplitz matrix, then the matrix will be expected to have low-rank characteristics. As a result, sinogram restoration problems can be formulated as structured low-rank matrix recovery problems. Illustrations of this approach are provided using several different (real and simulated) X-ray imaging datasets, including comparisons against a state-of-the-art deep learning approach. Results suggest that structured low-rank matrix methods for sinogram recovery can have comparable performance to state-of-the-art approaches. Although our evaluation focuses on competitive comparisons against other approaches, we believe that autoregressive constraints are actually complementary to existing approaches with strong potential synergies.

Keywords: Autoregression; Sinogram restoration; Structured low-rank matrix recovery; Tomographic imaging.


Figures
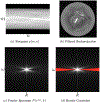
Fig. 1.
Fig. 1.
An illustration of the spectral characteristics of typical sinograms using real X-ray tomography data from Ref. [22]. (a) The sinogram p[m, n]. Due to symmetry, we only show values corresponding to 0 ≤ n ≤ N/2 − 1. (b) Filtered backprojection reconstruction of the sinogram. (c) The Fourier transform P(e, k) of the sinogram. It is observed that the support of P(e, k) is very compact, as expected. (d) The same image of P(e, k) from (c), on which we have overlaid (in red) the complement of the bowtie-shaped region computed based on the radius of the object [1], [7]. It can be observed that the support of P(e, k) is contained within the bowtie-shaped region (as expected), although it is also observed that the bowtie constraint is highly conservative (i.e., the support of P(e, k) occupies a very small fraction of the bowtie region).
Fig. 2.
Fig. 2.
Singular values of the C matrix corresponding to the sinogram data from Fig. 1. We observe that the singular values decay very rapidly (i.e., the matrix has a maximum possible rank of 149, while the rank-7 approximation is sufficient to capture more than 99% of the total energy of the original matrix), confirming the expectation that C should be low-rank because P(e, k) had a very small spectral support. While we have only illustrated this behavior for a single sinogram with a single value of τ, the characteristics observed in this case are quite typical.
Fig. 3.
Fig. 3.
(a-e) Five representative sinogram filters h[m, n] obtained from the approximate nullspace vectors of the C matrix. The filters are color-coded to indicate the sign of the filter coefficients (blue = positive, red = negative). (f-j) The corresponding spectral representations H(e, k) of the filters, shown as red overlays on top of P(e, k). As can be seen, we have in each case that P(e, k) and H(e, k) have approximately complementary support, as expected. (k) An estimate of the complement of the spectral support of P(e, k) can be obtained by examining the spectral supports of all the filter functions obtained from approximate nullspace vectors. In this case, the red overlay shows the square-root of the sum-of-squares of 134 different frequency responses H(e, k) corresponding to the approximate nullspace vectors of the C matrix, which provides a very tight delineation of the spectral support of P(e, k).
Fig. 4.
Fig. 4.
Three missing data scenarios used for evaluation. The top row shows sinograms with missing data (retrospectively subsampled), where the missing sample locations have been marked in red. The bottom row shows corresponding filtered backprojection reconstructions.
Fig. 5.
Fig. 5.
Restoration results for the three scenarios shown in Fig. 4. The top two rows show sinogram and filtered backprojection results for the bowtie approach, while the bottom two rows show results for the proposed approach.
Fig. 6.
Fig. 6.
Restoration results for the integrated circuit data. We show (top row) pre-filtered sinograms and (bottom row) filtered backprojection results for (left) the zero-filled sinogram and (right) the proposed approach. The corrupted sinogram sample locations are marked in red on the zero-filled sinogram.
Fig. 7.
Fig. 7.
Simulated suitcase-like objects (left) without and (middle, right) with metal objects (shown in red) of different radii: (middle) radius = 8 voxels; (right) radius = 14 voxels.
Fig. 8.
Fig. 8.
Representative sinogram restoration results for the simulated security data for (top row) metal objects with radius = 8 voxels and (bottom row) metal objects with radius = 14 voxels. The left two columns show the sinograms for the metal-free case and the zero-filled sinograms for the cases with metal objects (with corrupted sinogram samples marked in red). The remaining four columns show error images for different sinogram restoration methods. Each pixel of each error image has been normalized by dividing by the corresponding value from the metal-free sinogram.
Fig. 9.
Fig. 9.
Representative filtered backprojection results for the simulated security data (corresponding to the case of metal objects with radius = 8 voxels). The top row shows the images while the bottom shows errors with respect to the reconstruction of the (uncorrupted) metal-free sinogram. Each voxel of each error image has been normalized by dividing by the corresponding value from the metal-free reference image.

References

    1. Natterer F, The Mathematics of Computerized Tomography. Philadelphia: SIAM, 2001.
    1. Pan X, Sidky EY, and Vannier M, “Why do commercial CT scanners still employ traditional, filtered back-projection for image reconstruction?” Inverse Probl, vol. 25, p. 123009, 2009. - PMC - PubMed
    1. Clackdoyle R and Defrise M, “Tomographic reconstruction in the 21st century,” IEEE Signal Process. Mag, vol. 27, pp. 60–80, 2010.
    1. Ludwig D, “The Radon transform on Euclidean space,” Comm. Pure Appl. Math, vol. 19, pp. 49–81, 1966.
    1. Karp J, Muehllehner G, and Lewitt R, “Constrained Fourier space method for compensation of missing data in emission computed tomography,” IEEE Trans. Med. Imag, vol. 7, pp. 21–25, 1988. - PubMed

LinkOut - more resources