. 2022 Aug 22;32(17):3669-3689.
doi: 10.1093/cercor/bhab440.

Optical analysis of glutamate spread in the neuropil

Affiliations

Optical analysis of glutamate spread in the neuropil

E A Matthews et al. Cereb Cortex. .

Abstract

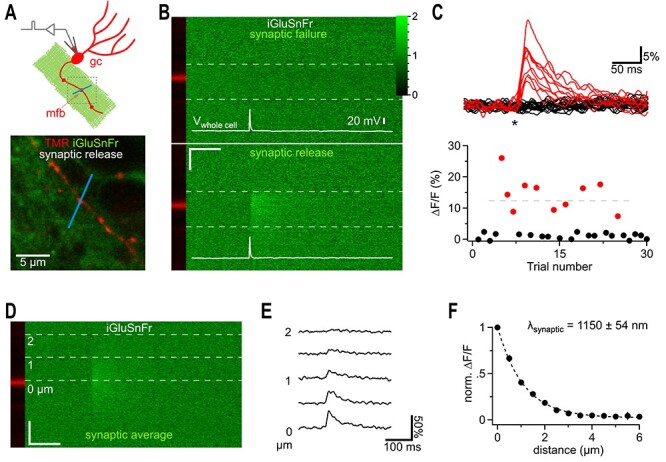
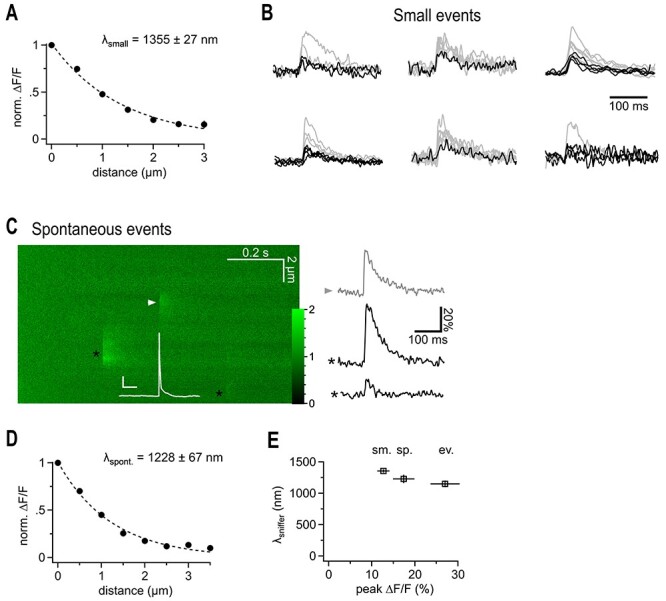
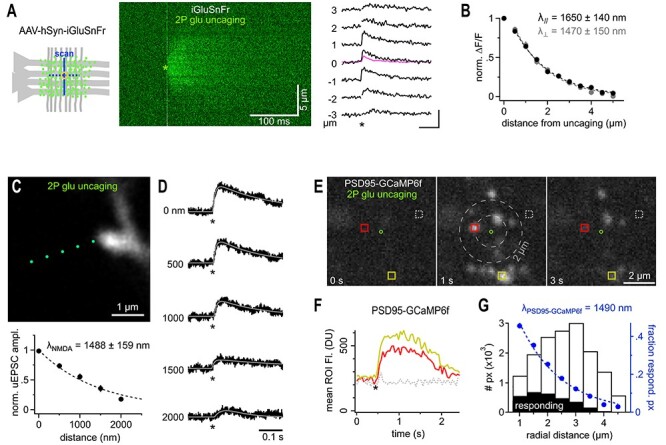
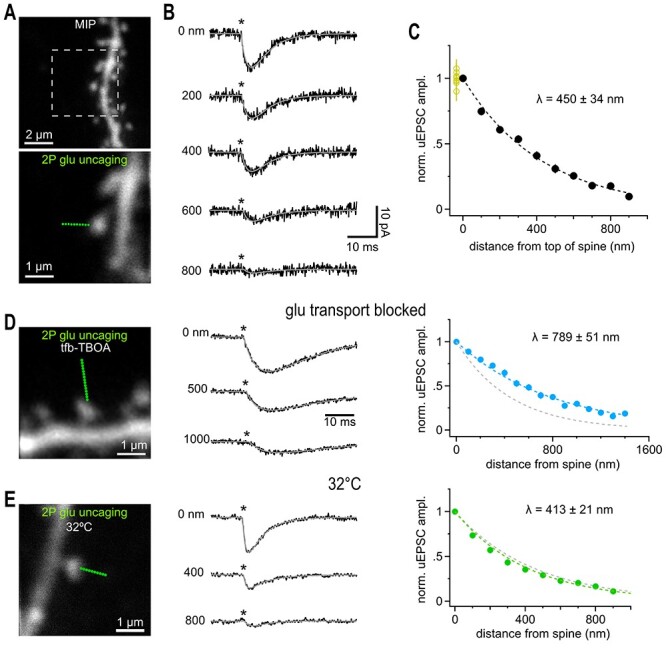
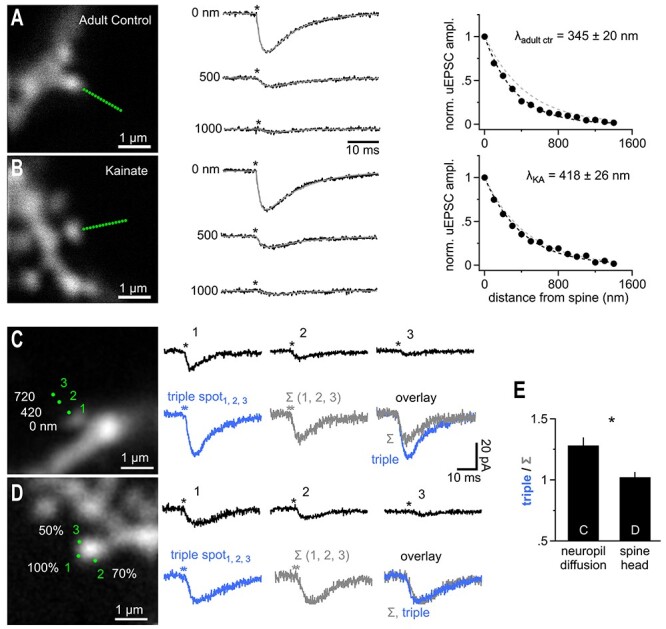
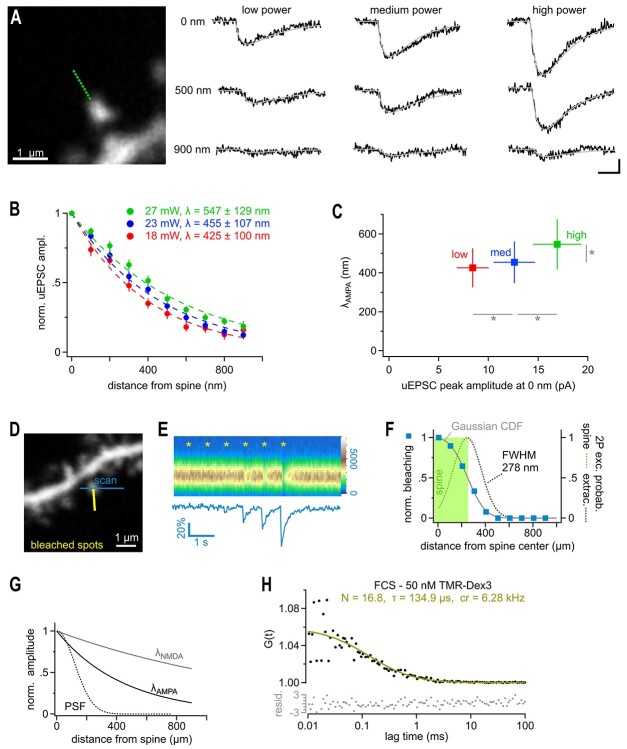
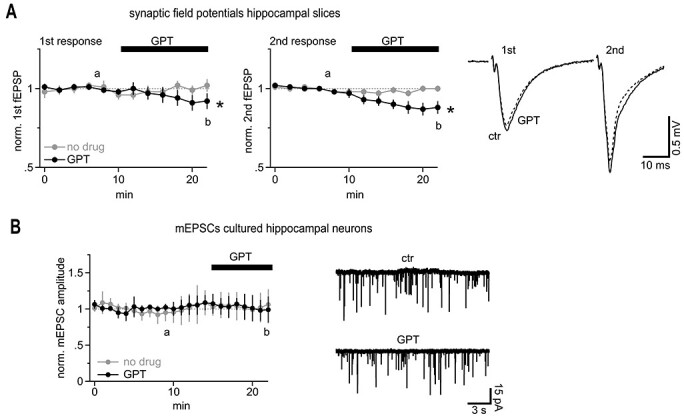
Fast synaptic communication uses diffusible transmitters whose spread is limited by uptake mechanisms. However, on the submicron-scale, the distance between two synapses, the extent of glutamate spread has so far remained difficult to measure. Here, we show that quantal glutamate release from individual hippocampal synapses activates extracellular iGluSnFr molecules at a distance of >1.5 μm. 2P-glutamate uncaging near spines further showed that alpha-amino-3-hydroxy-5-methyl-4-isoxazolepropionic acid (AMPA)-Rs and N-methyl-D-aspartate (NMDA)-Rs respond to distant uncaging spots at approximately 800 and 2000 nm, respectively, when releasing the amount of glutamate contained in approximately five synaptic vesicles. The uncaging-induced remote activation of AMPA-Rs was facilitated by blocking glutamate transporters but only modestly decreased by elevating the recording temperature. When mimicking release from neighboring synapses by three simultaneous uncaging spots in the microenvironment of a spine, AMPA-R-mediated responses increased supra-additively. Interfering with extracellular glutamate diffusion through a glutamate scavenger system weakly reduced field synaptic responses but not the quantal amplitude. Together, our data suggest that the neuropil is more permissive to short-range spread of transmitter than suggested by theory, that multivesicular release could regularly coactivate nearest neighbor synapses and that on this scale glutamate buffering by transporters primarily limits the spread of transmitter and allows for cooperative glutamate signaling in extracellular microdomains.

Keywords: glutamate signaling; iGluSnFr; multivesicular release; neurotransmitter diffusion; synaptic crosstalk.


Figures

Figure 1
Figure 1
iGluSnFr responses far away from synaptic release sites. (A) Cartoon illustrating the recording condition to quantify the spatial spread of synaptically released glutamate. A granule cell (gc) was patch clamped and dye-filled (red) to identify a synaptic bouton (mossy fiber bouton, mfb) surrounded by neuronal iGluSnFr expression (green). To visualize synaptic glutamate release, a 2P line scan was drawn through the bouton (blue line). The boxed region represents a typical frame scan (as illustrated in lower panel) obtained to identify boutons and adjust the line scan. Lower panel, example dual channel two photon frame scan of a dye-filled (TMR 400 μM, red, iGluSnFr, green) mfb used for stimulation and recording of synaptic glutamate release (as shown in I-L). The bath solution contained CNQX (10 μM) to eliminate network activity and 4-AP (100 μM) and DPCPX (1 μM) to elevate release probability and thereby shorten the required recording time (release probability normally below 10%). (B) Dual channel 2P line scan through the bouton shown in A). Top panel shows a failed glutamate release, while the, bottom panel depicts a successful glutamate release. White lines illustrate the corresponding whole cell current clamp recordings of the stimulated action potentials. The bouton is in the red channel displayed on the left and does not show changes in fluorescence (tracer dye). In each line scan image, the region between the two dashed gray lines was used to calculate the fluorescence over time traces shown in (C). Color scale expresses fluorescence with respect to baseline and also applies to (C) and (D). Note the rapidly rising signal only occurring at the position of the bouton and at the time of the action potential. Scale bar: 50 ms, 1 μm. (C) Top panel, 30 example traces of line scan fluorescence over time (as indicated in B) demonstrate the well-known typical fluctuation of responses (red) and failures (black) known from synaptic vesicle release. Asterisk, time of action potential. Fluorescence normalized to prestimulus levels. Bottom panel, peak amplitudes of the fluorescence traces for the 30 sequential stimulations obtained from this bouton. Red markers below the dashed horizontal line represent events putatively classified as single vesicle release responses. (D) Line scans of synaptic responses only (excluding release failures) were averaged per bouton to improve the signal-to-noise ratio for quantification of the spread of synaptically released glutamate. Gray dashed lines indicate distances from the center of release. (E) Fluorescence over time extracted from (D) at the indicated distances. Note that the decay is slowed with distance and that weak signals can still be detected at 2 μm. The peak of these signals was quantified and plotted in F. (F) Synaptically released glutamate activated iGluSnFr at distances of more than 1.5 μm (n = 6). In each experiment the peak amplitudes of fluorescent transients were normalized to the largest amplitude measured at the dye-filled bouton.
Figure 2
Figure 2
Putative quantal iGluSnFr signals show a similarly extended spatial decay. (A) Spatial extent of small synaptic iGluSnFr transients. For each recording the smallest events were selected to exclude potential multiquantal events. Note that the lambda value is in the same range as the one derived from data obtained by averaging small and large transients (cf. Fig. 1). (B) iGluSnFr fluorescent traces, the selected fraction of traces used for (A) is shown in black. Traces of peak-scaled for comparison are not shown at the same vertical scaling. Events for the cell at the right top are shown in Figure 1. (C) Example 2P line scan across a dye filled bouton showing the action potential-elicited iGluSnFr response (arrowhead), and two spontaneous, off-bouton events (black asterisks) used for the analysis shown in D. The white trace represents the simultaneous current clamp recording of the cell stimulated to fire an action potential, which released transmitter at the arrow head position (scale bars: 20 mV, 50 ms, color scale expresses fluorescence with respect to baseline). Right panel illustrates fluorescent example traces calculated at the positions indicated by the symbols. (D) Spatial extent of spontaneous likely miniature glutamate transients. Analysis of events that occurred independently of the timing of the action potential induced in the patch-clamped granule cell. All of them must have been released from neighboring synapses because they did not occur at the dye-filled bouton. As spontaneous action potential firing of granule cells in slices is very rare and slices are also bathed in CNQX and APV, these events are likely due to miniature, action potential-independent, single vesicle glutamate release. (E) λsniffer only weakly depends on the magnitude of the signals and tends to be larger if more glutamate is released. From left to right: selected small, spontaneous, and evoked events.
Figure 3
Figure 3
Extended spatial decay of NMDA-Rs mediated signals. (A) iGluSnFr reports a similar spread of extracellular glutamate following 2P-glutamate uncaging. Cartoon: yellow circle indicates glutamate uncaging site in the dendritic region of CA1 (Str. radiatum) where iGluSnFr reporter proteins are expressed on the neuronal membrane (green dots). 2P line scans perpendicular or parallel to axons (blue lines) were used to quantify the spatial spread of the fluorescent signal. Middle panel: Example line scans through the glutamate uncaging site (green asterisk, indicating time and position, average of three repeated uncaging spots at 3 s intervals). Note the rapid and substantial spread of the fluorescence. Line scans were normalized on the preuncaging fluorescence to account for spatial variability of initial iGluSnFr brightness (owing to varying spatial densities of membrane expression levels). Right panel: example fluorescent traces calculated from the line scan image shown in the middle. Numbers indicate distance from uncaging site; asterisk, time of uncaging. Note the visible and delayed signal at ±3 μm. Kinetics and amplitude are similar to synaptically evoked iGluSnFr responses as illustrated by the pink trace, average response from the experiment shown in Figure 1. Scale bar: 100 ms, 100%. (B) λsniff_unc measured from iGluSnFr signals is isotropic (n = 10 for each direction, black and gray markers represent scans parallel and perpendicular to axons, respectively) and only slightly exceeds λsniff_syn obtained following synaptic glutamate release. (C) 2P scan of a dye-filled spine incubated in 20 μM CNQX and 1 μM TTX to isolate NMDA receptors. Uncaging spots (green) were separated by 500 nm and applied at 5 s intervals to account for the substantially slower kinetics of NMDA-R mediated uEPSCs. Lower panel: λNMDA after glutamate uncaging (n = 12). (D) Example traces of NMDA receptor-mediated uEPSCs (asterisk, time of uncaging, cell voltage clamped at +40 mV). uEPSCs are still clearly seen at a distance of 2 μm and their kinetics are substantially slower. To reliably quantify peak amplitudes of even the smallest responses uEPSCs were fitted with a two-exponential function (gray line, see Methods). Note that even remotely evoked uEPSCs (>1500 nm) evoke clear currents demonstrating pronounced diffusional propagation of released glutamate. (E) Widespread activation of PSD95-GCaMP6f following a single uncaging pulse confirms large action range of glutamate at NMDA receptors. Three two-photon scans (taken from the 20 Hz time series quantified in F) in the dendritic region of CA1 before and after the uncaging pulse (green circle indicates uncaging site, 15 μM glycine to allow NMDA-R activation at resting potential, 20 μM CNQX, 1 μM TTX). Note the appearance of bright spine head-shaped structures following glutamate uncaging which occur even outside a 2 μm range (gray dashed circles). Colored squares indicate example ROIs used to calculate the fluorescence over time traces displayed in F. (F) Average ROI fluorescence over time illustrating the pronounced calcium increases induced in spine heads by activation of NMDA receptors following glutamate uncaging (asterisk, colors of traces correspond to the ROIs shown in E. (G) Estimation of λNMDA from the spatial distribution of calcium responses (PSD95-GCaMP6f) around the uncaging point. The histogram plots the frequency of responding pixels (for threshold details, see Methods) along the radial distance from the uncaging site (black bars, “responding,” aggregated results over 66 uncaging events). The white bars show the number of pixels in the acquired image along the radial distance. The ratio of the black over the white bars represents the experimental probability of observing a calcium response at a given distance (blue markers, fraction of responding pixels). This probability drops with distance and follows a λNMDA_GCaMP. Notably, λNMDA_GCaMP as assessed here (blue dashed line) matches the one extracted from uncaging iGluSnFr responses (B) well.
Figure 4
Figure 4
Glutamate uncaging beyond the nearest synaptic neighbor distance activated also activates synaptic AMPA receptors. (A) Maximum intensity projection (MIP) of CA1 pyramidal cell dendrite dialyzed with 25 μM AlexaFluor 594 scanned with a two-photon microscope. Solitary spines were selected to avoid coactivation of neighboring structures. Lower image illustrates positioning of a sequence of glutamate uncaging points (green dots, step size 100 nm) to probe the spatial dependence of uEPSC amplitudes. Single image scanned at higher resolution. (B) Example current traces recorded in whole-cell voltage clamp mode showing the gradual decline of the response magnitude with distance. Light pulses (0.6 ms, asterisks) were applied at 1 Hz. Gray lines show fitted with a two-exponential function used to determine the peak amplitude. Note that even uEPSCs evoked at >400 nm peak within approximately 3–4 ms reflecting the rapid diffusional propagation of glutamate. Throughout the study we used the following conditions for isolating AMPA-Rs: 720 nm, 0.6 ms, 23 mW, 5 mM MNI-caged glutamate in presence of 1 μM TTX, 50 μM APV, 10 μM Gabazine. (C) Summary graph of the distance-dependent decay of the amplitude of uEPSCs (n = 27 spines), which could be well approximated by an exponential function with a length constant λ (dashed black line). Fitting of the individual amplitudes over distance revealed the indicated average value of λ. Applying 10 identical glutamate uncaging pulses at 1 Hz at the spine head yielded stable responses (yellow circles at 0 nm, n = 8) indicating that desensitization or run-down of receptors is negligible. (D) Left: 2P-photon scan of a spine incubated in 1 μM tfb-TBOA, 100 μM APV, 40 μM MK801, 10 μM gabazine, and 1 μM TTX. Uncaging responses were probed over an extended distance by additional uncaging spots (green dots, step size 100 nm). Middle: Example uEPSCs (averages) taken from the three distances indicated. Note the prominent residual current at 1000 nm (compare to B). Asterisk, time of uncaging pulse; gray line, uEPSC fit. Right: Extended action range of uncaged glutamate in the presence of tfb-TBOA. Blue markers represent the average decay of uEPSCs measured from 21 spines yielding an average λ as indicated. Dashed gray line shows the control λ (450 nm) as determined in C. (E) as in (AC) but slices were kept at 32 °C. Compared to results obtained at room temperature the action range of uncaged glutamate at AMPA-Rs is only slightly shortened at 32 °C suggesting that transmembraneous transport of glutamate (highly temperature dependent) is too slow to modify extracellular glutamate signaling on this short spatial scale. Around 32 spines yielded the average λ as indicated. Gray dashed line shows the control λ (450 nm) at room temperature (cf C).
Figure 5
Figure 5
Extracellular temporal integration of glutamatergic released in submicron perisynaptic neighborhood. (A) Adult mice (6 weeks) show a reduced glutamate action range at AMPA receptors (n = 39). Conditions as in Figure 4AC. Traces represent the averages of n = 39 recordings. For comparison the right panel also shows the λ determined for adolescent mice (gray dashed line). (B) In an animal model of chronic temporal lobe epilepsy (suprahippocampal kainic acid, injection-induced status epilepticus, n = 15) there is a significant extension of the action range of uncaged glutamate at AMPA receptors back to levels seen in adolescent mice (n = 25, P = 0.024, studentized bootstrap test for difference in means). Note that the two fits (black and gray; 450 nm control group, Fig. 4AC dashed lines) are almost indistinguishable. (C) Left panel, dye-filled spine used to probe the summation of coincident activity in the spine-surrounding extracellular space. Three uncaging spots (1, 2, 3) were applied at the three distances indicated. The responses when the three uncaging spots were applied sequentially are shown in the right panel, top row (asterisks, time of uncaging pulse). Bottom row shows the response to synchronous uncaging at the three spots (left, blue, “triple spot”) in comparison to an arithmetic sum (middle, Σ (1, 2, 3)) of the three responses shown in the top row. The overlay on the right shows that the triple response clearly exceeds the arithmetic sum. (D) As in C but the three spots were all placed right at the spine head. To mimic the weaker response obtained by uncaging spots 2 and 3 in C the uncaging laser power per spot was reduced to 70% and 50%. Scaling as in (C). The responses when the three uncaging spots were applied sequentially are shown in the right panel, top row. Bottom row shows the response to synchronous uncaging at the three spots (“triple spot”, 100%, 70%, and 50% of laser power as in top row) in comparison to an arithmetic sum (Σ (1, 2, 3)). The overlay on the right clearly shows equal response amplitude indicating that the supra-additive summation is not a function of the spine or dendrite. (E) Summary of n = 11 (panel C) and n = 34 (panel D) experiments demonstrating a significantly larger response when uncaging spots were distributed in the neuropil and involved diffusion in the extracellular space.
Figure 6
Figure 6
2P-glutamate uncaging does not overwhelm transporters and mimics multivesicular release. (A) In order to test the dependence of λ on the amount of glutamate released by uncaging, 10 points were placed from 0 to 900 nm from the edge of the spine head (left panel, green dots). The uncaging power at the objective was set at 18, 23, or 27 mW (changing the free glutamate concentration to ~61%, 100%, and ~137%, respectively, due to the two-photon immanent nonlinear, quadratic, dependence of the uncaging rate on the laser power). All three power levels were tested at each of the 19 spines in a randomized order. Single responses from representative spines are shown in black, with their double exponential fits in gray (right panel). (B) λ at AMPA-Rs at low (red), medium (blue), and high laser power (green) extracted from all spines recorded as in A. (C) λ values plotted against the peak amplitude of the uncaging currents recording when uncaging at 0 nm. Note that while the amplitude of the uEPSCs significantly varied with laser power (horizontal gray bars and asterisks, repeated measures ANOVA, Tukey posthoc), λ did not decrease when releasing fewer molecules of glutamate despite a significant reduction in uEPSC amplitude suggesting that transporters are not overwhelmed and AMPA-Rs are operating in a near linear range (repeated measures ANOVA, Tukey posthoc). In contrast, releasing more glutamate did lead to a significant increase in the length constant λ (vertical gray bar and asterisk, Repeated measures ANOVA, Tukey HSD posthoc) indicating that at higher glutamate concentrations further signs of transporter saturation can be observed. Also note that the amplitude varies linearly with the estimated amount of uncaged glutamate, also suggesting that AMPA-Rs are operating in a near linear range. (D) Dye-filled dendrite with spines used to probe the optical resolution of our uncaging system in brain slices. The imaging scanner was used to monitor the fluorescent emission from a single spine (blue line, 820 nm). The uncaging laser (720 nm) produced a series of light spots similar to uncaging (Δx 100 nm) but the closest spot was placed directly onto the spine head (yellow dots) to measure the maximal bleaching amplitude of the spine with the line scans of the imaging laser. (E) Bleaching amplitude steeply drops off with distance from the spine. Top panel: Repetitive line scans through the spine head (color legend on the right edge). Asterisks indicate the times when bleaching spots were applied. Bleaching spots were sequentially moved towards the spine. Note that bleaching is clearly seen only with the third from last spot (200 nm) due to the small size of the bleaching spot generated by the uncaging laser. Bottom panel: average fluorescence of the scanned lines used to quantify the bleaching amplitudes. (F) Summary graph of six experiments as illustrated in D and E to extract an estimate of the FWHM of the diffraction limited spot of the uncaging laser. Normalized bleaching amplitudes extracted from line scans (as in E) are shown as blue squares. As the dimension of our detector of bleaching, the spine volume, is much larger than the bleaching spots (as opposed to the typically used sub-resolution-sized beads typically used in in vitro measurements) the blue squares do not directly yield the spatial resolution or PSF. To illustrate this relationship, the green area shows the volume occupied by a spine and the obtained bleaching is half maximal then, when the PSF is centered on the edge of the spine (dashed line). The PSF then bleaches only the left half of the spine (green dash), whereas the right half hits the extracellular space (gray dash). Maximum bleaching occurs only when the PSF is fully contained within the spine volume. Therefore, the distance-dependent bleaching amplitudes (blue squares) provide the integral of the PSF (green area under the PSF curve) and must be fitted by a Gaussian CDF (“integral of Gaussian”, gray line) to extract the approximated shape of uncaging system’s PSF (dashed line) and the FWHM. This analysis suggests that the optical resolution of our uncaging system was close to the theoretical optimum, FWHM = 278 nm (dashed line). (G) Comparison of the estimated PSF (as in F) to the λ values at AMPA-Rs and NMDA-Rs, respectively. Note that the latter two clearly exceed the optical resolution of our uncaging system. (H) Fluorescence correlation spectroscopy approach to estimate the 2P-uncaging volume. Fluctuations in emission of a 50 nM TMR-dextran3kD solution during exposure to the stationary uncaging laser beam (720 nm, NA 1) was recorded for 120 s and used to calculate the autocorrelogram (black dots). Fitting the autocorrelogram with an autocorrelation function assuming a 3D Gaussian volume (yellow) yielded 16.8 diffusing dye molecules in the effective detection volume. Together with the known dye concentration this estimates the excitation volume to be approximately 0.2 fl (including γ-factor correction, for details, see Methods). Lower panel shows the residuals of the fit (for details of residuals, see Methods).
Figure 7
Figure 7
Synaptically released glutamate regularly coactivates neighboring synapses to a small extend. (A) AMPA receptor-mediated population synaptic responses in hippocampal slices are enhanced by glutamate acting on neighboring synapses. Left panel, summary of the first slopes of fEPSPs recorded in CA1 Str. rad. Note the slight, but statistically a significant decrease in fEPSPs upon application of the glutamate scavenger system (GPT, n = 9; “no drug” control experiment with placebo solution exchange, n = 11). Middle panel, the inhibitory effect of GPT is more pronounced on the second, facilitated fEPSPs, which is associated with a higher spatial density of releasing synapses. The letters “a” and “b” denote the times of the example traces illustrated in the right panel. Right panel, example traces illustrating the effect of GPT on population synaptic responses. (B) The glutamate scavenger system GPT is too slow to inactivate glutamate immediately after release in the synaptic cleft; the amplitude of miniature EPSCs remains unaffected. Miniature EPSCs were recorded in dissociated cultured neurons. As the nearest neighbor distance of synapses in cultured neurons is too large (≥1 μm) to allow for cross-talk, the amplitude of these currents is a measure of intrasynaptic AMPA receptor activation only. The letters “a” and “b” denote the times of the example traces illustrated in the right panel.

References

    1. Abbott LF, Regehr WG. 2004. Synaptic computation. Nature. 431:796–803. - PubMed
    1. Anders S, Minge D, Griemsmann S, Herde MK, Steinhauser C, Henneberger C. 2014. Spatial properties of astrocyte gap junction coupling in the rat hippocampus. Phil Trans R Soc B Biol Sci. 369:(1654):20130600. - PMC - PubMed
    1. Armbruster M, Dulla CG, Diamond JS. 2020. Effects of fluorescent glutamate indicators on neurotransmitter diffusion and uptake. Elife. 9:10404–10426. - PMC - PubMed
    1. Arnth-Jensen N, Jabaudon D, Scanziani M. 2002. Cooperation between independent hippocampal synapses is controlled by glutamate uptake. Nat Neurosci. 5:325–331. - PubMed
    1. Asztely F, Erdemli G, Kullmann DM. 1997. Extrasynaptic glutamate spillover in the hippocampus: dependence on temperature and the role of active glutamate uptake. Neuron. 18:281–293. - PubMed

Publication types

MeSH terms

Substances