. 2022 Apr;13(2):1177-1196.
doi: 10.1002/jcsm.12887. Epub 2022 Jan 21.

Nampt activator P7C3 ameliorates diabetes and improves skeletal muscle function modulating cell metabolism and lipid mediators

Affiliations

Nampt activator P7C3 ameliorates diabetes and improves skeletal muscle function modulating cell metabolism and lipid mediators

Ravikumar Manickam et al. J Cachexia Sarcopenia Muscle. 2022 Apr.

Abstract

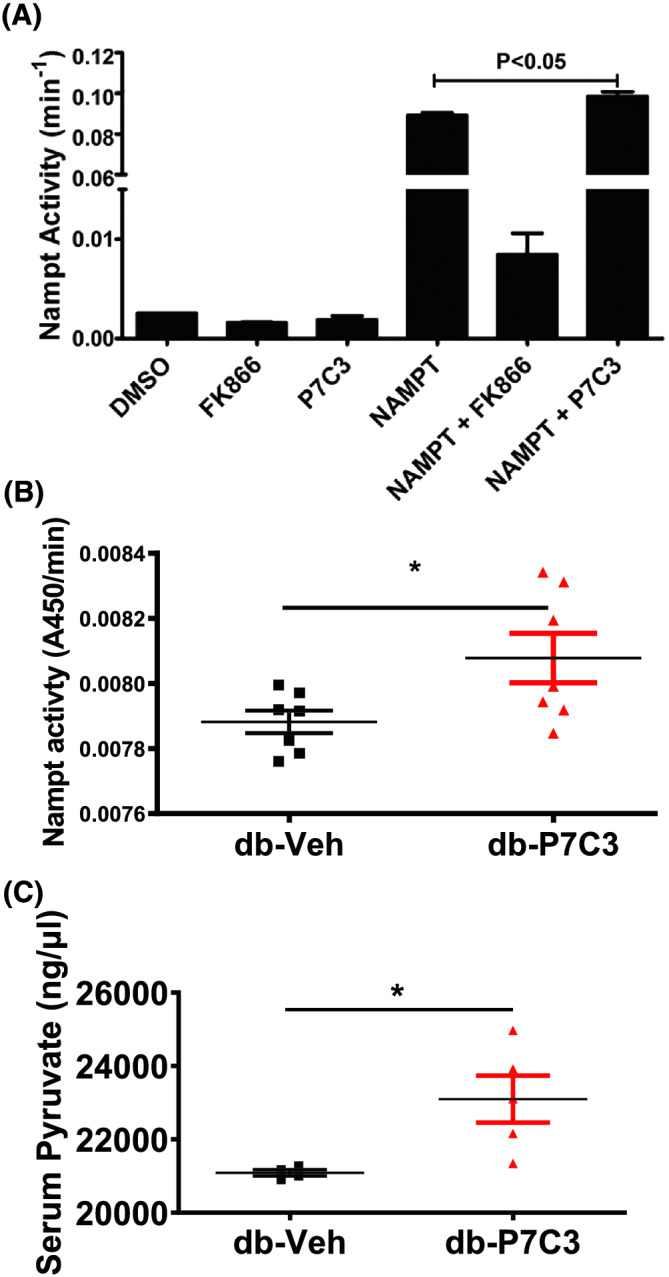
Background: Nicotinamide phosphoribosyltransferase (Nampt), a key enzyme in NAD salvage pathway is decreased in metabolic diseases, and its precise role in skeletal muscle function is not known. We tested the hypothesis, Nampt activation by P7C3 (3,6-dibromo-α-[(phenylamino)methyl]-9H-carbazol-9-ethanol) ameliorates diabetes and muscle function.

Methods: We assessed the functional, morphometric, biochemical, and molecular effects of P7C3 treatment in skeletal muscle of type 2 diabetic (db/db) mice. Nampt+/- mice were utilized to test the specificity of P7C3.

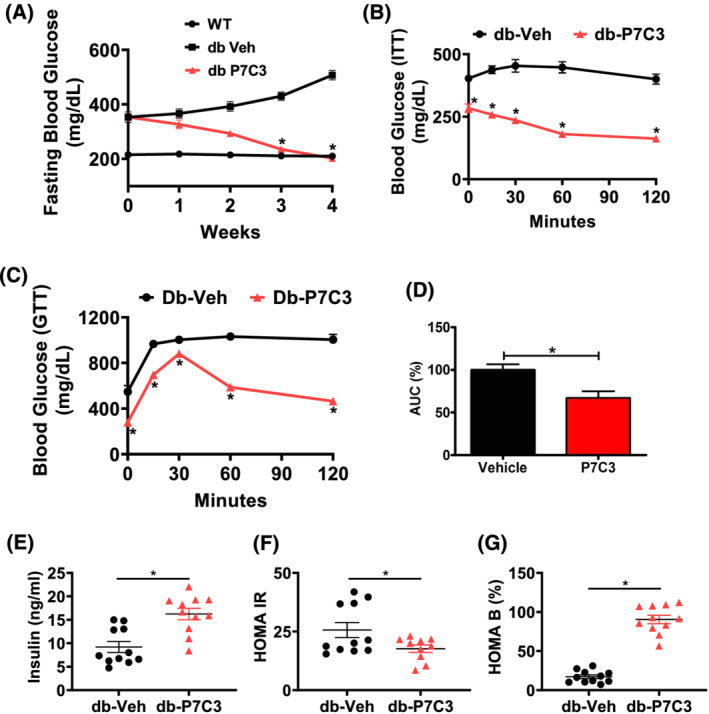
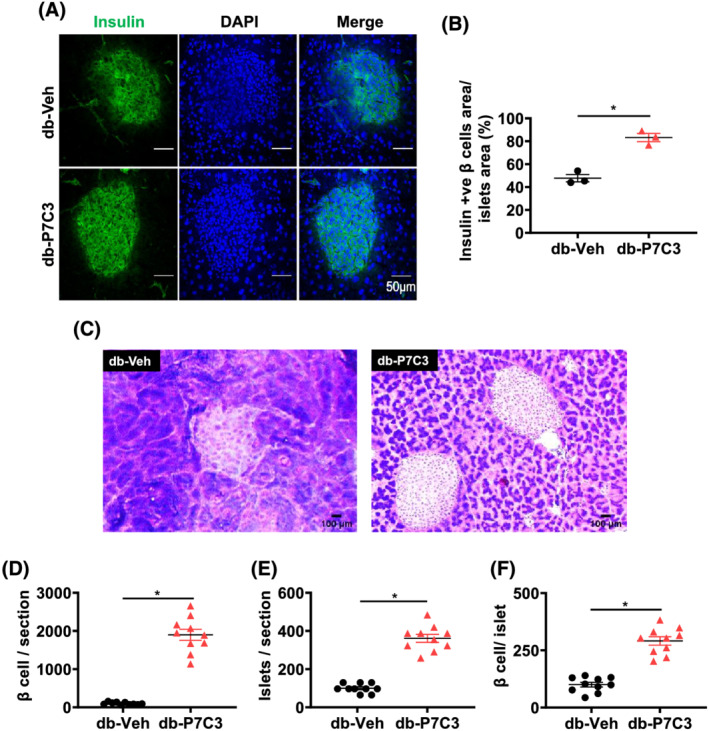
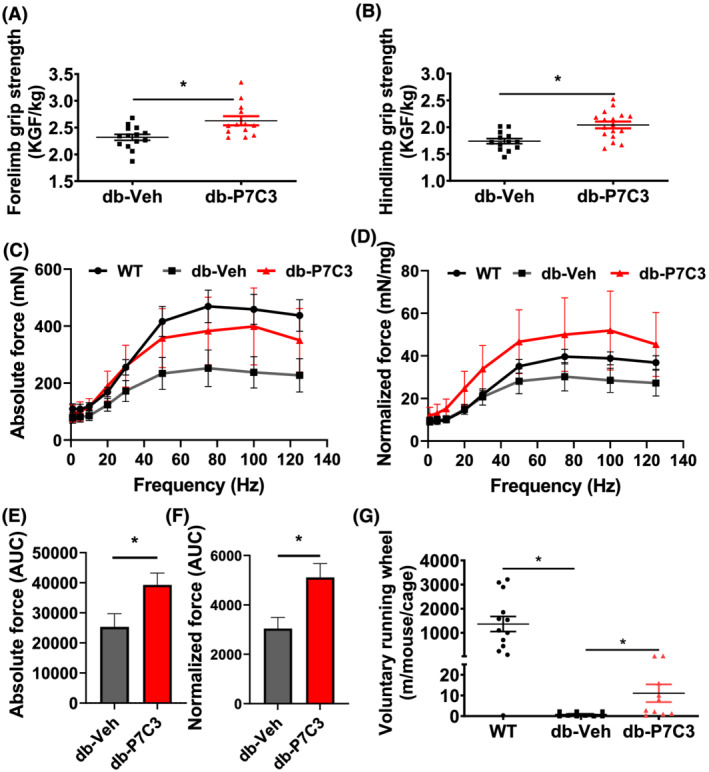
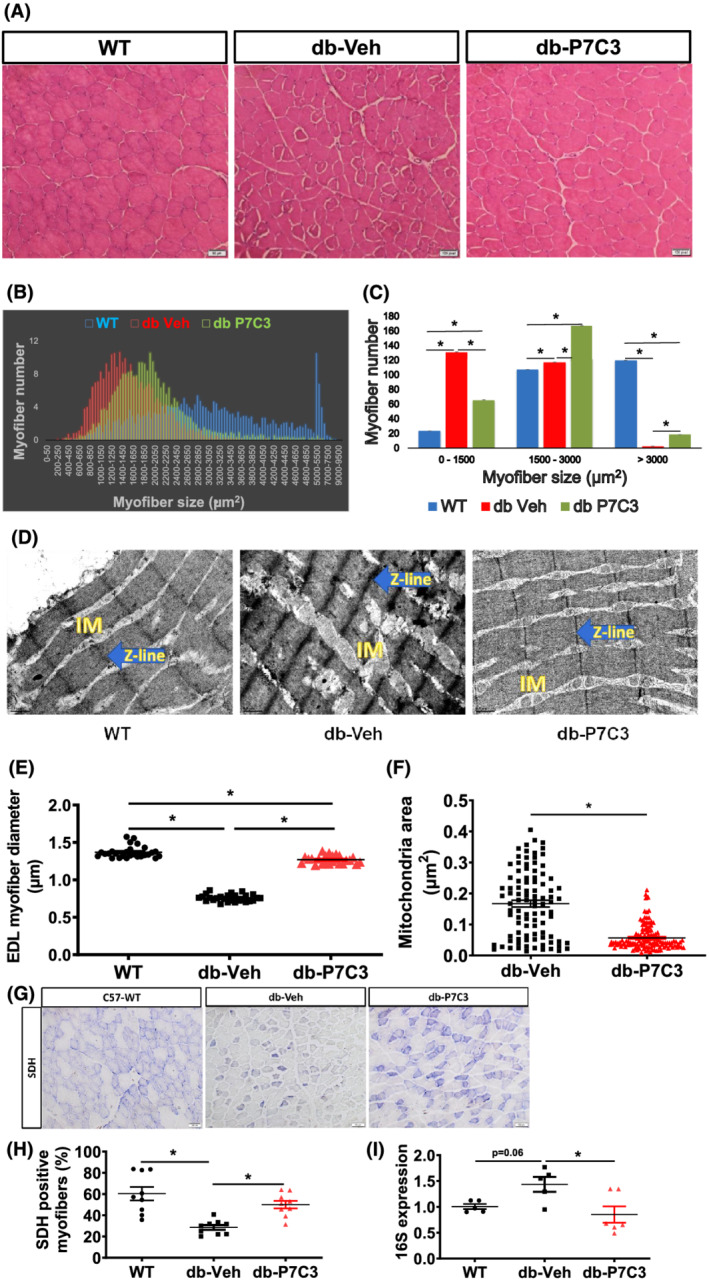
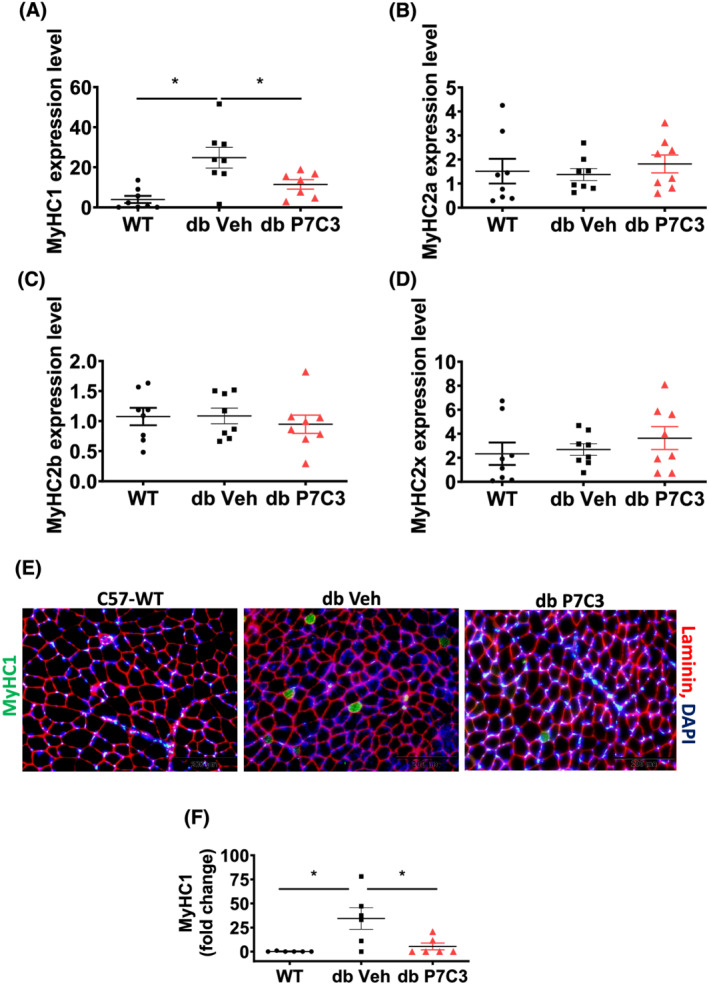
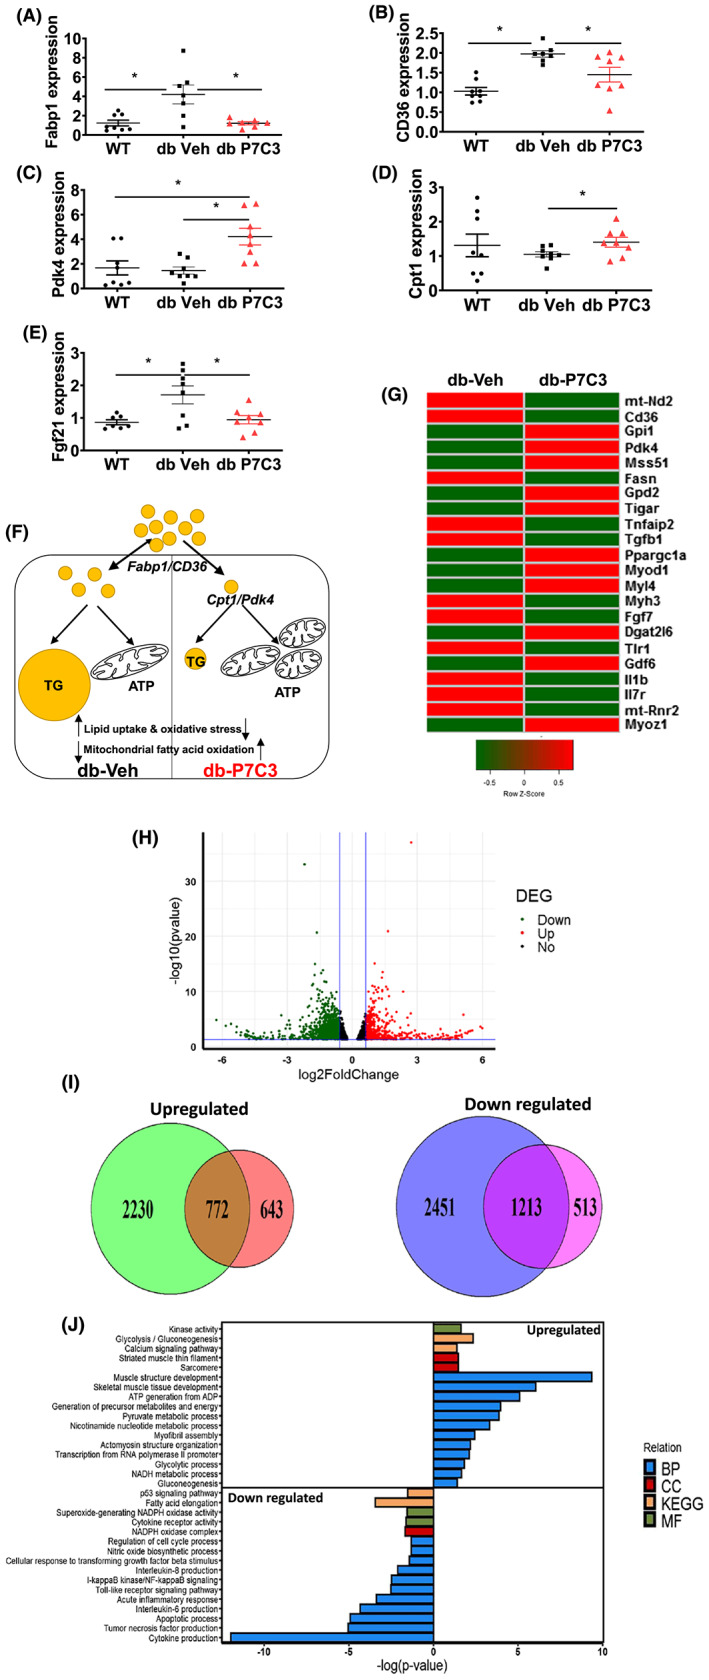
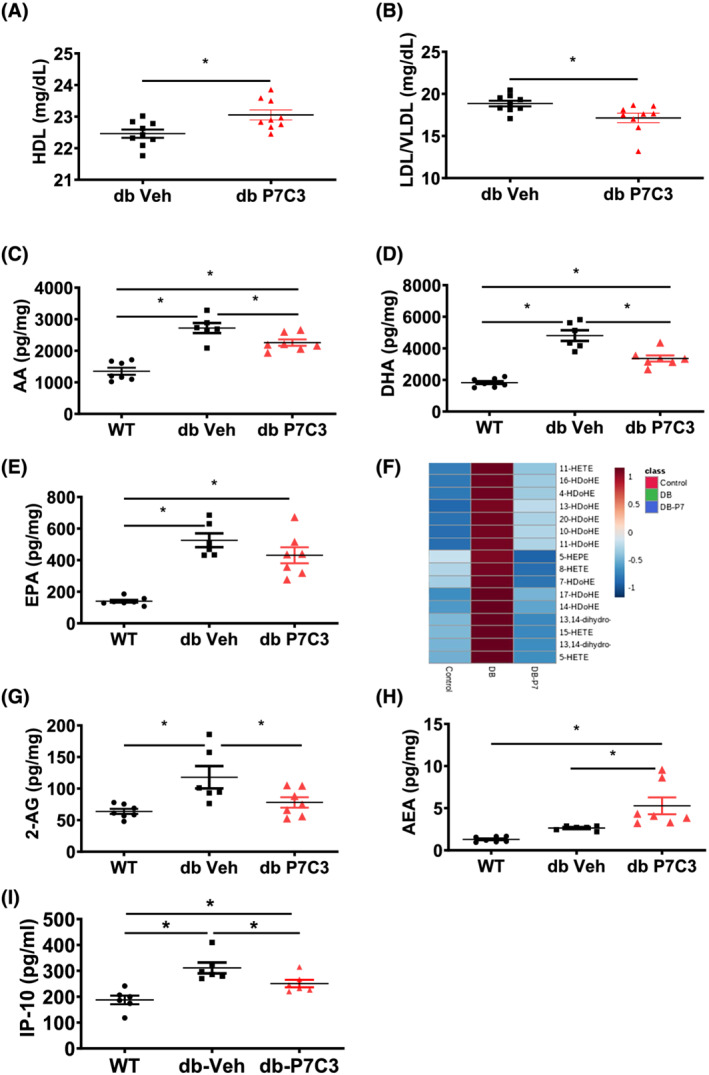
Results: Insulin resistance increased 1.6-fold in diabetic mice compared with wild-type mice and after 4 weeks treatment with P7C3 rescued diabetes (P < 0.05). In the db-P7C3 mice fasting blood glucose levels decreased to 0.96-fold compared with C57Bl/6J wild-type naïve control mice. The insulin and glucose tolerance tests blood glucose levels were decreased to 0.6-fold and 0.54-folds, respectively, at 120 min along with an increase in insulin secretion (1.76-fold) and pancreatic β-cells (3.92-fold) in db-P7C3 mice. The fore-limb and hind-limb grip strengths were increased to 1.13-fold and 1.17-fold, respectively, together with a 14.2-fold increase in voluntary running wheel distance in db-P7C3 mice. P7C3 treatment resulted in a 1.4-fold and 7.1-fold increase in medium-sized and larger-sized myofibres cross-sectional area, with a concomitant 0.5-fold decrease in smaller-sized myofibres of tibialis anterior (TA) muscle. The transmission electron microscopy images also displayed a 1.67-fold increase in myofibre diameter of extensor digitorum longus muscle along with 2.9-fold decrease in mitochondrial area in db-P7C3 mice compared with db-Veh mice. The number of SDH positive myofibres were increased to 1.74-fold in db-P7C3 TA muscles. The gastrocnemius and TA muscles displayed a decrease in slow oxidative myosin heavy chain type1 (MyHC1) myofibres expression (0.46-fold) and immunostaining (6.4-fold), respectively. qPCR analysis displayed a 2.9-fold and 1.3-fold increase in Pdk4 and Cpt1, and 0.55-fold and 0.59-fold decrease in Fgf21 and 16S in db-P7C3 mice. There was also a 3.3-fold and 1.9-fold increase in Fabp1 and CD36 in db-Veh mice. RNA-seq differential gene expression volcano plot displayed 1415 genes to be up-regulated and 1726 genes down-regulated (P < 0.05) in db-P7C3 mice. There was 1.02-fold increase in serum HDL, and 0.9-fold decrease in low-density lipoprotein/very low-density lipoprotein ratio in db-P7C3 mice. Lipid profiling of gastrocnemius muscle displayed a decrease in inflammatory lipid mediators n-6; AA (0.83-fold), and n-3; DHA (0.69-fold) and EPA (0.81-fold), and a 0.66-fold decrease in endocannabinoid 2-AG and 2.0-fold increase in AEA in db-P7C3 mice.

Conclusions: Overall, we demonstrate that P7C3 activates Nampt, improves type 2 diabetes and skeletal muscle function in db/db mice.

Keywords: Insulin sensitivity; Nampt; P7C3; Pathophysiology; Physical performance; Skeletal muscle.


Conflict of interest statement

The authors declare that there is no conflict of interest.

Patent awarded to USF: US Patent 11,007,178, 2021. USF Provisional patent filed: 19A039PR.

Figures

Figure 1
Figure 1
P7C3 reverses hyperinsulinaemia and hyperglycaemia of the diabetic mice. The 16‐week‐old type 2 diabetic (db/db) mice were administered daily with intraperitoneal dose of P7C3 (10 mg/kg/day) or vehicle for 4 weeks. (A) Weekly 6 h fasting blood glucose levels of the db/db mice treated with P7C3 or vehicle (n = 11 each), and the C57Bl/6J WT (n = 6) naïve control mice. (B) Insulin tolerance test (ITT) of 6 h fasted db/db mice injected with 1 U/kg body weight human insulin intraperitoneally (n = 4–5 per group). (C) Glucose tolerance test (GTT) of overnight fasted db/db mice injected with 2 g/kg body weight D‐(+)‐glucose intraperitoneally and measured with GOD‐POD method (n = 5 mice per group). (D) The area under the curve of GTT was obtained using the trapezium method and expressed in percentage. (E) The circulating insulin levels in blood serum and (F) homeostatic model of insulin resistance (HOMA IR) and (G) homoeostatic model of pancreatic β‐cells (HOMA B) expressed in percentage. Data are expressed as mean ± SEM; *P < 0.05; P7C3 vs. vehicle‐treated db/db mice. The age‐matched WT mice were used as naïve control to determine the baseline weekly fasting blood glucose levels.
Figure 2
Figure 2
P7C3 increases the pancreatic β cells number and function of the db/db mice. (A) Immunohistochemical staining of insulin secreting pancreatic β cells (green). (B) The insulin secreting pancreatic β cells area per islet of Langerhans expressed as percentage. (C) Gomori aldehyde fuchsin staining of pancreas. (D) The number of pancreatic β cells per section, and (E) number of islet of Langerhans per section and (F) number of pancreatic β cells per islet of Langerhans. Data are expressed as mean ± SEM; *P < 0.05; P7C3 vs. vehicle‐treated db/db mice.
Figure 3
Figure 3
P7C3 enhances physical performance of db/db mice. (A) Fore‐limb grip strength and (B) hind‐limb grip strength measured and expressed as KGF/kg body weight. (C) The absolute force frequency and (D) normalized force frequency of the extensor digitorum longus muscles. (E) The area under the curve of the absolute muscle force frequency and (F) the normalized muscle force frequency. (G) The voluntary running wheel performance of the mice expressed in metres. Data are expressed as mean ± SEM; *P < 0.05; P7C3 vs. vehicle‐treated db/db mice. The age‐matched WT mice were used as naïve control to determine the baseline muscle force frequencies of the extensor digitorum longus muscle.
Figure 4
Figure 4
P7C3 ameliorates the diabetic skeletal muscle phenotype of the db/db mice. (A) Haematoxylin and eosin stained ×20 magnification images of the tibialis anterior muscles of the diabetic mice treated with vehicle or P7C3 and the wild‐type naïve control mice. (B,C) analysis of 250 random myofibres cross‐sectional area of the haematoxylin and eosin‐stained images per section and 3 such section was counted per mice, where n = 3 mice per group displaying a shift towards medium‐sized myofibres in the db‐P7C3 treated mice (green) compared to db‐Veh treated mice (red). The age‐matched WT naïve control mice myofibres display an increased larger sized myofibres (blue). (D) Transmission electron microscopy images of the extensor digitorum longus muscle of the WT naïve control, db‐Veh and db‐P7C3 treated mice. The intermyofibrillar mitochondria (IM), and the Z‐lines (blue arrows) are distinguished in the TEM images taken at ×30 000 magnification. (E) Analysis of the extensor digitorum longus muscles myofibre diameter of TEM images at ×30 000 magnifications (n = 8–9 myofibres per image, and 3 such images were analysed per group). Data are expressed as mean ± SEM; *P < 0.05. (F) Mitochondrial area measured from db‐Veh or db‐P7C3 expressed as μm2. (G) Succinate dehydrogenase (SDH) staining of TA muscle, (H) quantification of SDH stained myofibres, and (I) relative mRNA expression of 16S in wild‐type (WT), db‐Veh, and db‐P7C3. Data are expressed as mean ± SEM, P < 0.05.
Figure 5
Figure 5
P7C3 decreases MyHC1 expression levels and immunostained myofibres numbers in gastrocnemius muscle. Relative gene expression levels of myosin heavy chain fibre types: (A) MyHC1, (B) MyHC2a, (C) MyHC2b, and (D) MyHC2x. (E) Immunolabelling of tibialis anterior muscle cryosections of WT, db‐Veh, and db‐P7C3 treated mice. MyHC1 positive myofibres are immunostained in green, laminin in red and DAPI for nuclei in blue. (F) Quantification of MyHC1 depicting the fold change in green myofibre immunostaining. Data are expressed as mean ± SEM; *P < 0.05. The age‐matched WT mice was used as naïve control to determine the baseline expression levels of the myosin heavy chain fibre types in gastrocnemius muscle and immunostaining of MyHC1 in tibialis anterior muscle.
Figure 6
Figure 6
P7C3 treatment increases fatty acid oxidation and decrease myofibre stress in db/db mice. Relative mRNA expression levels of (A) Fabp1, (B) CD36, (C) Pdk4, (D) Cpt1, (E) Fgf21, and (F) schematic depiction of differential gene responses in db‐P7C3 and db‐Veh showing increased mitochondrial fatty acid oxidation and decreased fatty acid uptake and oxidative stress with P7C3 treatment in diabetic mice (G) RNA‐seq analysis of skeletal muscle from db‐Veh and db‐P7C3 (H) volcano plot showing differentially expressed genes (DEG) in db_P7C3‐db_Veh. The up‐regulated genes (red), and the down‐regulated genes (green) with a fold change <0.6, and with P < 0.05 (I) Venn diagram showing comparison of the differentially up‐regulated genes in db_P7C3‐db_Veh and down‐regulated genes in db_Veh‐WT_Veh, and provides the P7C3 treatment responsive genes with 772 genes up‐regulated and 1213 genes down‐regulated, respectively (J) the top 17 up‐regulated and 16 down‐regulated pathways in the biological processes (BPs), chemical component (CC), Kyoto encyclopaedia of genes and genomes (KEGG) and molecular function (MF) pathways. Data expressed is mean ± SEM, *P < 0.05. The age‐matched WT mice was used as naïve control to determine the baseline expression levels of the key genes involved in fatty acid uptake, oxidation, and oxidative stress in gastrocnemius muscle.
Figure 7
Figure 7
Cholesterol and lipid mediators are differentially altered in P7C3 treated db/db mice. (A) high‐density lipoprotein, (B) low‐density lipoprotein/very low‐density lipoprotein ratio. Panels (C–H) lipid mediators measured in wild‐type (WT), db‐Veh and db‐P7C3 treated mice, where (C) arachidonic acid; AA, (D) docosahexaenoic acid; DHA, (E) Eicosapentaenoic acid; EPA, (F) heat map of the pro‐inflammatory AA derivatives HETEs, and the anti‐inflammatory DHA derivatives HDoHEs and the EPA derivative HEPE (G) endocannabinoids, 2‐arachidonoylglycerol; 2‐AG and (H) anandamide; AEA. (I) Levels of serum IP‐10 (C‐X‐C motif chemokine ligand 10) measured by Luminex‐MagPix magnetic bead immunoassay. Data are expressed as mean ± SEM; *P < 0.05. The age‐matched WT mice were used as naïve control to determine the baseline lipid mediators levels in gastrocnemius muscle.
Figure 8
Figure 8
P7C3 treatment improves the Nampt enzymatic activity. (A) Enzymatic activity of recombinant Nampt was measured every 5 min for 1 h. Negative control (DMSO), positive control (Nampt enzyme), Nampt inhibitor (FK866), and Nampt activator (P7C3) were all utilized to assess the enzymatic activity. (B) The gastrocnemius muscle Nampt enzymatic activity was measured every 5 min for a total duration of 40 min. Data are expressed as mean ± SEM; *P < 0.05 of the absorbance measured at 20 min during the linear range. (C) Serum pyruvate activity of db‐Veh and db‐P7C3 treated mice. Data expressed as mean ± SEM with P < 0.05.

References

    1. Wojciechowska J, Krajewski W, Bolanowski M, Kręcicki T, Zatoński T. Diabetes and cancer: a review of current knowledge. Exp Clin Endocrinol Diabetes 2016;124:263–275. - PubMed
    1. Phielix E, Mensink M. Type 2 diabetes mellitus and skeletal muscle metabolic function. Physiol Behav 2008;94:252–258. - PubMed
    1. Galicia‐Garcia U, Benito‐Vicente A, Jebari S, Larrea‐Sebal A, Siddiqi H, Uribe KB, et al. Pathophysiology of type 2 diabetes mellitus. Int J Mol Sci 2020;21. 10.3390/ijms21176275 - DOI - PMC - PubMed
    1. Twig G, Zucker I, Afek A, Cukierman‐Yaffe T, Bendor CD, Derazne E, et al. Adolescent obesity and early‐onset type 2 diabetes. Diabetes Care 2020;43:1487–1495. - PubMed
    1. Mesinovic J, Zengin A, De Courten B, Ebeling PR, Scott D. Sarcopenia and type 2 diabetes mellitus: a bidirectional relationship. Diab Metab Syndr Obes 2019;12:1057–1072. - PMC - PubMed

Publication types

MeSH terms