. 2022 Feb;9(2):106-121.
doi: 10.1002/acn3.51482. Epub 2022 Jan 21.

Quantifying regional α -synuclein, amyloid β, and tau accumulation in lewy body dementia

Affiliations

Quantifying regional α -synuclein, amyloid β, and tau accumulation in lewy body dementia

Rebecca L Miller et al. Ann Clin Transl Neurol. 2022 Feb.

Abstract

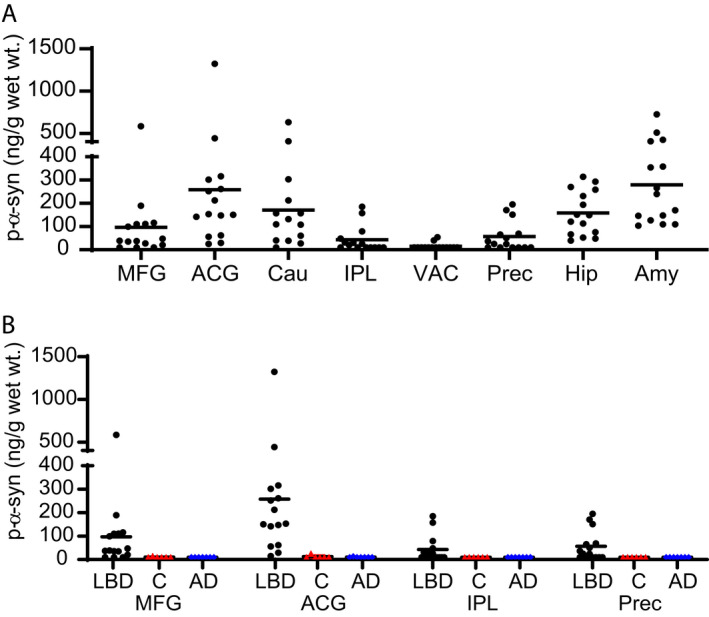
Objective: Parkinson disease (PD) is defined by the accumulation of misfolded α-synuclein (α-syn) in Lewy bodies and Lewy neurites. It affects multiple cortical and subcortical neuronal populations. The majority of people with PD develop dementia, which is associated with Lewy bodies in neocortex and referred to as Lewy body dementia (LBD). Other neuropathologic changes, including amyloid β (Aβ) and tau accumulation, occur in some LBD cases. We sought to quantify α-syn, Aβ, and tau accumulation in neocortical, limbic, and basal ganglia regions.

Methods: We isolated insoluble protein from fresh frozen postmortem brain tissue samples for eight brains regions from 15 LBD, seven Alzheimer disease (AD), and six control cases. We measured insoluble α-syn, Aβ, and tau with recently developed sandwich ELISAs.

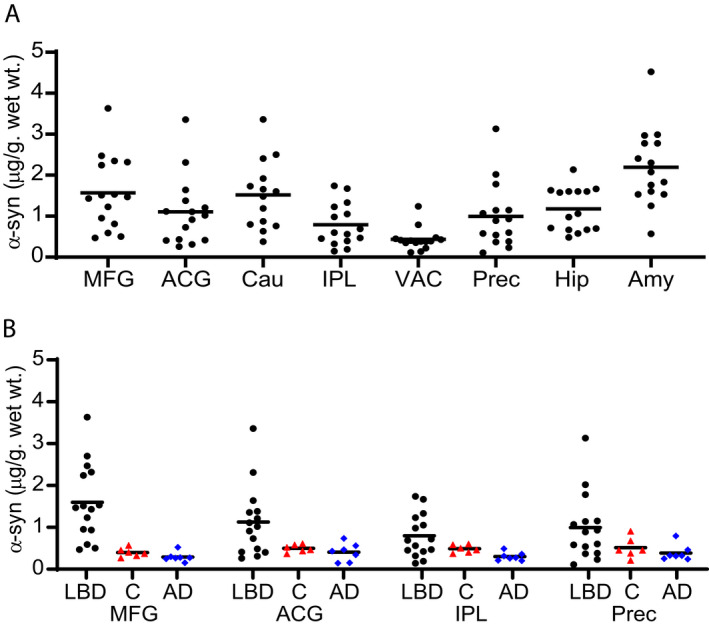
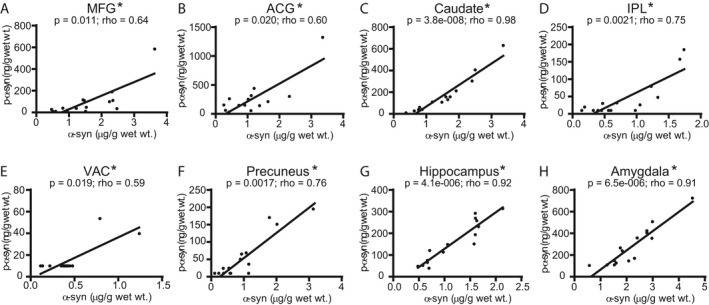
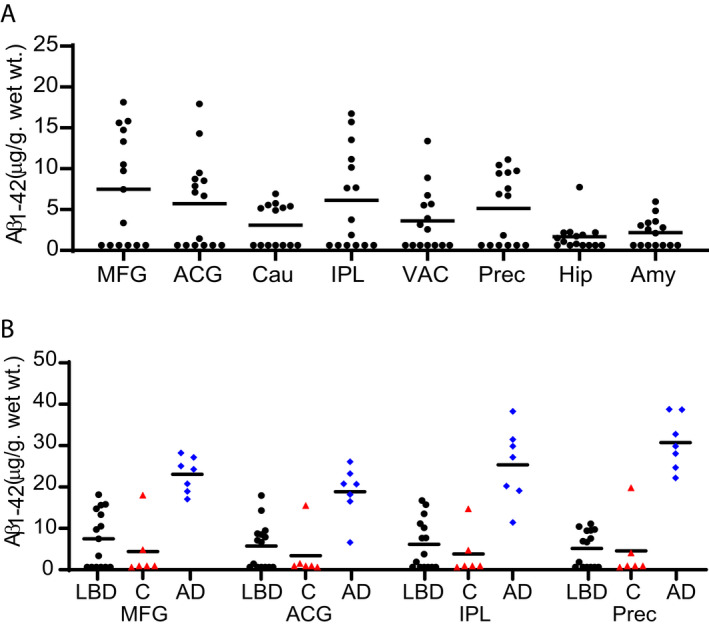
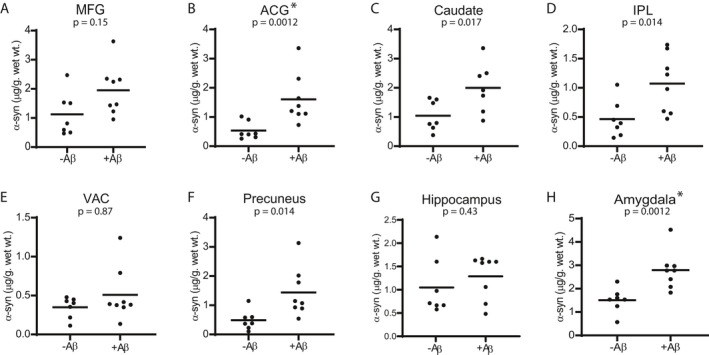
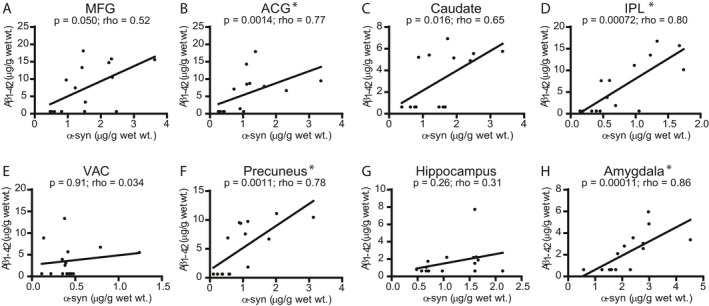
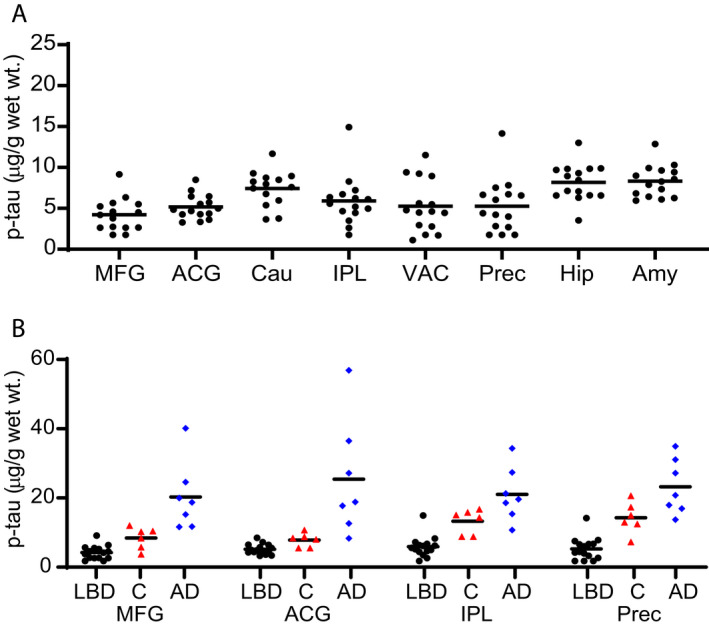
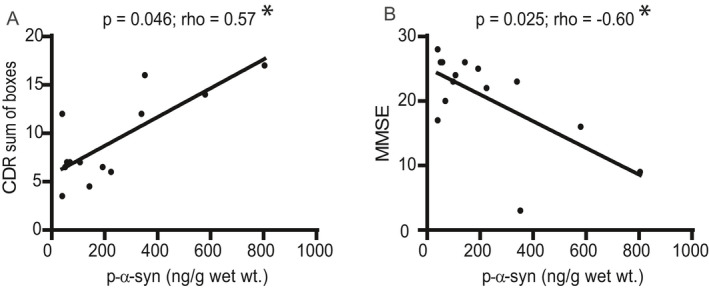
Results: We detected a wide range of insoluble α-syn accumulation in LBD cases. The majority had substantial α-syn accumulation in most regions, and dementia severity correlated with neocortical α-syn. However, three cases had low neocortical levels that were indistinguishable from controls. Eight LBD cases had substantial Aβ accumulation, although the mean Aβ level in LBD was lower than in AD. The presence of Aβ was associated with greater α-syn accumulation. Tau accumulation accompanied Aβ in only one LBD case.

Interpretation: LBD is associated with insoluble α-syn accumulation in neocortical regions, but the relatively low neocortical levels in some cases suggest that other changes contribute to impaired function, such as loss of neocortical innervation from subcortical regions. The correlation between Aβ and α-syn accumulation suggests a pathophysiologic relationship between these two processes.


Figures

Figure 1
Figure 1
Regional distribution of insoluble α‐syn concentration in LBD and Control cases (Syn1‐13G5B ELISA). Levels of insoluble α‐syn were measured by sandwich ELISA in eight brain regions from LBD (black circles) cases (A) and four brain regions from control (red triangles) and AD (blue diamonds) cases (B). There was a wide range of α‐syn accumulation among LBD cases, including some cases in which α‐syn accumulation overlapped with levels measured in control cases. The highest median levels of α‐syn deposition were in MFG, caudate, and amygdala. Control and AD cases had low levels of insoluble α‐syn in all brain regions tested. The lower limit of quantification (LLQ) for the ELISA was 0.15 ng/mL or 0.05 µg/g wet wt tissue. All samples were in the quantifiable range. The α‐syn level in MFG was significantly higher in LBD compared with control cases. Data were analyzed with the two‐tailed Mann–Whitney test using a significance level of 0.05 and corrected for multiple comparisons with the Holm‐Bonferroni method. Mid‐Frontal Gyrus (MFG), Anterior Cingulate Gyrus (ACG), Caudate (Cau), Inferior Parietal Lobule (IPL), Visual Association cortex (VAC), Precuneus (Prec), Hippocampus (Hip), and Amygdala (Amy).
Figure 2
Figure 2
Regional distribution of p‐α‐syn concentration in LBD and Control cases (pSyn/81A‐Syn1B ELISA). Levels of insoluble p‐α‐syn were measured by sandwich ELISA in eight brain regions from LBD (black circles) cases (A) and four brain regions from control (red triangles) and AD (blue diamonds) cases (B). The highest median levels of p‐α‐syn in LBD cases were in ACG, caudate, and amygdala. The LLQ for the ELISAs was 0.15 ng/mL or 9.99 ng/g wet wt tissue. All samples from control and AD cases were below the lower limit of quantification for p‐α‐syn except one control MFG sample and one control ACG sample. The α‐syn level in ACG was significantly higher in LBD compared with control cases. Data were analyzed with the two‐tailed Mann–Whitney test using a significance level of 0.05 and corrected for multiple comparisons with the Holm‐Bonferroni method.
Figure 3
Figure 3
Correlations between insoluble α‐syn (Syn1‐13G5B ELISA) and p‐α‐syn (pSyn/81A‐Syn1B ELISA) concentration measurements in LBD cases. We observed significant correlations (Spearman) between α‐syn and p‐α‐syn in all eight brain regions: (A) MFG, (B) ACG, (C) caudate, (D) IPL, (E) VAC, (F) precuneus, (G) hippocampus, (H) amygdala, with the strongest correlations (Spearman rho values > 0.9) in caudate, hippocampus, and amygdala. Data were corrected for multiple comparisons with the Holm‐Bonferroni method. Lines were generated by linear regression.
Figure 4
Figure 4
Regional distribution of insoluble Aβ(1‐42) concentration in LBD, Control, and AD cases. Levels of insoluble Aβ(1‐42) were measured by sandwich ELISA. (A) Eight of the 15 cases had measurable Aβ levels in most brain regions. For LBD cases with measurable Aβ, the highest levels of Aβ were found in MFG, ACG, IPL, and Precuneus. (B) Aβ levels were measurable in two of the six control (red triangles) cases. One control case had high levels of Aβ in all brain regions. AD (blue diamonds) cases had significantly higher Aβ levels compared with the subgroup of LBD (black circles) cases that had detectable Aβ levels in all four brain regions examined. The LLQ for the ELISAs was 14.17 pg/mL or 0.63 µg/g wet wt tissue. Data were analyzed with the two‐tailed Mann–Whitney test using a significance level of 0.05 and corrected for multiple comparisons with the Holm‐Bonferroni method.
Figure 5
Figure 5
Comparison of insoluble α‐syn concentrations (Syn1‐13G5B) between LBD with measurable Aβ and LBD cases without measurable Aβ. The subgroup with Aβ accumulation had significantly higher α‐syn concentrations in ACG and amygdala, compared with the subgroup without measurable Aβ. Mean α‐syn levels were 18% higher in the PD with Aβ accumulation subgroup in the hippocampus and were 32%–73% in other regions. Data were analyzed with the two‐tailed Mann–Whitney test using a significance level of 0.05 and corrected for multiple comparisons with the Holm‐Bonferroni method.
Figure 6
Figure 6
Correlations between α‐syn (Syn1‐13G5B ELISA) and Aβ concentrations in LBD cases. We observed significant correlations (Spearman) between α‐syn and Aβ in four (ACG (B), IPL (D), precuneus (F), and amygdala (H)) of the eight brain regions. Data were corrected for multiple comparisons with the Holm‐Bonferroni method. Lines were generated by linear regression.
Figure 7
Figure 7
Regional distribution of phospho‐tau concentration in LBD, Control, and AD cases. Levels of insoluble phospho‐tau were measured by sandwich ELISA in eight brain regions from LBD cases (A), four brain regions from control (red triangles) cases, and four regions from AD cases (blue diamonds) (B). The LBD cases (black circles) had low levels of p‐tau. One LBD case had elevated p‐tau accumulation relative to other LBD cases in all regions, although it was still within the range of the levels found in control cases. The LBD cases were significantly lower than the control and AD cases. The highest levels of p‐tau in LBD cases were found in the caudate, hippocampus, and amygdala. The LLQ for the ELISAs was 17.5 ng/mL or 1.75 µg/g wet weight tissue. Data were analyzed with the two‐tailed Mann–Whitney test using a significance level of 0.05 and corrected for multiple comparisons with the Holm‐Bonferroni method.
Figure 8
Figure 8
Correlations between cognitive measures (CDR sum of boxes and MMSE) and neo‐cortical phospho‐alpha‐synuclein levels in LBD cases. We analyzed correlations (Spearman) between cognitive measures (CDR sum of boxes, MMSE) and total aggregated p‐α‐syn in the neocortical regions of MFG, IPL, VAC, and precuneus. (A) There was a significant correlation between CDR sum of boxes score and neocortical p‐α‐syn (p = 0.046, rho = 0.57). (B) There was also a significant negative correlation between MMSE and neocortical p‐α‐syn (p = 0.025; rho = −0.60). Lines were generated by linear regression.

References

    1. Forno LS. Neuropathology of Parkinson's disease. J Neuropathol Exp Neurol. 1996;55(3):259‐272. - PubMed
    1. Appel‐Cresswell S, Vilarino‐Guell C, Encarnacion M, et al. Alpha‐synuclein p.H50Q, a novel pathogenic mutation for Parkinson's disease. Mov Disord. 2013;28(6):811‐813. - PubMed
    1. Golbe LI, Di Iorio G, Bonavita V, Miller DC, Duvoisin RC. A large kindred with autosomal dominant Parkinson's disease. Ann Neurol. 1990;27(3):276‐282. - PubMed
    1. Kruger R, Kuhn W, Muller T, et al. Ala30Pro mutation in the gene encoding alpha‐synuclein in Parkinson's disease. Nat Genet. 1998;18(2):106‐108. - PubMed
    1. Lesage S, Anheim M, Letournel F, et al. G51D alpha‐synuclein mutation causes a novel parkinsonian‐pyramidal syndrome. Ann Neurol. 2013;73(4):459‐471. - PubMed

Publication types